Abstract
The nonisothermal degradation process of Folnak® drug samples was investigated by simultaneous thermogravimetric and differential thermal analysis in the temperature range from an ambient one up to 810°C. It was established that the degradation proceeds through the five degradation stages (designated as I, II, III, IV, and V), which include: the dehydration (I), the melting process of excipients (II), as well as the decomposition of folic acid (III), corn starch (IV), and saccharose (V), respectively. It was established that the presented excipients show a different behavior from that of the pure materials. During degradation, all excipients increase their thermal stability, and some kind of solid–solid and/or solid–gas interaction occurs. The kinetic parameters and reaction mechanism for the folic acid decomposition were established using different calculation procedures. It was concluded that the folic acid decomposition mechanism cannot be explained by the simple reaction order (ROn) model (n = 1) but with the complex reaction mechanism which includes the higher reaction orders (RO, n > 1), with average value of <n > = 1.91. The isothermal predictions of the third (III) degradation stage of Folnak® sample, at four different temperatures (Tiso = 180°C, 200°C, 220°C, and 260°C), were established. It was concluded that the shapes of the isothermal conversion curves at lower temperatures (180–200°C) were similar, whereas became more complex with further temperature increase due to the pterin and p-amino benzoic acid decomposition behavior, which brings the additional complexity in the overall folic acid decomposition process.
Key words: degradation, drug stability, folic acid, Folnak®, nonisothermal kinetics
INTRODUCTION
Folic acid, N-[ρ-[[(2-amino-4-hydroxy-6-pteridinyl) methyl]-amino]benzoyl]-l-glutamic acid, is a B complex vitamin containing a pteridine moiety linked by a methylene bridge to para-aminobenzoic acid, which is joined by a peptide linkage to glutamic acid. Conjugates of folic acid are present in a wide variety of foods, particularly liver, kidneys, yeast, and leafy green vegetables (1).
From the clinical pharmacology point of view, folic acid acts on megaloblastic bone marrow to produce a normoblastic marrow. In man, an exogenous source folate is required for nucleoprotein synthesis and the maintenance of normal erythropoiesis (2,3). Folic acid is the precursor of tetrahydrofolic acid, which is involved as a cofactor for transformylation reactions in the biosynthesis of purines and thymidylates of nucleic acids (4). Impairment of thymidylate synthesis in patients with folic acid deficiency is thought to account for the defective deoxyribonucleic acid synthesis that leads to megaloblast formation and megaloblastic and macrocytic anemias. Folic acid is effective in the treatment of megaloblastic anemias due to a deficiency of folic acid (as may be seen in tropical or nontropical sprue) (5,6) and in anemias of nutritional origin, pregnancy, infancy, or childhood.
The potential applications of thermal analysis (7) in the pharmaceutical industry are numerous on account of the chemical–physical aspects of investigations. Among others, these include the method of development, characterization and specification of active or inactive ingredients, safety analysis or routine analysis in quality control, and stability studies. In the solid state, the temperatures required for thermal degradation at a measurable rate are generally far higher than the temperatures existing, even locally, during photolysis (8), so the mechanisms of thermal and photochemical degradation can be expected to differ. On the other hand, it is well known that at high temperature, the chemical reactivity of drug active components, both pure and in the mixture, can be modified, thus leading to uncontrollable reactions with consequent dangerous situations. For this reason, it is important to determine the thermal stability (i.e., the temperature range over which a substance does not degrade with an appreciable rate).
This work aims to study the thermal stability and the kinetic behavior of nonisothermal degradation process of Folnak® (folic acid), the commercial drug product manufactured by Sigmapharm D.O.O. company (Niš, Serbia). In this paper, thermogravimetric (TG), derivative (DTG), and differential thermal analysis (DTA) data from Folnak® samples have been investigated, and the global kinetic analysis has been carried out.
MATERIALS AND METHODS
Materials
The one wrapping Folnak® tablets was supplied by Sigmapharm D.O.O. company (Niš, South Serbia). The one tablet of ardently yellow color was taken for the experimental measurements. Tablet was minced to the powdered form. The powder Folnak® samples were used for thermoanalytical (TA) measurements. In the Folnak® tablet, the active pharmaceutical ingredient represents the folic acid. The excipients in the investigated Folnak® tablets are the following: corn starch, saccharose, stearic acid, and polyethylene glycol 4000 (PEG-4000). The mentioned excipients, except the stearic acid, belong to the binders. The binders hold the ingredients in a tablet together. Both solution and dry binders are presented in the investigated samples. The stearic acid belongs to the lubricants. The lubricants prevent ingredients from clumping together and from sticking to the tablet punches.
Methods
Thermoanalytical Measurements
The SDT 2960, simultaneous TG-DTA thermobalance manufactured by TA Instruments (109 Lukens Dr, New Castle, DE 19720-2765, USA) was used to examine the nonisothermal degradation of Folnak® samples. The Folnak® powder samples were heated at a rates of β = 2.5°C, 5°C, 10°C, and 20°C min−1, and the flow rate for the purge gas (Nitrogen—N2) was 100 mL min−1. The samples were heated in the temperature range from an ambient one up to 810°C. The loading amount of the Folnak® powder samples was 2.0 ± 0.1 mg. A black residue was left in the pan, which was assumed to be carbon.
KINETIC PROCEDURE
Kinetic analysis of a degradation process is traditionally expected to produce an adequate kinetic description of the process in terms of the reaction model and the Arrhenius parameters using a single-step kinetic equation (9):
 |
1 |
where t is the time, T the temperature, α the extent of conversion (increasing from 0 to 1), and f(α) the reaction model. The temperature dependence of the rate constant is introduced by replacing k(T) with Arrhenius equation, which gives:
 |
2 |
where A (the pre-exponential factor) and Ea (the apparent activation energy) are the Arrhenius parameters and R is the gas constant. For the nonisothermal conditions, dα/dt in Eq. 2 is replaced with β(dα/dT), where β is the linear heating rate, giving
 |
3 |
Integration of Eq. 3, after replacing Ea/RT by x and rearranging, leads to
 |
4 |
where
 |
4a |
and g(α) is the function of the reaction model in the integral form and p(x) (x = Ea/RT) is a function known as Arrhenius integral or the temperature integral that has no analytical solution but can be resolved either by numerical methods (using Mathematica software developed by Wolfram Research, Inc., in the form ExpIntegralEi[x] presented as the exponential integral function which can be numerically integrated) or by using different approximations. In this paper, we used Senum and Yang fourth rational approximation for p(x) function (10). The integral on the right-hand side of Eq. 4 cannot be analytically evaluated, and therefore, Eq. 4 cannot be expressed in a closed form. If a change of variable from T to x is made and initial temperature T0 is taken sufficiently low so that the reaction is very slow at the start of the experiment, the integral can be expressed in the form given in Eq. 4a.
The extent of conversion, α (fraction of compound decomposed), in nonisothermal conditions can be presented as  , where %mi is the initial percent mass, %mT the percent mass at temperature T, and %mf the final percent mass, as they are collected from an nonisothermal TG experiment. The three components (A, Ea, and f(α)) called the “kinetic triplet” define both in Eqs. 2 and 3 a single-step reaction that disagrees with the multistep nature of decomposition that usually occurs in the solid state.
If a process involves several steps with different apparent activation energies, the relative contributions of these steps to the overall reaction rate will vary with both temperature and the extent of conversion. This means that the effective activation energy determined from the analysis of the results will also be a function of these two variables. An alternative approach to kinetic analysis is the model-free methods (11,12) that allow us for evaluating Arrhenius parameters without choosing the reaction model. The isoconversional methods (12) make up the best representation of the model-free approach. The isoconversional integral methods differ according to the approximation used to calculate the p(x) function. These methods yield the variation of the effective activation energy as a function of the extent of conversion (11). The knowledge of the dependence of Ea on α allows detecting multistep processes and predicting some mechanistic conclusions on the reaction kinetics over a wide temperature range (11).
Kissinger–Akahira–Sunose Method
Kissinger–Akahira–Sunose (KAS) (13,14) method is the isoconversional integral method based on the Coats–Redfern (15) approximation of the Arrhenius integral (approximation for the p(x) function is: p(x) = x−2exp(-x)). It was shown that:
 |
5 |
Thus, for α = const., the plot ln(β/T2) versus 1/T, obtained from curves recorded at several heating rates, should be a straight line whose slope can be used to evaluate the apparent activation energy.
Ozawa Method
If we use the Doyle’s approximation (16) for p(x) (the Doyle approximation for p(x) is: p(x) = 0.0048 exp(−1.052x)), we get from Eq. 4 the popular equation proposed by Ozawa (17) for determining the apparent activation energy by the isoconversional methods:
 |
6 |
Equation 6 shows that, provided that g(α) is constant at a given value of α, the slope of the plots of ln β versus 1/T for particular values of α lead to the apparent activation energy as function of α independently of the kinetic model fitted by the reaction.
Determination of the Kinetic Model
Once the apparent activation energy has been determined, we can find the kinetic model which best describes a measured set of thermoanalytical data. Málek (18) has shown that for this purpose, it is useful to define two special functions y(α) and z(α) which can easily be obtained by simple transformation of experimental data.
Through the rearrangement of Eq. 2, the function y(α) is defined as:
 |
7 |
The y(α) function is proportional to the f(α) function. Thus, by plotting y(α) dependence, normalized within (0,1) interval, the shape of function f(α) is obtained. The y(α) function is, therefore, characteristic for a given kinetic model f(α), and it can be used as a diagnostic tool for the kinetic model determination. The characters of the y(α) function with respect to various kinetic model functions are reported previously (18). If the temperature rises at a constant rate β, integration of Eq. 2 gives:
 |
8 |
By combining Eqs. 2 and 8, an alternative kinetic equation is obtained:
 |
9 |
After rearrangement of Eq. 9, the z(α) function is defined as (19):
 |
10 |
where π(x) is the temperature integral.
The shape of the y(α) function as well as the maximum  of the z(α) function can be used as a guide to select the kinetic model. Both αm (the maximum of the y(α) function) and
  parameters are especially useful in this respect. Their combination allows the determination of the most suitable kinetic model (18).
Prediction of Isothermal Degradation Process
Prediction of isothermal degradation process from nonisothermal runs is of scientific and practical interest. First, good prediction of isothermal degradation process from parameters obtained during nonisothermal degradation clearly validates the reaction model. Second, the isothermal degradation characterization is notoriously challenging from the experimental standpoint.
Kinetic computations can be used for drawing mechanistic conclusions or for making simulations of the process. One of the most used simulation is called “isothermal predictions” (11), which means that the nonisothermal kinetic parameters can be used to simulate the variation of the extent of conversion (α) versus time (t) for a given (constant) temperature (Tiso). Isoconversional methods are very powerful for this task because they allow these simulations to be made without any assumption on the reaction mechanism and without evaluation of the pre-exponential factor (A). These simulations can be obtained using the following equation:
 |
11 |
where tα is the time to reach a given conversion (α), β is the heating rate of the nonisothermal experiment used for the computation, and Tiso is the isothermal temperature of the isothermal simulation. In Eq. 11, the integral was evaluated by the numerical integration of the data, and the extent of conversion (α) was varied between α = 0.05 and α = 0.95. As can be seen from Eq. 11, these simulations can be done using the sole  —dependence computed with the KAS isoconversional method. Solving Eq. 11 for the different extent of conversions, the degradation process of the investigated Folnak® samples at some temperatures has been predicted.
RESULTS AND DISCUSSION
TG-DTG-DTA Curves of Folnak® Degradation Process
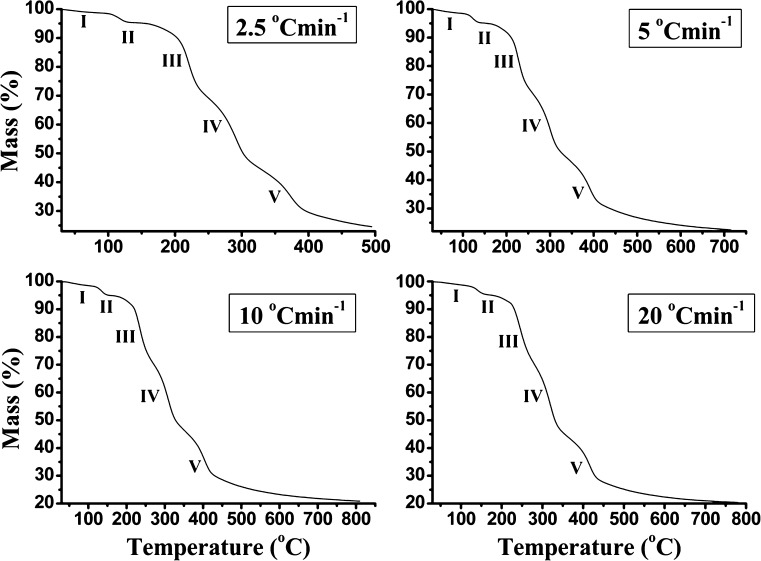
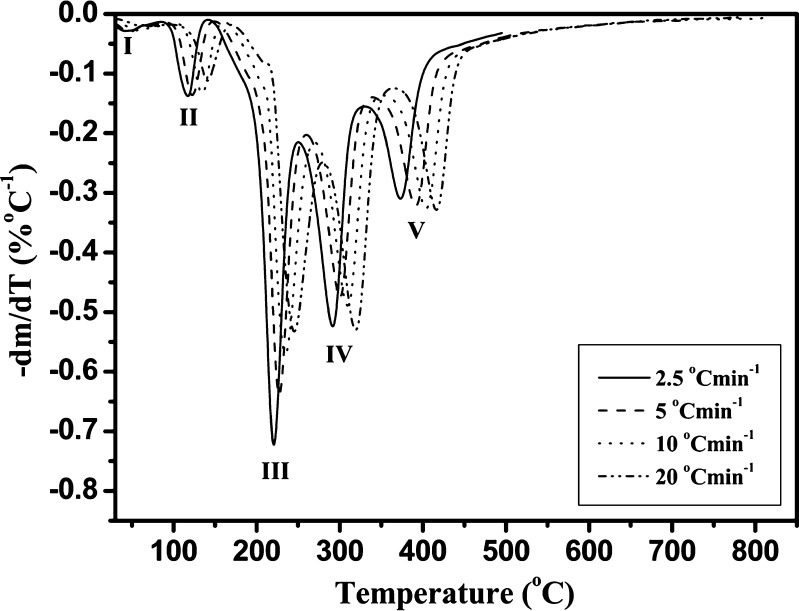
Figures 1 and 2 show the mass loss (TG) and differential mass loss (DTG) curves in relation to heating rate to a final temperature of 810°C for the Folnak® samples. All Folnak® samples exhibit same patterns of thermal degradation as the temperature is increased. The analysis of these curves demonstrates that there are five stages of mass loss profile (Fig. 1), best illustrated in the derivative curves (Fig. 2).
Fig. 1.
TG curves (mass (percent) versus T (degrees Celsius)) of the nonisothermal degradation of Folnak® sample recorded in nitrogen at heating rates of 2.5°C, 5°C, 10°C, and 20°C min−1 (the corresponding degradation stages are designated as I, II, III, IV, and V)
Fig. 2.
DTG curves (-dm/dT (percent per degrees Celsius) versus T (degrees Celsius)) of the nonisothermal degradation of Folnak® sample recorded in nitrogen at heating rates of 2.5°C, 5°C, 10°C, and 20°C min−1 (the corresponding degradation stages are designated as I, II, III, IV, and V)
The lower temperature region, from ambient up to approximately 110°C, produces mass loss which has been attributed to the polymer dehydration (20–22). The excipients as corn starch and PEG-4000 (Fig. 3) all exhibited a broad endothermic effect in the temperature range of 30–110°C due to the loss of water molecules (stage I, Figs. 1 and 2).
Fig. 3.
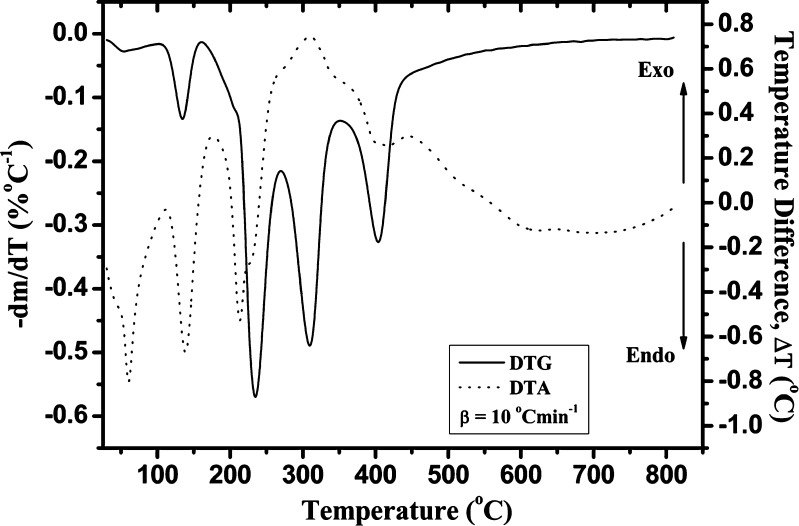
Simultaneous recorded DTA–DTG curve at a heating rate of β = 10°C min−1, for the nonisothermal degradation process of Folnak® sample
The DTA curve of the Folnak® degradation process at heating rate of 10°C min−1 (Fig. 3) shows a single sharp endothermic peak, which can be attributed to the excipients’ (in the first place for the PEG-4000 and the stearic acid excipients) melting, typical of crystalline anhydrous substances. This reaction stage (in the temperature range of 110–170°C) is designated as stage II (Figs. 1 and 2). It can be pointed out that the “chemical environmental” can influenced on the thermal characteristics of each considered excipient in drug formulation. In that sense, we may assume that the PEG-4000 excipient undergoes thermal degradation at the lower temperatures (up to 170°C) than in the case of pure compound, probably giving the two low molecular species. This process, in the case of complex drug formulations, cannot be easily detected on the recorded TA curves because many processes are continuously overlapped.
The observed melting temperatures of the excipients for nonisothermal degradation process of Folnak® sample occur in the temperature range which is higher than temperature range for melting of pure components (20–22). It can be pointed out that impure materials generally have lower melting points and exhibit less well-defined peaks in thermograms. In the absence of an interaction, this effect is usually small. For the nonisothermal degradation of Folnak® samples, we have an opposite case, which can be concluded that solid–solid interaction (23) probably exists. It can be pointed out that a noticeable upward shift of peak temperature by more than 60°C was observed (24–26).
The region of mass loss from about 170°C to 280°C is due to the folic acid in Folnak® degradation process. Namely, the main mass loss begins about 170°C, which represents the starting point for the folic acid degradation. The mass loss in this stage is about 26% of the total mass loss (Table I; stage III, Figs. 1 and 2).
Table I.
Values of Characteristic Temperatures and Mass Losses Corresponding to the Five Stages of the Nonisothermal Degradation Process of Folnak® Sample
| β (°C min−1) | Stage I | Stage II | Stage III | Stage IV | Stage V | |||||||||||||||
|---|---|---|---|---|---|---|---|---|---|---|---|---|---|---|---|---|---|---|---|---|
| T i (°C) | T m (°C) | T f (°C) | Δm I (%) | T i (°C) | T m (°C) | T f (°C) | Δm II (%) | T i (°C) | T m (°C) | T f (°C) | Δm III (%) | T i (°C) | T m (°C) | T f (°C) | Δm IV (%) | T i (°C) | T m (°C) | T f (°C) | Δm V (%) | |
| 2.5 | 30 | 40 | 90 | 1.26 | 90 | 120 | 145 | 3.42 | 145 | 220 | 250 | 26.04 | 250 | 290 | 330 | 24.87 | 330 | 375 | 495 | 19.76 |
| 5 | 30 | 45 | 95 | 1.39 | 95 | 125 | 150 | 3.46 | 150 | 225 | 260 | 24.66 | 260 | 300 | 345 | 23.54 | 345 | 395 | 715 | 24.38 |
| 10 | 30 | 55 | 105 | 1.54 | 105 | 135 | 160 | 3.49 | 160 | 235 | 270 | 24.53 | 270 | 310 | 355 | 23.59 | 355 | 405 | 740 | 24.81 |
| 20 | 30 | 65 | 110 | 1.36 | 110 | 140 | 170 | 3.41 | 170 | 245 | 280 | 24.94 | 280 | 320 | 365 | 23.52 | 365 | 415 | 775 | 23.29 |
Table I shows the values of characteristic temperatures and corresponding mass losses attached with every observed reaction stage.
It can be seen from Table I that with increase in heating rate (β), the values of characteristic temperatures (Ti—initial, Tm—maximum, and Tf—final temperatures) also increase, which is typical for thermally activated processes. Table I shows that there was a lateral shift to higher temperatures Tm as the heating rate was increased. The lateral shift has been assigned as being due to the combined effects of the heat transfer at the different heating rates and the kinetics of the degradation resulting in delayed degradation. In all heating rates, the presented excipients show a different behavior from that of the pure materials. In the case of Folnak® degradation, all excipients increase their thermal stability as can be concluded from the shift of Tm toward higher values (Table I). Therefore, some kind of solid–solid and/or solid–gas interaction must be considered as we mentioned previously.
It can be observed from Fig. 3 (DTA curve at 10°C min−1) that the folic acid does not have an observed melting temperature in the investigated Folnak® sample. In the case of Folnak® nonisothermal degradation, the third reaction stage probably proceeds through the apparent melting and degradation of folic acid, which is manifested by the highly endothermic peak with appearance of right shoulder at approximately 225°C in the DTA (Fig. 3). It can be concluded that the third DTG peak and the highly endothermic peak in the DTA were attributed to the loss of the glutamic acid moiety (27). This moiety begins to degrade at around 170°C. The DTA results showed an endothermic peak at 215°C, which was due to the initial melting followed by the degradation.
In the fourth stage, between 280°C and 365°C, the mass loss is attributed to the decomposition of corn starch (20,21,28,29). It can be seen that relatively large exothermic peak at 310°C in the DTA curve (Fig. 3) can be mainly attributed to the decomposition of amylose and amylopectin, where the former being probably the first degraded due to its linear structure (stage IV, Figs. 1 and 2) (21,30,31). It can be pointed out that corn starch decomposition is not going to end, i.e., not reach the complete conversion under the nonoxidative conditions, thereby leaving the carbon residue (32,33).
In the fifth stage, for the temperature range from 365°C to approximately 800°C, the thermal decomposition reaction of saccharose (sucrose) occurred (34), with the endothermic peak at about 400°C on the corresponding DTA curve for the heating rate of 10°C min−1 (Fig. 3). The considered reaction stage is designated as stage V. At the same time, the presence of CO2 (which evolved as a product of carbonate decomposition) at high temperature reacted with residual char to form CO also causing some mass loss (these mass losses occur after the following temperatures T = 395°C, 420°C, 435°C, and 445°C at 2.5°C, 5°C, 10°C, and 20°C min−1, respectively (Fig. 1). This additional mass loss is included in the fifth degradation stage of investigated Folnak® sample (Table I). At the end of the considered TG measurements, the carbon residue occurred as the final product.
The Relationship of the Extent of Conversion versus Temperature
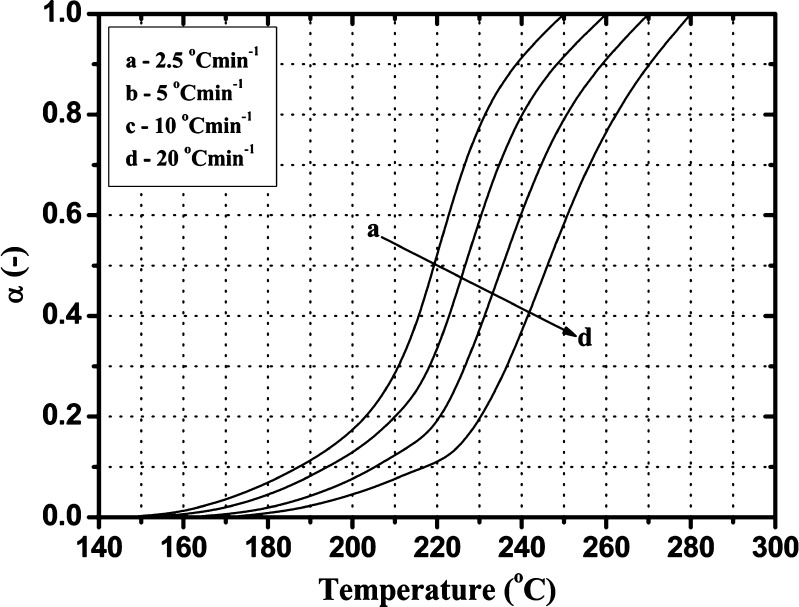
From the above analysis, we could conclude that the Folnak® degradation process mainly occurred in the stage of folic acid decomposition, so we chose this section to study the Folnak® degradation kinetics. According to the TG curves, it is depicted in Fig. 4 the relationship of the extent of conversion (α) and temperature (T) of the Folnak® samples at any moment at different heating rate in this degradation stage.
Fig. 4.
The α–T curves for the third degradation stage of the Folnak® sample at various heating rates
Figure 4 shows that the change of the extent of conversion with temperature exhibit similar trends at the different heating rate, i.e., the conversion gradually increases with the rising of temperature. The change of the extent of conversion is less at low temperature and relatively at high temperature, but the change is larger at the medium temperature. Taking conversion curve at the heating rate of 2.5°C min−1 as an example, the extent of conversion increases slowly with the increase of temperature when the temperature was lower than 205°C and larger at the range of temperature 205–230°C but slow after 230°C. Moreover, the heating rate has an important effect on the relationship curves of the conversion and temperature. The initial temperature of the third degradation stage of Folnak® sample changes little with the increasing of the heating rate, and it occurs about 145–170°C. As the heating rate is increased, there is a shift to higher temperatures for the maximum rate of degradation and the final temperature of considered degradation, which is illustrated in Fig. 1 and Table I.
Determination of Kinetic Parameters
In order to determine the kinetic parameters for the third degradation stage, we take out of 19 “α” values from the samples at different heating rates and read the corresponding temperature from the original data in Fig. 4.
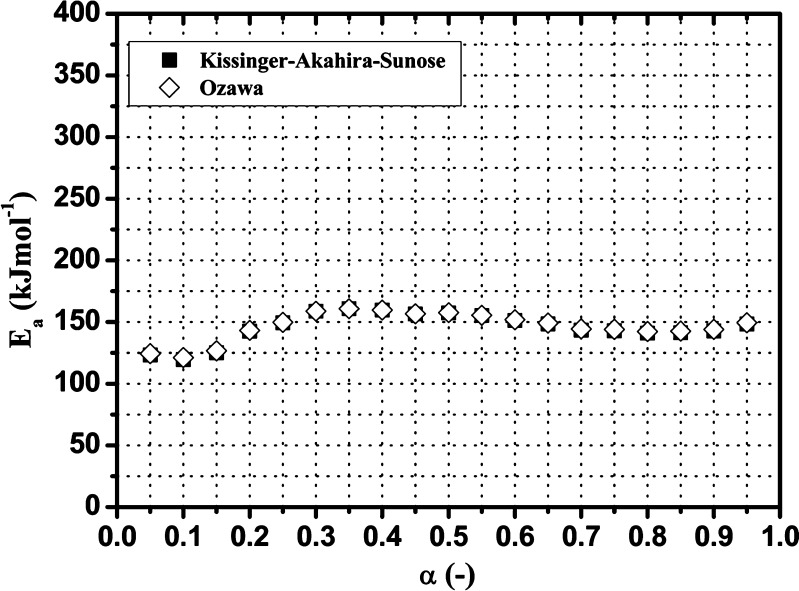
According to Eqs. 5 and 6, the apparent activation energy can be evaluated from the slope of these linear relationships. The obtained results from the applied KAS and Ozawa isoconversional methods suggest that the correlation of the regression lines is very good and the magnitude of correlation coefficient exceeds 0.99, which shows that both isoconversional methods are appropriate. Figure 5 illustrates the variations of the apparent activation energy (Ea) with the extent of conversion (α) evaluated by using KAS and Ozawa model-free methods, for the third degradation stage of Folnak® sample.
Fig. 5.
Dependence of Ea on α calculated by the Kissinger–Akahira–Sunose (KAS) and Ozawa isoconversional (model-free) methods for the third degradation stage of the Folnak® sample
From Fig. 5, we can conclude that the apparent activation energy of the considered degradation stage (stage which includes the folic acid decomposition as the active substance in the Folnak® sample) is not a definite value throughout the reaction process, which shows that the third degradation stage is a complex multistep reaction, and in the different temperature ranges, the degradation reaction has the different apparent activation energies and reaction mechanisms. However, it can be observed that there is no significant variation of the apparent activation energy values with the extent of conversion in the range of [0.30, 0.80]. Both the isoconversional methods provide a check of invariance of Ea with respect to α in the range of [0.30, 0.80], which is one of the basic assumptions in kinetic analysis of thermoanalytical data. These results indicate that the apparent activation energy in the considered α range changed slightly and the average values of Ea calculated by KAS and Ozawa model-free methods are as follows: <Ea>KAS = 152.3 kJ mol−1 and <Ea>Ozawa = 152.8 kJ mol−1. It can be observed that excellent agreement exists between these two values of Ea calculated by the mentioned methods.
The Evaluation of the Kinetic Model Function
As Folnak® constitutes complexly, its degradation reaction is actually parallel, concurrent, or consecutive reaction processes of many elementary reactions (35). In addition, thermogravimetric analysis measures the relationship between the overall quality and temperature, and α denoted that the extent of reaction is just an apparent and integrated concept, which showed that it is impossible that this change of the quality reasonably attributed some one elementary. Figure 5 shows that the apparent activation energy manifested a little variation with the extent of conversion (α) in the range of [0.30, 0.80]. So, we can approximately consider that the apparent activation energy of the Folnak® samples is a definite value in this phase, when we investigate the kinetic model. The average value of Ea evaluated by the KAS method in the conversion (α) range of [0.30, 0.80] was used for determination of the kinetic model of the third degradation stage.
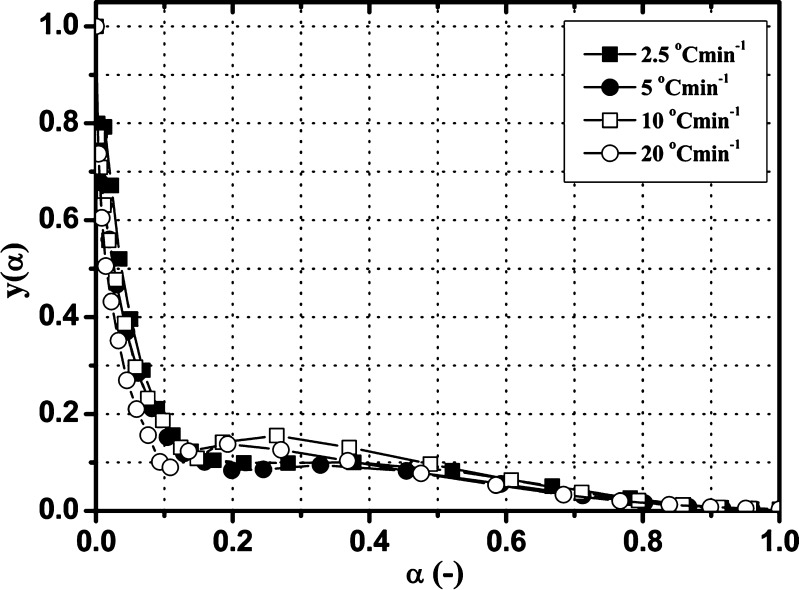
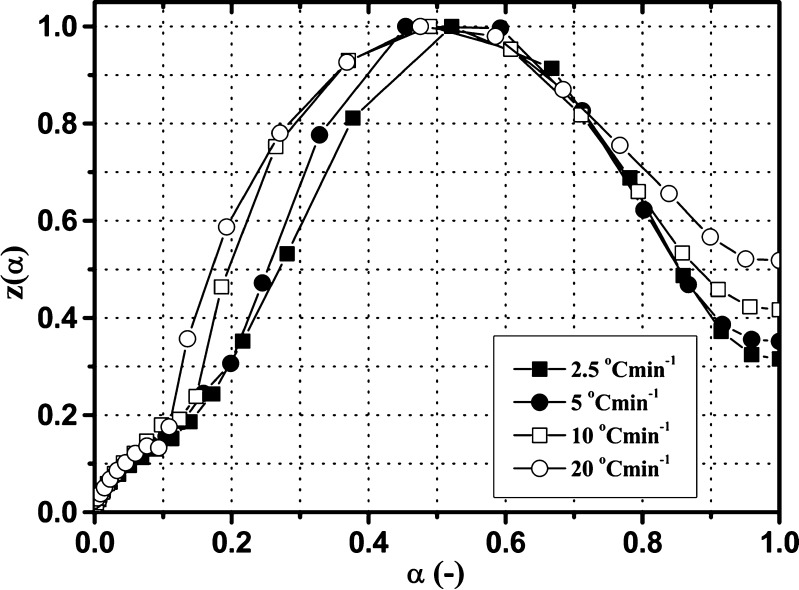
The most reliable kinetic model can be determined by comparing the y(α) and z(α) functions, according to Eqs. 7 and 10. The normalized y(α) and z(α) functions for the third degradation stage of Folnak® sample are presented in Figs. 6 and 7.
Fig. 6.
Experimental y(α) function versus α for the third degradation stage of the Folnak® sample, at the different heating rates (2.5°C, 5°C, 10°C, and 20°C min−1)
Fig. 7.
Experimental z(α) function versus α for the third degradation stage of the Folnak® sample, at the different heating rates (2.5°C, 5°C, 10°C, and 20°C min−1)
In both cases, the y(α) functions at the different heating rates are concave (Fig. 6), and the maximums of z(α) functions are  (Fig. 7).
Table II shows the values of αm and  evaluated from y(α) and z(α) functions for the third degradation stage of Folnak® sample.
Table II.
Values of Maximums (α
m and  ) Evaluated from the y(α) and z(α) Functions for the Third Degradation Stage of Folnak® Sample
| β (°C min−1) | α m |

|
|---|---|---|
| 2.5 | 0 | 0.521 |
| 5 | 0 | 0.454 |
| 10 | 0 | 0.489 |
| 20 | 0 | 0.475 |
It can be seen from Table II that the maxima of y(α) functions are situated at αm = 0, while the maxima of z(α) functions fall into the range of  .
.
The condition of  and
and  (36) should be an indication of the ROn (n > 1) kinetic model. The most probable kinetic model for the third degradation stage of Folnak® sample is, therefore, the reaction order kinetic model with n > 1.
If the kinetic model is known, the equation for nonisothermal α(T) curve can be obtained from Eq. 12. For the ROn kinetic model, it can be written in the following form:
 |
12 |
The temperature dependence of the reduced apparent activation energy (x = Ea/RT) can easily be calculated for the average value of the apparent activation energy obtained by the isoconversional method. The values of parameters n and A can be obtained by the nonlinear regression method (37–39) using the experimental data. In this study, the Levenberg–Marquardt method has been used for the calculation of the parameter values. For performing the Levenberg–Marquardt method, either general purposed mathematical software or a computer program developed in any programming language is used. In this paper, the Mathcad® computational software has been used for performing the optimization procedure. The average values of the parameters n and ln A obtained for third degradation stage of Folnak® sample are shown in Table III.
Table III.
The Kinetic Parameters Obtained by Nonlinear Regression of Nonisothermal Data Using Eq. 12 and the Constant Value of the Apparent Activation Energy (152.3 kJ mol−1) for the Third Degradation Stage of Folnak® Sample
| β (°C min−1) | 3rd Folnak® degradation stage | ||
|---|---|---|---|
| n | ln A, A (min−1) | RSS | |
| 2.5 | 1.59 | 35.31 | 0.00360 |
| 5 | 2.21 | 35.61 | 0.00397 |
| 10 | 1.85 | 35.53 | 0.00325 |
| 20 | 1.98 | 35.58 | 0.00276 |
Values of residual sum of squares (RSS) at the corresponding heating rates are also presented in the same table
It can be seen from Table III that the values of reaction order (n) fall into the range of 1.59 ≤ n ≤ 2.21. The highest value of n was observed at the heating rate of 5°C min−1.
It can be observed from Table III that the reaction order in this stage was changed from 1.59 to 2.21 according to the heating rate of the system. The observed variation of the reaction order was suggested due to the complex reaction pathways of the folic acid degradation. The pathways were composed with a series of reactions, probably the series of competing reactions, and the contribution of each pathway for the total degradation reaction was effected when the heating rate of the system was changed. Therefore, the reaction order was varied with the heating rate (Table III).
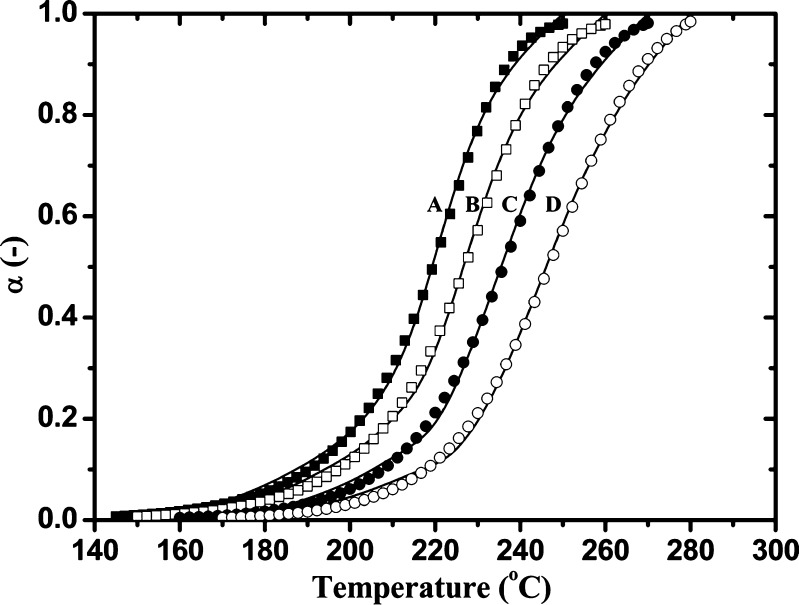
Figure 8 shows the comparison of experimental data plots (full lines) and calculated α(T) plots (point symbols) for the third degradation stage of Folnak® sample. The α(T) curves were calculated using Eq. 12 for the kinetic parameters shown in Table III. There is excellent agreement between the experimental data and the corresponding prediction of the ROn model.
Fig. 8.
Nonisothermal conversion curves for the decomposition process of the folic acid under the Folnak® degradation measured at the different heating rates: a—calculated α(T) curve at 2.5°C min−1 (black-filled square); b—calculated α(T) curve at 5°C min−1 (open square); c—calculated α(T) curve at 10°C min−1 (black-filled circle); d—calculated α(T) curve at 20°C min−1 (open circle); Full lines are the experimental conversion curves at the different heating rates. All symbol curves were calculated using Eq. 12 for the kinetic parameters shown in Table III
The decomposition mechanism of folic acid in degradation process of Folnak® sample under nonisothermal conditions can be summarized in the following steps: (a) the first reaction occurs through the breaking of the glutamic acid component from the folic acid structure leaving the amide component as a major constituent (27), and (b) after this step, we may expect that the pterin and p-amino benzoic acid decomposes in probably overlapping mechanism, which can be detected as the widening of the third endothermic peak in the DTA curve of the Folnak® degradation (Fig. 3), which is followed by the appearance of the visible shoulder at about 220–235°C, including all heating rates. Accordingly, the decomposition mechanism of the folic acid in degradation process of Folnak® sample cannot be explained by the simple reaction order model (n = 1) but with the complex reaction mechanism, which includes the higher reaction orders (n > 1), with average value of <n > = 1.91 (Table III).
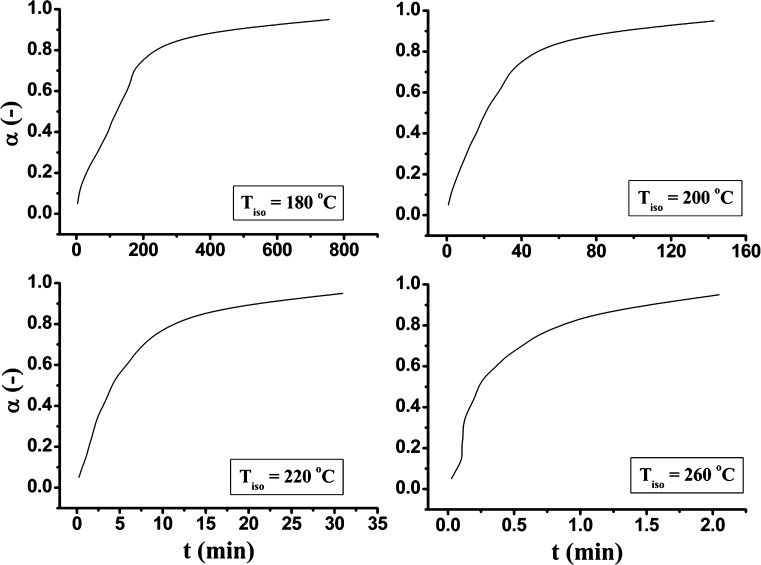
The isothermal predictions of the third degradation stage of Folnak® sample, at four different temperatures (Tiso = 180°C, 200°C, 220°C, and 260°C) using the kinetic parameters evaluated for β = 10°C min−1, are presented in Fig. 9.
Fig. 9.
Predictions of the isothermal decomposition kinetics of the folic acid under the Folnak® degradation process at the different temperatures, T iso = 180°C, 200°C, 220°C, and 260°C, using the kinetic parameters evaluated for β = 10°C min−1
The shapes of the isothermal conversion curves at lower temperatures (180–200°C) were similar, whereas became more complex (the α(t) curve at 220°C begins to deviate at lower values of α) with further temperature increase due to complex behavior of folic acid decomposition, especially after 220°C, where we can expect the pterin and p-amino benzoic acid decomposition processes, which probably proceed through the overlapping mechanism, that brings the additional complexity in the overall folic acid decomposition process.
CONCLUSIONS
Thermal stability and nonisothermal kinetics of Folnak® degradation process were investigated by TG-DTG-DTA techniques in the temperature range from an ambient one up to 810°C. It was concluded that the degradation of Folnak® powder sample proceeds through the five stages (designated as stage I, II, III, IV, and V). These stages include the following: the dehydration (I), melting process of excipients (II), decomposition processes of folic acid (III), corn starch (IV), and saccharose (sucrose; V), respectively. In the case of Folnak® degradation, all excipients increase their thermal stability, and some kind of solid–solid and/or solid–gas interaction was presented in the investigated system.
The apparent activation energy of the folic acid decomposition under Folnak® degradation process was calculated by the Kissinger–Akahira–Sunose (KAS) and Ozawa methods. The results show that the apparent activation energy is not constant throughout the considered decomposition process, but in the conversion range of 0.30 ≤ α ≤ 0.80, the apparent activation energy changes slightly, which the average value is 152.3 kJ mol−1, calculated by KAS method. By applying the two special functions (y(α) and z(α) functions), the kinetic model for the third degradation stage of Folnak® sample was determined. It was concluded that the reaction order kinetic model (ROn with n > 1) represents the most probable kinetic model for the description of the third degradation stage of Folnak® sample. Using the nonlinear regression method, the kinetic parameters (n and A) for the third degradation stage of Folnak® sample were determined. The decomposition mechanism of folic acid in Folnak® degradation under nonisothermal conditions can be summarized in the following steps: (1) the first step occurs through the breaking of the glutamic acid component from the folic acid structure leaving the amide as a major constituent, and (2) the second step starts with pterin and p-amino benzoic acid decomposition which probably proceeds through the overlapping mechanism.
The isothermal predictions of the third degradation stage of Folnak® sample, at four different temperatures (Tiso = 180°C, 200°C, 220°C, and 260°C) were presented in this paper. It was concluded that the shapes of the isothermal conversion curves at lower temperatures (180–200°C) were similar, whereas became more complex with further temperature increase due to complex behavior of folic acid decomposition, especially after 220°C, where we can expect the pterin and p-amino benzoic acid decompositions, which probably proceed through the overlapping mechanism. The isothermal predictions are in good correlation with nonisothermal TG-DTA measurements.
Acknowledgment
This study was partially supported by the Ministry of Science and Development of Serbia under Project 142025.
References
- 1.Hoffbrand AV, Weir DG. The History of folic acid. Br J Haematol. 2001;113:579–589. doi: 10.1046/j.1365-2141.2001.02822.x. [DOI] [PubMed] [Google Scholar]
- 2.Ebisch IMW, Thomas CMG, Peters WHM, Braat DDM, Steegers-Theunissen RPM. The importance of folate, zinc and antioxidants in the pathogenesis and prevention of subfertility. Hum Reprod Updat. 2007;13:163–174. doi: 10.1093/humupd/dml054. [DOI] [PubMed] [Google Scholar]
- 3.Samuel CE, Rabinowitz JC. Initiation of protein synthesis by folate-sufficient and folate-deficient streptococcus faecalis R. J Biol Chem. 1974;249:1198–1206. [PubMed] [Google Scholar]
- 4.Helms RA, Herfindal ET, Quan DJ, Gourley DR. Textbook of therapeutics: drug and disease management. 8. Philadelphia: Lippincott Williams & Wilkins, Wolters Kluwer Health; 2006. pp. 75–95. [Google Scholar]
- 5.Gomber S, Kela K, Dhingra N. Clinico-hematological profile of megaloblastic anemia. Ind Pediatr. 1998;35:55–58. [PubMed] [Google Scholar]
- 6.Gomber S, Dewan P, Dua T. Homocystinuria: a rare cause of megaloblastic anemia. Ind Pediatr. 2004;41:941–943. [PubMed] [Google Scholar]
- 7.Ford JL, Timmins P. Pharmaceutical thermal analysis, techniques and applications. Chichester: Ellis Horwood; 1989. pp. 20–30. [Google Scholar]
- 8.Tņnesen HH, Moore DE. Photochemical stability of biologically active compounds. III. Mefloquine as a photosensitizer. Int J Pharm. 1991;70:95–101. doi: 10.1016/0378-5173(91)90168-N. [DOI] [Google Scholar]
- 9.Brown ME, Dollimore D, Galwey AK. Reactions in the solid state. In: Bamford CH, Tipper CFH, editors. Comprehensive chemical kinetics. Amsterdam: Elsevier; 1980. pp. 22–23. [Google Scholar]
- 10.Senum GI, Yang RT. Rational approximations of the integral of the Arrhenius equation. J Therm Anal Calorim. 1977;11:445–447. doi: 10.1007/BF01903696. [DOI] [Google Scholar]
- 11.Vyazovkin S, Wight CA. Model-free and model-fitting approaches to kinetic analysis of isothermal and nonisothermal data. Thermochim Acta. 1999;340–341:53–68. doi: 10.1016/S0040-6031(99)00253-1. [DOI] [Google Scholar]
- 12.Khawam A, Flanagan DR. Basics and applications of solid-state kinetics: a pharmaceutical perspective. J Pharm Sci. 2006;95:472–498. doi: 10.1002/jps.20559. [DOI] [PubMed] [Google Scholar]
- 13.Kissinger HE. Reaction kinetics in differential thermal analysis. Anal Chem. 1957;29:1702–1706. doi: 10.1021/ac60131a045. [DOI] [Google Scholar]
- 14.Akahira T, Sunose T. Joint convention of four electrical institutes. Research report (Chiba Institute of Technology) Sci Technol. 1971;16:22–31. [Google Scholar]
- 15.Coats AW, Redfern JP. Kinetic parameters from thermogravimetric data. Nature. 1964;201:68–69. doi: 10.1038/201068a0. [DOI] [Google Scholar]
- 16.Doyle CD. Estimating isothermal life from thermogravimetric data. J Appl Polym Sci. 1962;6:639–642. doi: 10.1002/app.1962.070062406. [DOI] [Google Scholar]
- 17.Ozawa T. A new method of analyzing thermogravimetric data. Bull Chem Soc Jpn. 1965;38:1881–1886. doi: 10.1246/bcsj.38.1881. [DOI] [Google Scholar]
- 18.Málek J. The kinetic analysis of non-isothermal data. Thermochim Acta. 1992;200:257–269. doi: 10.1016/0040-6031(92)85118-F. [DOI] [Google Scholar]
- 19.Málek J. A computer program for kinetic analysis of non-isothermal thermoanalytical data. Thermochim Acta. 1989;138:337–346. doi: 10.1016/0040-6031(89)87270-3. [DOI] [Google Scholar]
- 20.Liu X, Yu L, Liu H, Chen L, Li L. In situ thermal decomposition of starch with constant moisture in a sealed system. Polym Degrad Stab. 2008;93:260–262. doi: 10.1016/j.polymdegradstab.2007.09.004. [DOI] [Google Scholar]
- 21.Beninca C, Demiate IM, Lacerda LG, Carvalho Filho MAS, Ionashiro M, Schnitzler E. Thermal behavior of corn starch granules modified by acid treatment at 30 and 50°C. Ecl Quím, São Paulo. 2008;33:13–18. [Google Scholar]
- 22.Suñol JJ, Farjas J, Berlanga R, Saurina J. Thermal analysis of a polyethylene glycol (PEG 4000): T-CR-T diagram construction. J Therm Anal Calorim. 2000;61:711–718. doi: 10.1023/A:1010120424573. [DOI] [Google Scholar]
- 23.Araújo AS, Storpirtis S, Mercuri LP, Carvalho FMS, Santos Filho M, Matos JR. Thermal analysis of the antiretroviral zidovuine (AZT) and evaluation of the compatibility with excipients used in solid dosage forms. Int J Pharm. 2003;260:303–314. doi: 10.1016/S0378-5173(03)00288-6. [DOI] [PubMed] [Google Scholar]
- 24.Mura P, Faucci MT, Manderioli A, Bramanti G, Ceccarelli L. Compatibility study between ibuproxam and pharmaceutical excipients using differential scanning calorimetry, hot-stage microscopy and scanning electron microscopy. J Pharm Biomed Anal. 1998;18:151–163. doi: 10.1016/S0731-7085(98)00171-X. [DOI] [PubMed] [Google Scholar]
- 25.Jaw K-S, Hsu C-K, Lee J-S. The thermal decomposition behaviors of stearic acid, paraffin wax and polyvinyl butyral. Thermochim Acta. 2001;367–368:165–168. doi: 10.1016/S0040-6031(00)00680-8. [DOI] [Google Scholar]
- 26.Bartsch SE, Griesser UJ. Physicochemical properties of the binary system glibenclamide and polyethylene glycol 4000. J Therm Anal Calorim. 2004;77:555–569. doi: 10.1023/B:JTAN.0000038994.07044.8c. [DOI] [Google Scholar]
- 27.Vora A, Riga A, Dollimore D, Alexander KS. Thermal stability of folic acid. Thermochim Acta. 2002;392–393:209–220. doi: 10.1016/S0040-6031(02)00103-X. [DOI] [Google Scholar]
- 28.Orozco VH, Brostow W, Chonkaew W, López BL. Preparation and characterization of poly(lactic acid)-g-maleic anhydride + starch blends. Macromol Symp. 2009;277:69–80. doi: 10.1002/masy.200950309. [DOI] [Google Scholar]
- 29.Zhang X, Golding J, Burgar I. Proceedings of the 7th world conference on biodegradable polymers & plastics. Pisa, Italy, June 4–8, 2002. pp 131–132.
- 30.Aggarwal P, Dollimore D, Heon K. Comparative thermal analysis study of two biopolymers, starch and cellulose. J Therm Anal Calorim. 1997;50:7–17. doi: 10.1007/BF01979545. [DOI] [Google Scholar]
- 31.Fares MM, El-Faqeeh AS. Thermal and thermoxidative degradations of starch and thermosensitive starch-g-BAM copolymers. J Therm Anal Calorim. 2005;82:161–166. doi: 10.1007/s10973-005-0858-4. [DOI] [Google Scholar]
- 32.Aggarwal P, Dollimore D. The effect of chemical modification on starch studied using thermal analysis. Thermochim Acta. 1998;324:1–8. doi: 10.1016/S0040-6031(98)00517-6. [DOI] [Google Scholar]
- 33.Lerdkanchanaporn S. A thermal analysis study of ibuprofen and starch mixtures using simultaneous TG-DTA. Thermochim Acta. 1999;340–341:131–138. doi: 10.1016/S0040-6031(99)00259-2. [DOI] [Google Scholar]
- 34.Kim DS, Soderquist CZ, Icenhower JP, McGrail BP, Scheele RD, McNamara BK, et al. Tc reductant Chemistry and crucible melting studies with simulated Hanford low-activity waste. Prepared for the U.S. Department of Energy under Contract DE-AC 05-76RL01830, Pacific Northwest National Laboratory operated by Battelle for the United States Department of Energy, Oak Ridge, TN 37831-0062, 2005. pp 44–47.
- 35.Rodante F, Vecchio S, Materazzi S, Vasca E. Kinetic and thermodynamic study of the Na4(UO2)2 (OH)4(C2O4)2 complex. Int J Chem Kinet. 2003;35:661–669. doi: 10.1002/kin.10166. [DOI] [Google Scholar]
- 36.Montserrat S, Málek J, Colomer P. Thermal degradation kinetics of epoxy-anhydride resins: I. Influence of a silica filler. Thermochim Acta. 1998;313:83–95. doi: 10.1016/S0040-6031(97)00482-6. [DOI] [Google Scholar]
- 37.Anderson HL, Kemmler A, Strey R. Comparison of different non-linear evaluation methods in thermal analysis. Thermochim Acta. 1996;271:23–29. doi: 10.1016/0040-6031(95)02599-5. [DOI] [Google Scholar]
- 38.Opfermann J. Kinetic analysis using multivariate non-linear regression. I. Basic concepts. J Therm Anal Calorim. 2000;60:641–658. doi: 10.1023/A:1010167626551. [DOI] [Google Scholar]
- 39.Smyth GK. Nonlinear regression. In: El-Shaarawi AH, Piegorsch WW, editors. Encyclopedia of environmetrics. Chichester: Wiley; 2002. pp. 1405–1411. [Google Scholar]


