Abstract
Drying is one of the standard unit operations in the pharmaceutical industry and it is important to become aware of the circumstances that dominate during the process. The purpose of this study was to test microcapsulated thermochromic pigments as heat indicators in a fluid bed drying process. The indicator powders were manually granulated with α-lactose monohydrate resulting in three particle-size groups. Also, pellets were coated with the indicator powders. The granules and pellets were fluidized in fluid bed dryer to observe the progress of the heat flow in the material and to study the heat indicator properties of the indicator materials. A tristimulus colorimeter was used to measure CIELAB color values. Color indicator for heat detection can be utilized to test if the heat-sensitive API would go through physical changes during the pharmaceutical drying process. Both the prepared granules and pellets can be used as heat indicator in fluid bed drying process. The colored heat indicators give an opportunity to learn new aspects of the process at real time and could be exploded, for example, for scaling-up studies.
Electronic supplementary material
The online version of this article (doi:10.1208/s12249-009-9351-x) contains supplementary material, which is available to authorized users.
Key words: CIELAB, colored heat indicator, fluid bed drying, thermochromatism, tristimulus colorimetry
INTRODUCTION
The temperature is raised in many pharmaceutical processes such as wet granulation, drying, and tableting processes. Increase of the temperature can accelerate hydrolysis and oxidation reactions dramatically (1). In addition, thermal stress that pharmaceutical solids are exposed to during manufacturing can induce various processing-induced phase transitions in bulk drug substances or excipients (2). Because drying is one of the standard unit operations in the pharmaceutical industry, it is important to understand the transitions that may take place upon exposure of pharmaceutical solids to thermal stress. For these reasons, the formulation of heat-sensitive active ingredients is a challenge for the pharmaceutical industry.
Fluid Bed Drying
Fluid bed drying is a common method to dry pharmaceutical materials. The contact between the drying gas (usually air) and the particles is good which leads to fast heat transform and drying (3). The parameters such as the speed and moisture of the inlet air can be optimized during the process.
The material can flow in many different ways during the fluid bed drying. The fluidization type is dependent on the material properties for example its density, triboelectricity, and particle size. There are also challenges in fluid bed drying. The movement of the air and therefore the heat is yet unsolved.
Heat Indicator Materials
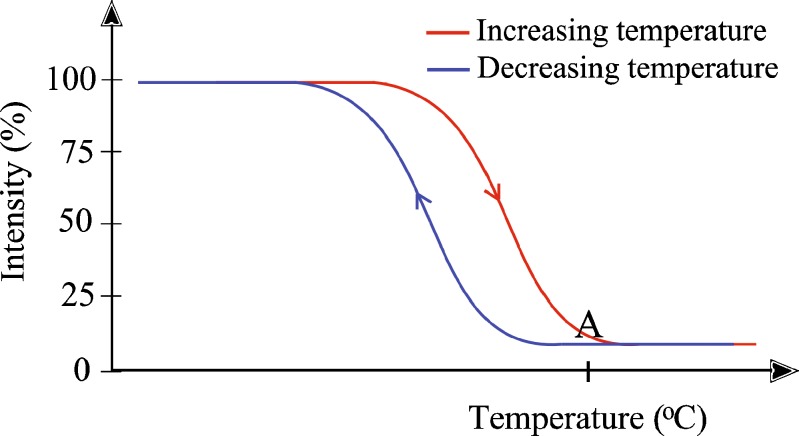
The heat indicator materials are thermochromic which means that they change their color at the specific temperature. The indicators used in this study were ChromaZone® indicators. Indicators are colored until the specific temperature where they change into colorless or light (4). The temperature where the color changes, is called the activation temperature. The color change occurs in the specific temperature interval: it starts ca. 5°C before the activation temperature (Fig. 1). The color change is reversible because the color returns when the temperature is decreased.
Fig. 1.
Schematic figure of thermal hysteresis CZ powders. A is the activation temperature (adapted from Ref. 4)
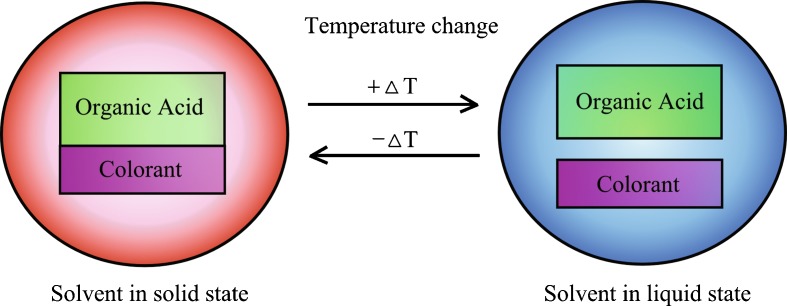
The heat indicator material is colored when the temperature is below the melting point of the solvent (4). At the time, the solvent is in solid phase and the components which form the color (organic acid and colorant) are in touch (Fig. 2). The color can be seen due to the electron interactions. If the temperature is over the melting point of the solvent or the in the liquid phase, the color-forming components are not in touch and the color cannot be seen. The electrons cannot interact.
Fig. 2.
The principle of the thermochromatism. When the solvent is in the solid phase in the microcapsule, the color can be seen. When the solvent is in the liquid phase, the color cannot be seen
ChromaZone® materials have been used for example in labels, packaging, and textile. They can also be used in coatings on plastics, ceramics, or glassware. Thermochromic materials have also been developed, for example, in building and dental industry (5,6). ChromaZone® materials are available as powders, dispersion, and ink with many colors and various activation temperatures.
Thermochromic indicators have not formerly been used as a thermal indicator in pharmaceutical unit processes. However, these kinds of indicators could create new possibilities for visualizing process at real time. The indicator could be mixed into processed mass and the color change of the mass could be observed during the operation. The color change would indicate that the conditions are too hot for the heat-sensitive API. The indicators could be used as the API before actual heat-sensitive materials are processed. The indicators cannot be used in final formulation because their toxicity is not studied.
Color Analysis
The color can be measured quantitatively either by a spectrophotometer or a colorimeter. When measuring subjects with a tristimulus colorimeter, numerical color data is obtained. The tristimulus method measures the light reflected from the object using three sensors filtered to have the same sensitivity as the human eye (7). Tristimulus values are amounts of the three main color stimuli. According to the CIE (Commission Internationale de l'Eclairage, International Commission on Illumination) 1931 standard tristimulus values are called X, Y, and Z values. Tristimulus colorimeter directly measures these tristimulus values and they can be used to calculate values in L*a*b* color space.
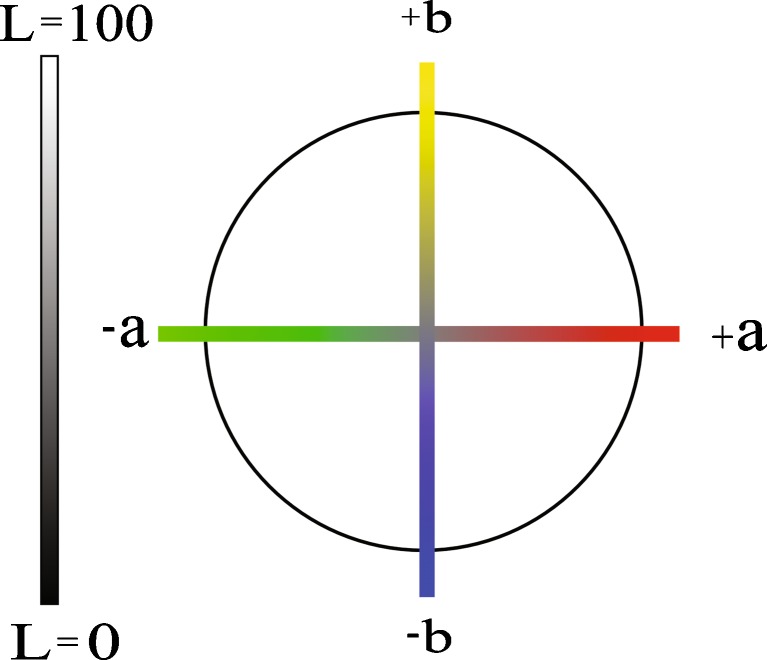
L*a*b* color space is a color-opponent space based on nonlinearly compressed CIE XYZ color space coordinates (CIELAB). The image is divided into three components: L*, a*, and b* (from now on, L, a, b). L component describes the lightness and it is similar to black-and-white images, a component describes color tones from green to red and b component color tones from blue to yellow (Fig. 3). The range for L component is from 0 to 100 and for a and b components usually from −128 to +127.
Fig. 3.
Lab color space. L component describes the lightness and the a and b components the colors from green to red and from blue to yellow, respectively
Some colorimetric studies have been made in the field of pharmaceutical technology. Siddiqui and Nazzal (8) conclude that there is a correlation between the surface color and tensile strength of tablets and color measurement could be in use to detect deviations in tablet hardness. Chan et al. (9) measured color distribution on the film coat using a tristimulus colorimeter. Surface color of tablets has also been studied by Bogdansky (10) with tristimulus colorimeter. Oram and Strine (11) identified key process parameters of a drug using color measurement. Berberich et al. (12) studied the whiteness of uncoated tablets during storage. Also the surface coverage of coarse particles which were coated with colored or uncolored stearic acid has been studied (13).
The heat distribution in the mass could also be monitored using thermography methods such as infrared camera. There have only few studies concerning this method in pharmaceutical field. Bechard et al. (14) and Ketolainen et al. (15) measured heat distribution of tablets during compaction, Johansson et al. (16) studied the laser-induced heating during Raman spectroscopy measurement with infrared imaging and Kelen et al. (17) used thermography for mapping the heat distribution in bulk mass during microwave drying. In other industry fields, thermography has been used to measure heat transfer between fluidized particles in a fluid bed (18). In addition, an interesting article is also published about flow visualization using thermochromic liquid crystal (TLC) thermography (19). TLC:s change their color with increasing temperature. Ochoa et al. coated tissue paper with TLC:s and heated it. The heat flow could be seen as changing color.
The purpose of this study was to create a colored heat indicator and to present a new and practical way to visualize the progress of the heat in the mass during fluidization.
MATERIALS AND METHODS
Materials
The commercial ChromaZone® (CZ, ChromaZone, Flintshire, Great Britain) powders were used as heat indicators. CZ is a microencapsulated thermochromic pigment which changes from colored to colorless as the temperature rises. With decreasing temperature the color returns. The microcapsules are individual droplets of chromogenic material with an impervious polymeric wall. The particle size of the CZ powders is 6 μm. The microcapsule wall can withstand most standard mixing and application procedures (4). In this study, powders which activation temperatures were 31°C (green), 35°C (pink), and 40°C (blue) were used.
Preparation of the Indicator Granules and Pellets
CZ powders were manually granulated with α-lactose monohydrate (lactose 200 M, Pharmatose, DMV International, Veghel, Netherlands). The particle size of the CZ powders was 6 μm and the particle size of lactose was 200 μm. Granulation liquid was 20% polyvinyl pyrrolidone (Kollidon 25, BASF, Ludwigshafen, Germany) water (Ph. Eur.) liquid. Used CZ concentration was 5% (w/w). The moist mass was pushed through 1 mm sieve and the granules were dried 2 h in room temperature. After drying, the granules were sieved first through a 1.0-mm sieve and then the granules which penetrated the 1.0-mm sieve were sieved through a 0.5-mm sieve. The resulting three particle-size groups were small (S; <0.5 mm), medium (M; 0.5 mm–1.0 mm) and large (L; >1.0 mm). In addition, a fourth group was also granulated. It contained 15% (w/w) of CZ31 powder and it was used to study how the indicator content affects on color values. Nomenclature of the granules is presented in the Table I.
Table I.
Nomenclature of the Granule Groups
| Particle size (mm) | CZ31 (5%) | CZ35 (5%) | CZ40 (5%) | CZ31_15 (15%) |
|---|---|---|---|---|
| <0.5 | 31S | 35S | 40S | 31S15 |
| 0.5–1.0 | 31M | 35M | 40M | 31M15 |
| >1.0 | 31L | 35L | 40L | 31L15 |
The value in the brackets describes the amount of CZ powder (w/w)
The pellets (Cellets® 1000, Syntapharm, Mülheim an der Ruhr, Germany) were coated with CZ powders using Caleva top-spray coating equipment (Caleva Mini Coater, Caleva Process Solutions, Dorset, Great Britain). The coating liquid contained 1% (w/w) CZ powder, 5% (w/w) hydroxypropyl methylcellulose (Methocel E5, The Dow Chemical Company, Midland, MI) and purified water (Ph. Eur.). The batch size was 40 g and the average consumption of coating liquid was about 25 mL per coating process. The pellets were fluidized with mechanical vibration and air flow during the coating process. The frequency of the vibration was 17 Hz and amplitude 5 mm. The air flow rate was 4 m/s and the temperature of air was 50°C. Spray pressure was 0.5 bar and the nozzle height was 140 mm. The flow rate of the coating liquid was 35 mL/h. The pellets were coated first for 15 min and then they were dried in the air flow for 10 min without the liquid feed. This procedure was replicated three times.
Moisture Content of the Granules
The moisture content of the granules was measured using moisture analyzer (Sartorius, MA100, Göttingen, Germany). The moisture content was measured because it can affect the color of the granules. A continuous heating was used until 105°C and the measurement ended when the weight lost was decreased to 1 mg/24 s. The moisture content of all particle sizes from all of the CZ groups was determined. The samples were measured after granulation, after being in the desiccator (0% RH) for 24 h and after fluidization. Also, replications were made. The Lab values were measured before and right after the moisture measurement. In addition, the return of the color was observed.
Fluidization
The granules and the coated pellets were fluidized to observe the progress of the heat flow in the material and to study the heat indicator properties of the CZ materials. The used equipment was a multichamber microscale fluid bed device (MMFD; Aricon Oy, Turku, Finland; Fig. 4a). The apparatus involves four individual glass chambers which inlet air rate and temperature can be controlled individually in each chamber. Though, in this study, only one chamber was used at a time (Fig. 4b). The equipment is attached in to process air control unit (Ilmasäätö Oy, Turku, Finland). The control unit is used to control the humidity and the temperature of the inlet air. The automation operation, instrumentation, and process data control are designed according to the user requirements specification (URS) Good Automated Manufacturing Practice, (GAMP, 1996).
Fig. 4.
a Multichamber microscale fluid bed device and its control unit. b Fluid bed chamber and the colorimeter
All of the samples were fluidized with three temperatures and with three inlet air speeds (Table II). Magnesium stearate (0.1% w/w; Ph. Eur.) was added to the small and the middle size granules to prevent their attachment into the chamber walls. With the lowest speed of the inlet air, the particles were not fluidized freely but were practically still. The middle speed was chosen so that the particles were mostly moving but stop every once in the while. The highest speed fluidized the particles efficiently and the mixing was fast and intensive. If the particles were fluidized with even higher air flow rates than the highest used air flow rate, the mixing was so fast that the colorimeter “saw” through the fluidized material. When measuring powders, the Lab values can vary depending on the density of the powder and the surface conditions. To avoid errors, usually a fixed amount of powder is placed into a container of a fixed shape and size and maintaining the surface quality. In fluid bed dryer, the mass was moving continuously. Consequently, only lower air flow rates were used in this study. The temperature was chosen according to the activation temperatures of the CZ materials (Table II). The granules were stored in the desiccators (0% RH) for 24 h before fluidization. The pellets were fluidized according to their activation temperatures but all with the same inlet air speeds because their particle sizes were similar. The temperature was increased until the Lab value was not changing notably. This ensured that the temperature was steady in the entire mass, not just near the sensor. The color values were measured before the fluidization, various times during the fluidization and after the fluidization during the cooling period with some samples. The batch size during the fluidizations was 5 g. The relative air humidity was between 45 and 55% during the measurements. In this study, the fluid bed drying is an expedient for studying the changes in the color of the indicators, not the target itself.
Table II.
Inlet Air Rates and the Temperatures
| Granules | Inlet air rate (mL/s) | Temperature (°C) |
|---|---|---|
| 31 S | 30, 40, 50 | 29–35 |
| 31 M | 100, 120, 140 | 29–35 |
| 31 L | 180, 200, 240 | 29–35 |
| 35 S | 30, 40, 50 | 32–39 |
| 35 M | 100, 120, 140 | 32–39 |
| 35 L | 180, 200, 240 | 32–39 |
| 40 S | 30, 40, 50 | 36–46 |
| 40 M | 100, 120, 140 | 36–46 |
| 40 L | 180, 200, 240 | 36–46 |
| Pellets | ||
| Pellet31 | 250, 275, 300 | 29–35 |
| Pellet35 | 250, 275, 300 | 32–39 |
| Pellet40 | 250, 275, 300 | 36–46 |
Color Measurement
A Konica-Minolta CR-400 tristimulus colorimeter with 8 mm aperture was used to measure the Lab values. The colorimeter was attached in contact with fluidization chamber (Fig. 4b). The measurement was controlled with the Väritohtori (Mitaten Oy, Kauniainen, Finland) software.
RESULTS
Moisture Content of the Granules
Because the moisture content of the granules affected the depth of the color, the moisture content analysis was performed to make sure that the moisture content would not influence on the color during the color measurements. Samples which were measured after the granulation contained 2–5% (w/w) moisture and they were darker (L value was smaller) than the dryer samples. The average moisture content of 12 samples was 1.6% (w/w; SD 0.6). Samples which were in the desiccator or samples which were fluidized did not have any significant difference in the moisture content. The average moisture contents of 12 samples each were, respectively, 1.0% (SD 0.4) and 0.9% (SD 0.9; w/w). All the granules were stored in the desiccators (0% RH) for 24 h before fluidization to avoid the influence of the moisture on the color of the granules during the fluidization. The storing in the desiccator explains the similarity in the moisture results after being in the desiccator and after fluidization. The moisture contents measured after fluidization were very similar with all of the groups. Different fluidization temperatures did not affect moisture content of the granules. In addition, the particle size did not affect moisture content of the granules. The return of the color after moisture analysis was very fast with CZ40 group (1–2 min) and fast with CZ31 group (2–3 min) but the color for CZ35 group returned much slower (over 5 min). The moisture content was practically the same before and after fluidization so it can be stated that the moisture did not affect on the color of the granules during the fluidization.
Visual Observation of Color Change of Granules
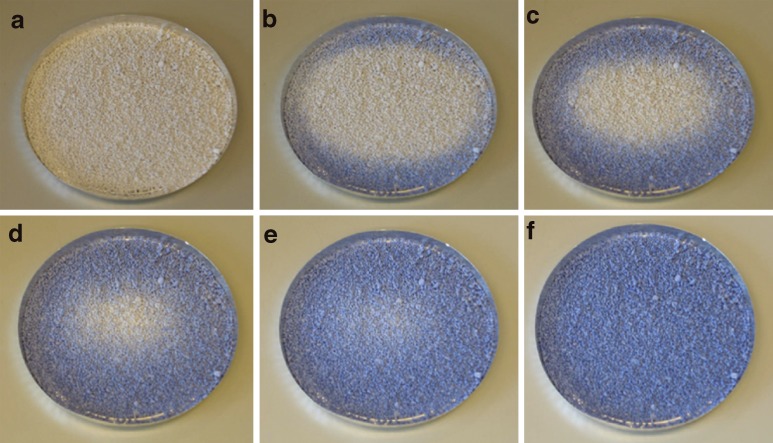
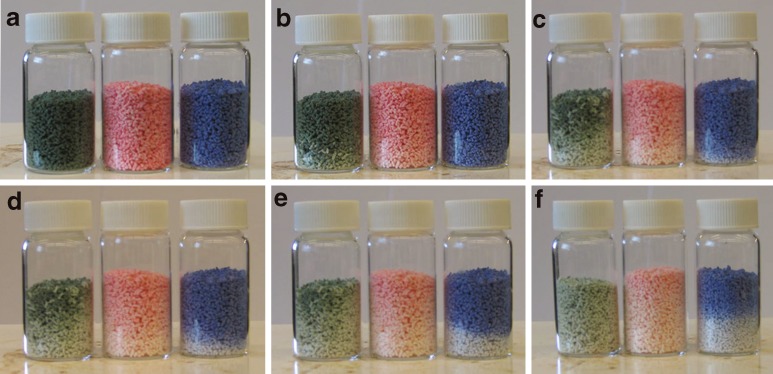
The color change of the granules was studied using hot plate for visual demonstration of the color change. The granules were heated on the hot plate and they were cooled down afterwards. The granules in the group 40L were heated on a metal plate (Fig. 5). The color started to return from the edges where the temperature decreased at first. The return of the color was completed in 2 min. The granules in the groups 31L, 35L, and 40L were heated in glass vessel on a hot plate (Fig. 6). The granules in the group 31L changed their color at first as assumed. Thereafter, the 35L and 40L granules change their color. The color change was clearest with 40L granules; the dividing line between the blue and the white is very distinct.
Fig. 5.
Color change of 40L during cooling down at room temperature. Temperature in a was 50°C at the time point of 0 s. b 60 s. c 75 s. d 90 s. e 105 s. f 120 s
Fig. 6.
The color change of the granules (from the right 31L, 35L, 40L) at the hot plate. Temperature in a was 25°C. b 30°C. c 35°C. d 40°C. e 45°C. f 50°C measured from the bottom plate
The color values were altered depending the particle size of the granules. Smaller particles were lighter than the larger ones. The difference increased when the color tone of the granules was deeper. The difference was largest with CZ31_15 group which contained three times more indicator than the other groups.
Fluidization
The temperature in the chamber was lower than in the spot where the temperature sensor was located. The temperature difference was larger right after the elevation of the temperature but the difference was balanced when the temperature was kept constant for a while. The temperature decreased when going up in the chamber. The change rate of the temperature had an effect on color change of the indicators. If the temperature of the air was increased too fast, temperature in the chamber did not have time to change to the value that the sensor was showing. This could lead to false results if the temperature is altered too fast.
The air flow rate affected the rate of color change. The higher the speed, the faster the color change. When air could flow through the mass, it transferred the heat to the whole mass. If the air flow was increased so that the mass was fluidized, the warm air could interact with all of the particles. This could be also seen as better mixing of the granules. This is the basis behind the fluid bed drying.
The thickness of the fluidized bed had an effect on the heat behavior of the mass. The thicker bed hindered the air flow more efficiently than the thinner bed and that is why also the heat was transferred slower to the upper parts of the bed.
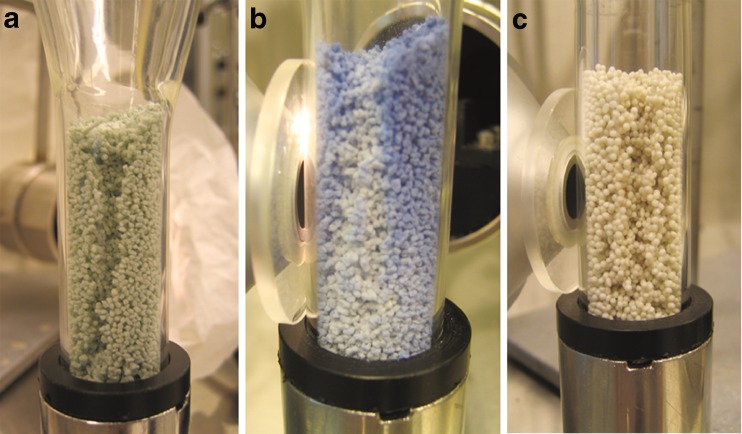
Usually, the edges of the chamber were cooler than the center part. Therefore, the color in the center parts was also lightened faster. The temperature changed at first in the lower parts of the chamber and after that, it raised upwards (Fig. 7b). The particles lighted in the center parts of the mass before the edge parts, if the bed was not moving. It depended on the temperature, how far up the color change occurred.
Fig. 7.
The formation of the caverns. a 31L (temperature 33°C and the air flow 240 mL/s), b 40L (39°C, 180 mL/s) the mass warmed up first at the center parts. c 31 pellets (33°C, 325 mL/s)
The air flow in the chamber was different depending on the fluidized material and fluidization parameters. Different fluidization manners could be perceived. When the air flow was increased so that the mass started to move, a “crater flow” was developed especially with the smaller granules. The typical airflow for an S-sized particle to create crater flow was 100–150 mL/s. In the “crater flow”, the center and lower particles were gushed through the center to the surface. This happened especially when granules were attaching to the chamber walls. A problem occurred when measuring this kind of “crater flow”: the colorimeter measured only those particles next to the chamber walls. The measured results did not reveal the total information because no measurement data was collected from the center parts of the chamber. The particles next to the chamber walls were usually cooler (and darker) than particles in the center especially when the fluidization was not sufficient.
Cavern-type fluidization could be formed in specific air flow speeds (for S-sized particles: 30 mL/s; M, 100–140 mL/s; L, 200–240 mL/s; pellets, 300–325 mL/s). The cavern-type fluidization is presented in Fig. 7. The air flowed through these caverns much easier than through the mass. The caverns formed in the center parts or on the edge parts of the chamber. Different fluidization manners of materials can inflict errors in measurements if they are not recognized when choosing fluidization parameters.
The fluidization properties of the granules with different indicator but same particle size were very similar with each other. The larger (M and L) granules fluidized better than small (S). The fluidization could be adjusted easily with air flow rate. The heat behavior of the granules was better with medium-sized granules than with small and large granules. The mass composing of the small granules were too dense and the air could not move freely through the mass. If the air flow would have been increased, the mass was flowing too hard to study the heat behavior.
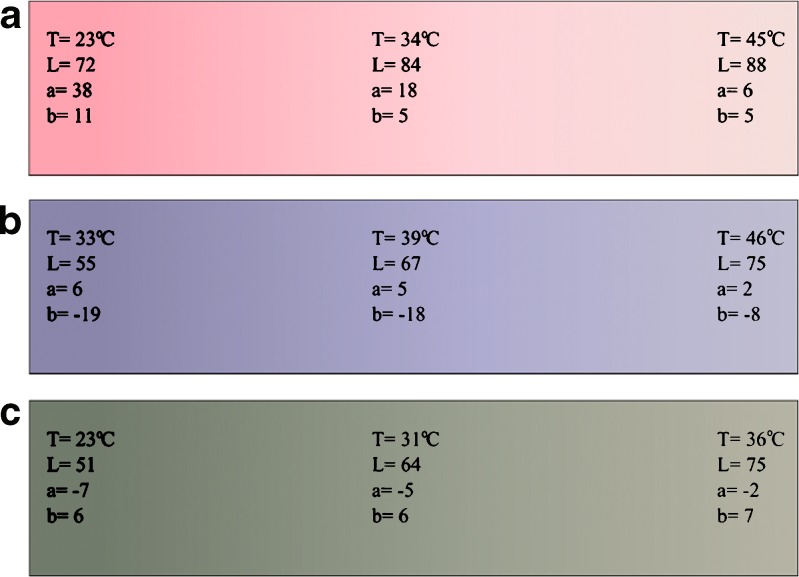
The CZ40 group worked the best during the fluidization. All the particle-size groups changed their color at 40–41°C. A color map that describes the color change during the fluidization was created for 40L batch (Fig. 8b). Also, the CZ31 group served their function (the color change at 32–34°C). The color change of the CZ35 group was not so clear than with the other granules (the color change at 32–33°C). A color map was created for the 35M batch (Fig. 8a). The color of the CZ31 and the CZ40 groups was returned very fast after the fluidization and they color after the fluidization was as bright as before fluidization. However, the color of the granules from CZ35 group did not return totally and the return was slower. The average SD for L values was 0.4, for a values 0.4, and for b values was 0.2. The SD:s were calculated using 20 measurements with day-to-day variation.
Fig. 8.
Color maps made based on the color measurements during the fluidization. a 35M, b 40L, c Pellet31
The pellets needed higher air flow rate than the granules mainly because they are denser. That is why they also kept the heat inside longer than granules and the color return was slower. The pellets were electrified if they were fluidized in high air flow and/or in the high temperature. The triboelectricity inflicts the sticking of the pellets into the chamber walls. A typical behavior for the pellets was that they stuck on each other and did not move in the air flow (Fig. 9c). Even if the air flow was not increased, the pellets could suddenly start to flow better. Often, only the bottom pellets were moving and the higher ones were in place. In that case, only the bottom granules were heated and changed color. Slugging was a common fluidization behavior for pellets especially when using 320 mL/s airflow (Fig. 9b). The color change was observed at 29–31°C for pellet31, at 33°C for pellet35 and at 39–40°C at pellet40. A color map for color change of pellet31 is presented in Fig. 8c.
Fig. 9.
The fluidization behavior of the pellets. a Only the surface of the pellet35 mass is fluidized (33°C, 270 mL/s). b Pellet31 is slugging (31°C, 320 mL/s). c Pellet40 is stuck in the bottom of the straight part of the chamber (38°C, 300 mL/s)
DISCUSSION
Although the equipments for measuring colors are available, the color analysis is rarely employed in the pharmaceutical industry (20). Hayauchi (21) presented reliable and precise equipment for color analysis. It was stated that visual color matching without any color measuring device is very inaccurate and there is wide variability even with the same person and especially between persons. That is why it would be important to measure colors with colorimeters: CIELAB values do not vary.
When using these kinds of color indicators, one must remember that their color change is reversible contrary to physical changes in APIs which are irreversible. This can lead to the fact that some extreme temperatures can be missed if the operator is not accurate and if the chamber is not totally transparent.
The colored heat indicators could be utilized for example with scaling-up research when studying the changes at the heat flow in fluidization chamber. When the scale of the fluidization chamber is increased, the amount of sensor should also be increased. The placement of the sensor should be chosen so that they cover all temperature regions inside the chamber. It would be great development if a sensor could be installed so that they could also see the middle of the fluidized mass. In this case, there probably should be a sensor inside the chamber which would alter the airflow and heat transfer. In addition, it should be remembered that in some cases the sensor can “see” through the fluidized material. This can pose some challenges and has to be considered when attaching the sensors. The most important location is in the lower region where the incoming air is coming into the chamber. It is usually the hottest region where the temperature can change fast and possible physical changes can happen. To reach the best results, a researcher should use bigger scale transparent fluidization chamber with multiple sensors attached to it.
In addition, heat-sensitive color indicators can be used for example for detecting conditions that would alter the crystal structure of active pharmaceutical ingredients or process-induced transformation (PIT). Various APIs can possess multiple polymorphs or amorphous state when conditions (temperature and humidity) are changed. If these conditions are known, indicators which change their color at these specific conditions can be used to visualize in which part of the chamber the changes are happening during fluidization. When studying some specific formulation with heat-sensitive API, the system including excipients should be as close to final formulation as possible.
The colored heat indicators give an opportunity to visualize the process at real time. The visual monitoring of color is natural for humans and it can be very informative. In addition, the quantitative color analysis is possible with colorimeters, also at real time and at line. Finally, at the best case scenario, even process understanding can be gained.
CONCLUSIONS
Color indicator for heat detection can be utilized to mimic the heat-sensitive API in the pharmaceutical drying process. However, when using color indicators, one must remember that their color change is reversible contrary to physical changes in APIs which are irreversible. The indicators are obviously applicable also in other pharmaceutical unit processes. Both the granules and pellets can be used as heat indicator in fluid bed drying process according to this study. Their application should be chosen in a process-specific manner. For instance, the pellets can tolerate water better than the granules. In addition, the flowability and the shape are different with granules and pellets. The concentration and the activation temperature of the indicator must be selected for a specific process.
Electronic supplementary material
Below is the link to the electronic supplementary material.
(WMV 481 kb)
Acknowledgments
Niina Kivikero is acknowledged for advising with fluid bed dryer. Outi Pajunen is thanked for her assistance with the coating equipment. The authors also thank Henri Salokangas for language consulting.
References
- 1.Florence AT, Attwood D. Drug stability. In: Florence AT, Attwood D, editors. Physicochemical principles of pharmacy. 4. Great Britain: Pharmaceutical; 2006. pp. 94–138. [Google Scholar]
- 2.Miroshnyk I, Khriachtchev L, Mirza S, Rantanen J, Heinämäki J, Yliruusi J. Insight into thermally induced phase transformations of erythromycin A dihydrate. Cryst Growth Des. 2006;6(2):369–374. doi: 10.1021/cg050159t. [DOI] [Google Scholar]
- 3.Rankell AS, Lieberman HA, Schiffmann RF. Drying. In: Lachman L, Lieberman HA, Kanig JL, editors. The theory and practice of industrial pharmacy. 3. Philadelphia: Lea and Febiger; 1986. pp. 47–65. [Google Scholar]
- 4.ChromaZone® free flowing powder. http://www.chromazone.co.uk/Powder.htm (Accessed 05/26/09).
- 5.Burgath A, Burtscher P, Salz U, Rheinberger V. Thermochromic dental material. Patent EP1230906 (2002).
- 6.Schroeer J, Jablonka D, Raidt HP, Ruediger L. Building material. Patent WO2007042127 (2007).
- 7.Ohno Y. CIE Fundamentals for color measurements. IS&T NIP 16 Conference, Vancouver; 2000. pp. 16–20.
- 8.Siddiqui A, Nazzal S. Measurement of surface color as an expedient QC method for the detection of deviations in tablet hardness. Int J Pharm. 2007;341:173–180. doi: 10.1016/j.ijpharm.2007.04.006. [DOI] [PubMed] [Google Scholar]
- 9.Chan LW, Chan WY, Heng PWS. Characterization of surface coverage of coarse particles coated with stearic acid. Int J Pharm. 2001;213:63–74. doi: 10.1016/S0378-5173(00)00619-0. [DOI] [PubMed] [Google Scholar]
- 10.Bogdansky FM. Measurement of surface color and color difference of tablet colorants by tristimulus colorimetry. J Pharm Sci. 1975;64(2):323–328. doi: 10.1002/jps.2600640230. [DOI] [PubMed] [Google Scholar]
- 11.Oram PD, Strine J. Color measurement of a solid active pharmaceutical ingredient as an aid to identifying key process parameters. J Pharm Biomed Anal. 2006;40:1021–1024. doi: 10.1016/j.jpba.2005.08.006. [DOI] [PubMed] [Google Scholar]
- 12.Berberich J, Dee K-H, Hayauchi Y, Pörtner C. A new method to determine discoloration kinetics of uncoated white tablets occurring during stability testing—an application of instrumental color measurement in the development pharmaceutics. Int J Pharm. 2002;234:55–66. doi: 10.1016/S0378-5173(01)00947-4. [DOI] [PubMed] [Google Scholar]
- 13.Gren T, Nyström C. Characterization of surface coverage of coarse particles coated with stearic acid. Int J Pharm. 1991;74:49–58. doi: 10.1016/0378-5173(91)90407-F. [DOI] [Google Scholar]
- 14.Bechard SR, Down GRB. Infrared imaging of pharmaceutical materials undergoing compaction. Pahrm Res. 1992;9(4):521–528. doi: 10.1023/A:1015896414765. [DOI] [PubMed] [Google Scholar]
- 15.Ketolainen J, Ilkka J, Paronen P. Temperature changes during tableting measured using infrared thermoviewer. Int J Pharm. 1993;92(1–3):157–166. doi: 10.1016/0378-5173(93)90275-K. [DOI] [Google Scholar]
- 16.Johansson J, Pettersson S, Taylor LS. Infrared imaging of laser-induced heating during Raman spectroscopy of pharmaceutical solids. J Pharm Biomed Anal. 2002;30:1223–1231. doi: 10.1016/S0731-7085(02)00461-2. [DOI] [PubMed] [Google Scholar]
- 17.Kelen Á, Ress S, Nagy T, Pallai E, Pintye-Hódi K. Mapping of temperature distribution in pharmaceutical microwave vacuum drying. Powder Tech. 2006;162:133–137. doi: 10.1016/j.powtec.2005.12.001. [DOI] [Google Scholar]
- 18.Yamada J, Kurosaki Y, Nagai T. Radiation heat transfer between fluidizing particles and a heat transfer surface in a fluidized bed. J Heat Transf. 2001;123:458–465. doi: 10.1115/1.1370503. [DOI] [Google Scholar]
- 19.Ochoa AD, Baughn JW, Byerley AR. A new technique for dynamic heat transfer measurements and flow visualization using liquid crystal thermography. Int J Heat Fluid Flow. 2005;26:264–275. doi: 10.1016/j.ijheatfluidflow.2004.08.002. [DOI] [Google Scholar]
- 20.Šubert J, Čižmárik J. Application of instrumental colour measurement in development and quality control of drugs and pharmaceutical excipients. Pharmazie. 2008;63(5):331–336. [PubMed] [Google Scholar]
- 21.Hayauchi Y. A precise colour determination method for tablets—an application of instrumental color measurement in the pharmaceutical development. Pharmeur Sci Notes. 2005;2005–1:21–262005. [PubMed] [Google Scholar]
Associated Data
This section collects any data citations, data availability statements, or supplementary materials included in this article.
Supplementary Materials
(WMV 481 kb)


