

Abstract
Admixture mapping recently identified MYH9 as a susceptibility gene for idiopathic focal segmental glomerulosclerosis (FSGS), HIV-associated nephropathy (HIVAN) and end-stage kidney disease attributed to hypertension (H-ESKD) in African Americans (AA). MYH9 encodes the heavy chain of non-muscle myosin IIA, a cellular motor involved in motility. A haplotype and its tagging SNPs spanning introns 12–23 were most strongly associated with kidney disease (OR 2–7; P < 10−8, recessive). To narrow the region of association and identify potential causal variation, we performed a dense-mapping study using 79 MYH9 SNPs in AA populations with FSGS, HIVAN and H-ESKD (typed for a subset of 46 SNPs), for a total of 2496 cases and controls. The strongest associations were for correlated SNPs rs5750250, rs2413396 and rs5750248 in introns 13, 14 and 15, a region of 5.6 kb. Rs5750250 showed OR 5.0, 8.0 and 2.8; P = 2 × 10⁻¹⁷, 2 × 10⁻¹⁰ and 3 × 10⁻²², respectively, for FSGS, HIVAN and H-ESKD; OR 5.7; P = 9 × 10⁻²⁷ for combined FSGS and HIVAN, recessive. An independent association was observed for rs11912763 in intron 33. Neither the highly associated SNPs nor the results of resequencing MYH9 in 40 HIVAN or FSGS cases and controls revealed non-synonymous changes that could account for the disease associations. Rs2413396 and one of the highly associated SNPs in intron 23, rs4821480, are predicted splicing motif modifiers. Rs5750250 combined with rs11912763 had receiver operator characteristic (ROC) C statistics of 0.80, 0.73 and 0.65 for HIVAN, FSGS and H-ESKD, respectively, allowing prediction of genetic risk by typing two SNPs.
INTRODUCTION
Chronic kidney disease (CKD) is a major health disparity in the USA, with the risk for end-stage kidney disease (ESKD) 4-fold higher in African Americans (AA) compared with European Americans (EA) (1). The three leading causes of ESKD are diabetic nephropathy, hypertensive kidney disease and glomerulonephritis; African descent individuals are at increased risk for all three. Using admixture mapping, we recently identified MYH9, encoding non-muscle myosin IIA heavy chain, as a main effect gene for idiopathic focal segmental glomerulosclerosis (FSGS) and HIV-associated nephropathy (HIVAN), which manifests as collapsing glomerulopathy, and as a risk predictor for end-stage kidney disease attributed to hypertension (H-ESKD) in the AA population (2). The MYH9 E-1 risk haplotype has attributable risks of 70 and 100%, respectively, for sporadic FSGS and HIVAN, and several MYH9 SNPs have odds ratios (OR) in the 4–7 range (2). The association with MYH9 was identified independently for non-diabetic ESKD in the Family Investigation of Nephropathy and Diabetes (FIND) Study (3). More recently, in a large study of 751 type 2 diabetic ESKD (T2DM-ESKD) cases and 1152 controls, MYH9 SNPs and haplotypes were associated with diabetic ESKD with odds ratios in the 1.2–1.4 range (4). These studies indicate that MYH9 is a renal susceptibility gene for the major forms of kidney disease (5). The most strongly associated MYH9 risk alleles and risk haplotypes are very common (frequency > 60%) in populations of African ancestry, but rare or absent in non-African descent individuals, providing a genetic basis for the excess risk of CKD and ESKD in the African American population and the familial clustering of kidney disease from disparate etiologies observed in African American families (2,6).
A number of correlated MYH9 SNPs, including four tagging SNPs (rs4821480, rs2032487, rs4821481 and rs3752462) spanning introns 12–23 (≈14.9 kb), are highly associated with FSGS and HIVAN. Although the intron 23 SNP, rs4821481, showed the strongest, most consistent SNP association, the African-origin E-1 haplotype (60% in AA and <4% EA) was more strongly associated with kidney disease and more informative than any single SNP (2). The alternative E2 non-risk haplotype (frequency 69% in EA and 20.5% in AA) was strongly associated with reduced risk for FSGS and HIVAN (OR 0.24, 0.12, 10−9 < P < 10−5, respectively) but less so for H-ESKD (0.63, P = 0.05) (2). Many of the associations, including the E-1 haplotype, were significant for the additive and dominant models, but the signals were most robust for the recessive model (2). Freedman et al. (7,8) identified a second region of association with H-ESKD and T2DM-ESKD for the L-1 haplotype tagged by SNPs rs7078, rs12107, rs735853 and rs5756129 at the 3′-end of the gene. These studies securely establish the importance of MYH9 in kidney disease; however, they have not yet revealed causal alleles or sequence variation.
We were motivated to fine map MYH9 with additional tagging SNPs to refine the region of SNP association and localize causal sequence variation. We also sought to determine the most informative SNPs for potential genetic screening and personalized medicine, since the MYH9 risk alleles are both highly frequent and have strong effects for a spectrum of common renal diseases (2,3,7,9). The populations in this study include subjects with biopsy-proven HIVAN with collapsing glomerulopathy and biopsy-proven FSGS as these phenotypes show the strongest MYH9 associations and a larger group of AA with ESKD attributed historically to hypertension (H-ESKD).
RESULTS
The region of interest for the fine-mapping effort included the entire MYH9 gene (Chr 22 coordinates 35007272 to 35113927, 106.5 kb, Build 36.3). The data set includes 17 SNPs from our original study (2), together with 62 additional tagging SNPs for the HIVAN and FSGS case/control groups and a subset of 46 SNPs for the H-ESKD case/control groups (Table 1). All SNP genotypes conformed to Hardy–Weinberg equilibrium (HWE) in the combined FSGS-HIVAN control group, except for rs2413396 whose typing was inaccurate, probably due to the near proximity of the indel rs3842715. We retyped rs2413396 in all groups using an RFLP assay, after which this SNP conformed to HWE in the control groups. This region of rs2413396 and rs3842715 was also resequenced in a subset of subjects and this confirmed the allele assignments by the RFLP assay.
Table 1.
Characteristics of kidney disease cases and controls
| Phenotype | Ancestry | Cases | Age at diagnosis | Controls | Age at enrollment |
|---|---|---|---|---|---|
| Idiopathic FSGS | AA | 188a | 38 ± 14 | 370b | 44 ± 8 |
| HIV-associated nephropathy | AA | 53a | 38 ± 8 | 241c | 44 ± 6 |
| Hypertensive ESKD | AA | 696d | 49 ± 16 | 948e | 50 ± 12 |
| Total | 937 | 1559 |
All cases and control were of African ancestry.
aIdiopathic focal segmental glomerulosclerosis (FSGS) cases and HIV-associated nephropathy (collapsing glomerulopathy) cases were diagnosed on kidney biopsy.
bControls for idiopathic FSGS were normal blood donors from the NCI-Frederick Blood Donor Program and the NIH Clinical Center.
cHIV-associated nephropathy controls were hypernormal controls, who had HIV infection for >8 years and had normal serum creatinine and normal urine protein excretion.
dHypertensive ESKD cases were individuals in the southeastern USA who had a clinical diagnosis but generally did not undergo kidney biopsy; the age of hypertension diagnosis was 35 ± 13 years.
eHypertensive ESKD controls were population (geographic) controls from the southeastern US, 192 of whom had hypertension diagnosed at 44 ± 13 years.
Odds ratios for MYH9 SNPS and for the E-1 haplotype in the FSGS/HIVAN and H-ESKD groups were determined for the recessive and additive models, as reported in earlier studies. The results for the combined FSGS and HIVAN groups are shown in Table 2; these groups were combined because both shared the same disease mechanism (podocyte injury) and have previously shown very similar associations (2). Associations for 40 of the 79 SNPs ranged from 1.3 × 10⁻⁵ ≥ P ≥ 4.4 × 10⁻²⁷, recessive model, before correcting for African ancestry, and were found across the gene. The three strongest associations (5.8 × 10⁻²⁴ ≥ P ≥ 4.4 × 10⁻²⁷, 5.1 ≤ OR ≤ 5.8, recessive model, for combined HIVAN/FSGS) occurred in introns 13 (rs5750250), 14 (rs2413396) and 15 (rs5750248), as shown in Figure 1, Table 2. Supplementary Material, Table S1 shows the associations separately for HIVAN and FSGS, recessive model. Supplementary Material, Table S2 shows MYH9 associations for the additive model for combined HIVAN and FSGS, which are similar in strength. Analysis of H-ESKD cases and controls gave similar results, with numerous associations across the gene; consistent with earlier studies, the odds ratios were smaller, likely due to underlying phenotype heterogeneity (Table 3).
Table 2.
Associations for 80 MYH9 SNPs with biopsy-confirmed HIVAN and FSGS, recessive genetic model, unadjusted for ancestry
| SNP (haplotype) | Physical coordinateb | Myh9 location | Risk allelec | Ref. allele | Risk allele frequencya |
Combined HIVAN/FSGS association |
||||
|---|---|---|---|---|---|---|---|---|---|---|
| Eur. Amer. Donors | HapMap YRI | AA case | AA control | OR | P-value (FET) | |||||
| rs6000268 | 35111626 | Exon 1 | T | CA | 0.00 | 0.18 | 0.16 | 0.15 | 0.9 (0.3–2.7) | 1 |
| rs2272827 | 35111514 | Intron 1 | G | AA | 0.94 | 0.91 | 0.95 | 0.92 | 2 (1.2–3.4) | 0.008 |
| rs9610498 | 35107685 | Intron 1 | GA | A | 0.44 | 0.98 | 0.96 | 0.87 | 3.3 (2–5.7) | 2.8E−07d |
| rs5756168 | 35104758 | Intron 1 | C | TA | 0.10 | 0.11 | 0.12 | 0.08 | 3.9 (0.9–18.9) | 0.03 |
| rs5750254 | 35104395 | Intron 1 | A | A | 0.70 | 0.71 | 0.77 | 0.73 | 1.4 (1–1.9) | 0.06 |
| rs16996724 | 35102720 | Intron 1 | A | G | 0.94 | 0.93 | 0.93 | 0.92 | 1.1 (0.7–1.8) | 0.74 |
| rs1883273 | 35099631 | Intron 1 | G | AA | 0.31 | 0.59 | 0.69 | 0.55 | 2.2 (1.6–3.1) | 9.0E−07 |
| rs6000261 | 35095868 | Intron 1 | A | A | 1.00 | 0.98 | 0.98 | 0.98 | 1.2 (0.5–3.4) | 0.83 |
| rs6000259 | 35094192 | Intron 1 | GA | C | 1.00 | 0.84 | 0.89 | 0.89 | 1 (0.7–1.4) | 0.85 |
| rs16996701 | 35094078 | Intron 1 | G | AA | 1.00 | 0.75 | 0.86 | 0.81 | 1.4 (1–1.9) | 0.08 |
| rs16996698 | 35091282 | Intron 1 | TA | C | 1.00 | 0.99 | 1.00 | 0.99 | 1.6 (0.3–16) | 0.73 |
| rs136213 | 35089761 | Intron 1 | AA | G | 0.31 | 0.45 | 0.60 | 0.44 | 2.5 (1.7–3.5) | 3.0E−07 |
| rs136206 | 35085444 | Intron 1 | A | GA | 0.27 | 0.66 | 0.74 | 0.59 | 2.2 (1.6–3) | 1.2E−06 |
| rs11089788 | 35081047 | Intron 1 | CA | A | 0.49 | 0.58 | 0.59 | 0.57 | 1.2 (0.8–1.6) | 0.37 |
| rs6000254 | 35077529 | Intron 1 | GA | A | 1.00 | 0.98 | 1.00 | 0.98 | 8.8 (1.4–366.2) | 0.008 |
| rs6000251 | 35077352 | Intron 1 | A | CA | 0.00 | 0.06 | 0.15 | 0.10 | 4.7 (1.4–18) | 0.005 |
| rs739097 | 35076025 | Intron 1 | AA | G | 0.62 | 0.61 | 0.71 | 0.67 | 1.3 (0.8–2.2) | 0.21 |
| rs739096 | 35071686 | Intron 2 | GA | C | 0.39 | 0.97 | 0.98 | 0.87 | 6.3 (3.3–13.2) | 2.6E−12 |
| rs11913874 | 35067649 | Intron 2 | CA | G | 0.98 | 0.83 | 0.89 | 0.87 | 1.3 (0.9–1.9) | 0.17 |
| rs8135022 | 35062938 | Intron 3 | TA | G | 0.91 | 0.99 | 1.00 | 0.98 | 5.4 (1.3–47.4) | 0.010 |
| rs5995283 | 35060023 | Intron 3 | TA | C | 1.00 | 0.98 | 1.00 | 0.98 | 4.8 (1.2–42.6) | 0.02 |
| rs6000240 | 35057980 | Intron 3 | T | C | 1.00 | 0.93 | 0.96 | 0.93 | 1.9 (1.1–3.6) | 0.02 |
| rs8143119 | 35057497 | Intron 3 | GA | T | 0.38 | 0.76 | 0.88 | 0.72 | 3.6 (2.5–5.2) | 5.6E−14 |
| rs16996677 (F-1) | 35057229 | Intron 3 | A | GA | 0.00 | 0.36 | 0.47 | 0.27 | 3.9 (2.5–6.1) | 3.6E−10 |
| rs16996674 (F-1) | 35056598 | Intron 3 | T | CA | 0.00 | 0.33 | 0.43 | 0.24 | 4.1 (2.5–6.7) | 4.0E−09 |
| rs5756157 | 35053643 | Intron 3 | T | GA | 0.31 | 0.64 | 0.80 | 0.62 | 3 (2.2-4.2) | 2.1E−12 |
| rs8136336 | 35052480 | Intron 5 | AA | G | 1.00 | 0.94 | 0.98 | 0.97 | 1.7 (0.8–4.4) | 0.22 |
| rs12159211 | 35049109 | Intron 5 | GA | A | 0.96 | 0.98 | 0.99 | 0.97 | 4 (1.4–15.8) | 0.003 |
| rs2071731 | 35048804 | Intron 5 | GA | A | 0.67 | 0.78 | 0.83 | 0.75 | 1.7 (1.1–2.5) | 0.009 |
| rs8138583 | 35047578 | Intron 7 | TA | C | 1.00 | 0.98 | 0.99 | 0.97 | 4.2 (1.3–21.5) | 0.01 |
| rs5995281 | 35045783 | Intron 9 | A | GA | 0.00 | 0.16 | 0.12 | 0.10 | 1.3 (0.2–6.1) | 0.72 |
| rs1005570 | 35045220 | Intron 10 | A | GA | 0.08 | 0.51 | 0.68 | 0.43 | 3.8 (2.7–5.4) | 2.6E−15 |
| rs12167188 | 35044663 | Intron 10 | G | AA | 0.00 | 0.03 | 0.05 | 0.02 | Inf. | 0.28 |
| rs8141189 | 35044656 | Intron 10 | AA | T | 0.00 | 0.36 | 0.44 | 0.27 | 3.8 (2.4–6.1) | 3.2E−09 |
| rs2239784 | 35044581 | Intron 10 | T | CA | 0.06 | 0.71 | 0.79 | 0.58 | 3.2 (2.3–4.4) | 3.1E−13 |
| rs1557539 | 35044035 | Intron 11 | GA | C | 1.00 | 0.98 | 0.98 | 0.97 | 2 (0.9–5.5) | 0.11 |
| rs9610489 | 35043477 | Intron 11 | C | TA | 0.20 | 0.13 | 0.19 | 0.18 | 1.4 (0.6–3) | 0.44 |
| rs1557538 | 35042909 | Intron 11 | A | GA | 0.29 | 0.67 | 0.77 | 0.64 | 2.2 (1.6–3) | 1.1E−06 |
| rs1557536 | 35042756 | Intron 11 | CA | G | 0.29 | 0.73 | 0.81 | 0.68 | 2.2 (1.6–3) | 7.3E−07 |
| rs5756152 | 35042418 | Intron 12 | A | GA | 0.03 | 0.41 | 0.50 | 0.27 | 4.9 (3.1–7.8) | 3.2E−13 |
| rs4821484 | 35040465 | Intron 12 | CA | A | 0.31 | 0.90 | 0.74 | 3.9 (2.7–5.8) | 2.2E−14 | |
| rs3752462 (E-1) | 35040129 | Intron 13 | T | CA | 0.31 | 0.83 | 0.89 | 0.72 | 3.8 (2.7–5.7) | 4.0E−15 |
| rs3830104 | 35038570 | Intron 13 | TA | C | 0.94 | 0.98 | 0.98 | 0.97 | 1.9 (0.8–5.2) | 0.15 |
| rs5750250 (S-1) | 35038429 | Intron 13 | G | AA | 0.04 | 0.68 | 0.82 | 0.52 | 5.7 (4–8) | 9.0E−27 |
| rs2157257 | 35038284 | Intron 13 | AA | G | 0.31 | 0.86 | 0.91 | 0.76 | 3.6 (2.4–5.3) | 1.4E−12 |
| rs7285745e | 35038142 | Exon 14 | GA | A | 1.00 | 0.98 | 0.99 | 0.97 | 2.5 (1–7.3) | 0.04 |
| rs2413396 (S-1)f | 35038030 | Intron 14 | C | TA | 0.08 | 0.71 | 0.82 | 0.54 | 5.8 (4.1–8.2) | 4.4E−27 |
| rs3842715 | 35038003 | Intron 14 | Insg | Del | 0.79 | 0.97 | 0.92 | 2.6 (1.4–5) | 0.0008 | |
| rs2157256 | 35037607 | Intron 14 | A | GA | 0.31 | 0.76 | 0.87 | 0.66 | 4.5 (3.1–6.4) | 1.1E−19 |
| rs1557529 | 35035475 | Intron 14 | A | GA | 0.03 | 0.54 | 0.60 | 0.36 | 4.1 (2.8–5.9) | 5.1E−14 |
| rs2239783 | 35035074 | Intron 15 | CA | T | 0.76 | 0.93 | 0.95 | 0.87 | 2.7 (1.7–4.5) | 9.4E−06 |
| rs5750248 (S-1) | 35032838 | Intron 15 | T | CA | 0.04 | 0.70 | 0.83 | 0.56 | 5.1 (3.6–7.2) | 5.8E−24 |
| rs1009150 | 35032246 | Intron 16 | CA | T | 0.28 | 0.83 | 0.88 | 0.72 | 3.3 (2.3–4.8) | 1.5E−12 |
| rs8137674 | 35032048 | Intron 16 | A | GA | 1.00 | 0.98 | 0.99 | 0.97 | 3.4 (1.2–13.5) | 0.01 |
| rs17806513 | 35030332 | Intron 18 | GA | A | 0.99 | 0.91 | 0.94 | 0.90 | 1.8 (1.1–2.9) | 0.01 |
| rs9619601e | 35030121 | Exon 19 | A | GA | 0.96 | 0.96 | 0.99 | 0.96 | 3.5 (1.4–11.4) | 0.004 |
| rs4821481 (E-1) | 35025888 | Intron 23 | CA | T | 0.04 | 0.76 | 0.86 | 0.63 | 4.5 (3.2–6.5) | 1.3E−20 |
| rs2032487 (E-1) | 35025374 | Intron 23 | CA | T | 0.04 | 0.76 | 0.86 | 0.64 | 4.2 (3–6) | 1.8E−18 |
| rs4821480f (E-1)f | 35025193 | Intron 23 | GA | T | 0.04 | 0.76 | 0.89 | 0.67 | 4.9 (3.4–7.3) | 2.2E−20 |
| rs2187776 | 35025119 | Intron 23 | C | TA | 0.03 | 0.34 | 0.34 | 0.30 | 1.3 (0.7–2.1) | 0.37 |
| rs739101 | 35024279 | Intron 24 | GA | A | 0.30 | 0.86 | 0.91 | 0.76 | 3.5 (2.4–5.2) | 4.9E−12 |
| rs5756133 | 35023926 | Intron 24 | TA | A | 0.32 | 0.93 | 0.95 | 0.84 | 3.7 (2.3–6.1) | 1.7E−09 |
| rs9622373 | 35023618 | Intron 24 | CA | T | 1.00 | 0.97 | 0.98 | 0.94 | 3.9 (1.7–10.1) | 0.0002 |
| rs16996648 | 35022698 | Intron 25 | C | TA | 0.01 | 0.41 | 0.50 | 0.28 | 4.2 (2.7–6.6) | 5.5E−11 |
| rs875725e | 35021637 | Exon 26 | TA | C | 0.99 | 0.91 | 0.95 | 0.92 | 1.9 (1.2–3.3) | 0.009 |
| rs710181e | 35021553 | Exon 26 | A | CA | 0.03 | 0.03 | 0.03 | 0.02 | Inf. | 0.28 |
| rs6000233 | 35017908 | Intron 31 | C | TA | 0.01 | 0.36 | 0.37 | 0.37 | 1 (0.6–1.6) | 0.91 |
| rs1476009 | 35016002 | Intron 31 | GA | A | 0.97 | 0.96 | 0.96 | 0.96 | 1 (0.6–2) | 1 |
| rs11549907 | 35014926 | Exon 33 | G | A | 0.99 | 0.95 | 0.93 | 1.6 (1–2.8) | 0.08 | |
| rs11912763 (F-1) | 35014668 | Intron 33 | A | GA | 0.00 | 0.23 | 0.45 | 0.20 | 7.9 (4.5–14.3) | 3.3E−15 |
| rs2269529h | 35014300 | Exon 34 | A | G | 0.80 | 0.96 | 0.98 | 0.92 | 4.7 (2.2–11.4) | 2.1E−06 |
| rs5756130e | 35014277 | Exon 34 | C | T | 0.98 | 0.87 | 0.94 | 0.88 | 2.1 (1.4–3.4) | 0.0005 |
| rs5756129 (L-1) | 35014038 | Intron 34 | T | C | 0.78 | 0.83 | 0.91 | 0.80 | 2.8 (1.9–4.2) | 4.0E−08 |
| rs2071733 | 35010771 | Intron 38 | GA | C | 0.66 | 0.88 | 0.97 | 0.87 | 4.3 (2.4–8.2) | 1.7E−08 |
| rs2071732 | 35010660 | Intron 38 | CA | T | 0.96 | 0.94 | 0.99 | 0.97 | 3.7 (1.3–14.3) | 0.007 |
| rs735853 (L-1) | 35009161 | Intron 40 | C | G | 0.52 | 0.97 | 0.99 | 0.88 | 12.4 (5.1–39.5) | 1.1E−14 |
| rs735854 | 35009004 | Intron 40 | T | C | 0.33 | 0.93 | 0.94 | 0.79 | 4.9 (3.1–7.9) | 1.3E−15 |
| rs12107 (L-1) | 35007928 | Exon 41 3′-UTR | GA | A | 0.85 | 0.95 | 0.96 | 0.90 | 3.2 (1.8–5.8) | 3.7E−06 |
| rs7078 (L-1) | 35007860 | Exon 41 3′-UTR | TA | C | 0.73 | 0.93 | 0.85 | 2.5 (1.6–4) | 5.2E−06 | |
aAllele frequencies from 221 European American normal blood donors and from the HapMap Yoruba from Nigeria (YRI) (10); bGenome Build 36.3; csuperscript A indicates ancestral allele as indicated in NCBI dbSNP; dbold indicates P< 0.001; eSynonymous change; fSplice motif change (predicted); g-/TCCTGTGA; h1626 Ile > Val.
Figure 1.

Map of MYH9 showing location of exons, and of 80 SNPs, with the strength of association of the SNP (recessive model for the risk allele) with combined FSGS and HIVAN indicated by color. HapMap linkage disequilibrium (D′) for MYH9 is shown.
Table 3.
SNP association with H-ESKD for African American cases (n = 696) and controls (948), recessive model
| SNP | Allele frequency |
Unadjusteda |
Adjusted for Chr 22 ancestryb | Adjusted for Chr 22 ancestry and rs2413396c | ||
|---|---|---|---|---|---|---|
| H-ESKD | Controls | OR | P (FET) | Padj | Padj | |
| rs5995283 | 0.99 | 0.98 | 1.83 | 0.07 | 0.049 | 0.24 |
| rs6000240 | 0.96 | 0.94 | 1.69 | 0.003 | 0.004 | 0.013 |
| rs16996677 (F-1) | 0.37 | 0.27 | 2.33 | 6.3E−07 | 1.6E−06 | 0.013 |
| rs16996674 (F-1) | 0.35 | 0.23 | 2.77 | 2.4E−08 | 8.3E−09 | 0.0028 |
| rs5756157 | 0.73 | 0.62 | 2.01 | 2.0E−11 | 8.1E−08 | 0.003 |
| rs8136336 | 0.98 | 0.97 | 1.49 | 0.11 | 0.11 | 0.06 |
| rs12159211 | 0.98 | 0.97 | 1.46 | 0.17 | 0.22 | 0.90 |
| rs8138583 | 0.98 | 0.98 | 1.45 | 0.19 | 0.12 | 0.67 |
| rs5995281 | 0.12 | 0.09 | 2.89 | 0.03 | 0.06 | 0.08 |
| rs1005570 | 0.56 | 0.44 | 2.17 | 6.9E−11 | 2.2E−07 | 0.005 |
| rs8141189 | 0.37 | 0.27 | 2.54 | 1.4E−07 | 5.6E−06 | 0.0011 |
| rs2239784 | 0.69 | 0.55 | 2.19 | 1.4E−13 | 3.0E−09 | 0.012 |
| rs1557539 | 0.98 | 0.98 | 1.04 | 1 | 0.78 | 0.88 |
| rs9610489 | 0.19 | 0.20 | 0.77 | 0.37 | 0.89 | 0.32 |
| rs1557538 | 0.70 | 0.64 | 1.40 | 0.001 | 0.007 | 0.64 |
| rs1557536 | 0.73 | 0.68 | 1.40 | 0.001 | 0.031 | 0.80 |
| rs5756152 | 0.39 | 0.25 | 3.11 | 1.7E−11 | 4.8E−13 | 1.53E−04 |
| rs3752462 (E-1) | 0.82 | 0.73 | 1.72 | 2.9E−07 | 4.1E−05 | 0.51 |
| rs3830104 | 0.98 | 0.96 | 1.94 | 0.004 | 0.02 | 0.011 |
| rs5750250 (S-1) | 0.68 | 0.50 | 2.76 | 2.8E−21 | 4.0E−14 | 1.92E−05 |
| rs7285745 | 0.98 | 0.97 | 1.48 | 0.10 | 0.08 | 0.64 |
| rs2413396 (S-1) | 0.68 | 0.53 | 2.41 | 9.6E−17 | 4.5E−11 | |
| rs1557529 | 0.49 | 0.34 | 2.54 | 2.1E−12 | 5.0E−11 | 0.0029 |
| rs2239783 | 0.91 | 0.87 | 1.68 | 6.4E−05 | 0.0050 | 0.79 |
| rs8137674 | 0.98 | 0.97 | 1.17 | 0.56 | 0.41 | 0.54 |
| rs9619601 | 0.97 | 0.95 | 1.77 | 0.004 | 0.009 | 0.020 |
| rs4821481 (E-1) | 0.75 | 0.60 | 2.57 | 6.1E−20 | 5.6E−11 | 0.0003 |
| rs2032487 (E-1) | 0.76 | 0.61 | 2.54 | 3.9E−19 | 1.9E−10 | 0.0004 |
| rs4821480 (E-1) | 0.75 | 0.60 | 2.60 | 3.1E−20 | 3.2E−11 | 0.0001 |
| rs2187776 | 0.32 | 0.29 | 1.11 | 0.52 | 0.91 | 0.021 |
| rs5756133 | 0.91 | 0.85 | 1.93 | 1.8E−07 | 8.8E−04 | 0.31 |
| rs9622373 | 0.96 | 0.95 | 1.32 | 0.14 | 0.09 | 0.92 |
| rs16996648 | 0.40 | 0.26 | 3.79 | 5.2E−16 | 7.5E−13 | 7.59E−07 |
| rs875725 | 0.94 | 0.93 | 1.24 | 0.19 | 0.26 | 0.07 |
| rs6000233 | 0.36 | 0.34 | 1.10 | 0.55 | 0.62 | 0.013 |
| rs1476009 | 0.98 | 0.97 | 1.81 | 0.01 | 0.01 | 0.027 |
| rs11549907 | 0.95 | 0.94 | 1.36 | 0.09 | 0.13 | 0.018 |
| rs11912763 (F-1) | 0.34 | 0.19 | 5.65 | 5.1E−18 | 9.5E−16 | 2.62E−08 |
| rs5756130 | 0.90 | 0.87 | 1.46 | 0.003 | 0.009 | 0.88 |
| rs5756129g (L-1) | 0.85 | 0.78 | 1.76 | 3.0E−07 | 5.7E−05 | 0.60 |
| rs2071733 | 0.93 | 0.87 | 2.15 | 1.2E−08 | 3.3E−05 | 0.0018 |
| rs2071732 | 0.98 | 0.96 | 2.17 | 0.001 | 0.004 | 0.005 |
| rs735853g (L-1) | 0.93 | 0.89 | 1.74 | 0.0001 | 0.0104 | 0.60 |
| rs735854 | 0.87 | 0.79 | 1.85 | 6.3E−08 | 1.1E−04 | 0.050 |
| rs12107g (L-1) | 0.93 | 0.88 | 1.82 | 9.2E−06 | 1.2E−04 | 0.021 |
| rs7078g (L-1) | 0.90 | 0.84 | 1.59 | 9.8E−05 | 0.001 | 0.45 |
aSignificant associations P≤ 0.001 are in bold; blogistic regression result adjusted for chr 22 ancestry; clogistic regression result adjusted for chr 22 ancestry and conditioned on rs2413396.
As the association of the MYH9 region with FSGS/HIVAN was identified by admixture mapping, which finds regions with pronounced added ancestry from the ancestral population hypothesized to carry the disease factor, it is essential to establish that the disease association of the factors we report is not simply tracking the increased African ancestry of FSGS/HIVAN cases in this region. We tested this by correcting the association results for estimated MYH9 chromosomal ancestry, limiting subjects to the 410 cases and controls used in the original admixture mapping study for whom this estimate was available (Table 4); the calculated fraction of African ancestry at MYH9 was 93% for cases and 81% for controls, compared with the genome-wide average of 80% for cases and 83% for controls. In this analysis, the most strongly associated SNP, rs2413396, retained a significance of P = 1.5 × 10⁻¹¹, and eight SNPs retained P-values of <10−6. Further, to test the relative contributions of rs2413396 and local chromosomal ancestry at MYH9, we compared χ2 for association of FSGS/HIVAN with MYH9 ancestry, MYH9 SNPs, and SNPs and ancestry combined (10). Supplementary Material, Table S3 compares these measures for the 79 MYH9 SNPs considered; for rs2413396 for the association of the SNP, beyond ancestry alone, showed a P-value of 7 × 10⁻¹³, with P = 2 × 10⁻⁶ for the residual association of ancestry beyond that explained by the SNP alone; SNP rs5750250 had similar associations. We conclude that the majority of the strongest SNP associations is explained by SNP rather than local ancestry association, but that a significant part of the ancestry association remains unexplained by the SNPs. For H-ESKD, we did not have an estimate of local chromosomal ancestry in the MYH9 region available, as the ANCESTRYMAP program requires genome-wide data, not available for these subjects. Hence, for these subjects, we are limited to correcting for average chromosome 22 ancestry; with this correction, the strongest H-ESKD associated SNP, rs5750250, retained a significance of 4 × 10⁻¹⁴, and 13 SNPs retained P-values of <10−6. However, as average chromosome 22 ancestry is a poor proxy for local MYH9 ancestry, it is less certain for H-ESKD that the disease association of the reported SNPs is an effect independent of local African ancestry in the MYH9 region.
Table 4.
Comparison of unadjusted and adjusted associations for 43 MYH9 SNPs (significant unadjusted or adjusted) with biopsy-confirmed HIVAN and FSGS, recessive genetic model
| SNP (haplotype) | FETunadj | Adjusted for MYH9 ancestrya, P-value | Adjusted for MYH9 ancestry and rs2413396b, P-value | Adjusted for Chr 22 ancestry and rs2413396c, P-value |
|---|---|---|---|---|
| rs9610498 | 2.8E−07d | 0.14 | 0.54 | 0.33 |
| rs1883273 | 9.0E−07 | 0.01 | 0.12 | 0.0009 |
| rs136213 | 3.0E−07 | 0.0008 | 0.02 | 0.01 |
| rs136206 | 1.2E−06 | 0.006 | 0.17 | 0.38 |
| rs739096 | 2.6E−12 | 0.006 | 0.11 | 0.03 |
| rs8143119 | 5.6E−14 | 8.5E−07 | 0.01 | 0.04 |
| rs16996677 (F-1) | 3.6E−10 | 0.01 | 0.23 | 0.007 |
| rs16996674 (F-1) | 4.0E−09 | 0.03 | 0.74 | 0.05 |
| rs5756157 | 2.1E−12 | 9.3E−06 | 0.04 | 0.18 |
| rs1005570 | 2.6E−15 | 6.0E−05 | 0.09 | 0.02 |
| rs8141189 | 3.2E−09 | 0.001 | 0.04 | 0.004 |
| rs2239784 | 3.1E−13 | 0.002 | 0.66 | 0.58 |
| rs1557538 | 1.1E−06 | 0.03 | 0.60 | 0.23 |
| rs1557536 | 7.3E−07 | 0.09 | 0.94 | 0.12 |
| rs5756152 | 3.2E−13 | 0.007 | 0.31 | 0.0006 |
| rs4821484 | 2.2E−14 | 1.4E−05 | 0.99 | 0.17 |
| rs3752462 (E-1) | 4.0E−15 | 5.0E−06 | 0.91 | 0.16 |
| rs5750250 (S-1) | 9.0E−27 | 8.2E−11 | 0.75 | 0.85 |
| rs2157257 | 1.4E−12 | 0.0002 | 0.74 | 0.48 |
| rs2413396 (S-1) | 4.4E−27 | 1.5E−11 | – | – |
| rs3842715 | 0.0008 | 0.40 | 0.19 | 0.78 |
| rs2157256 | 1.1E−19 | 1.2E−09 | 0.17 | 0.02 |
| rs1557529 | 5.1E−14 | 0.0002 | 0.28 | 0.14 |
| rs2239783 | 9.4E−06 | 0.06 | 0.22 | 0.15 |
| rs5750248 (S-1) | 5.8E−24 | 2.5E−09 | 0.87 | 0.42 |
| rs1009150 | 1.5E−12 | 0.0003 | 0.11 | 0.20 |
| rs4821481 (E-1) | 1.3E−20 | 3.8E−08 | 0.46 | 0.78 |
| rs2032487 (E-1) | 1.8E−18 | 4.2E−07 | 0.69 | 0.91 |
| rs4821480d (E-1) | 2.2E−20 | 1.8E−07 | 0.10 | 0.35 |
| rs739101 | 4.9E−12 | 0.001 | 0.65 | 0.43 |
| rs5756133 | 1.7E−09 | 0.02 | 0.95 | 0.25 |
| rs9622373 | 0.0002 | 0.002 | 0.13 | 0.32 |
| rs16996648 | 5.5E−11 | 0.001 | 0.12 | 0.01 |
| rs875725 | 0.009 | 0.0006 | 6.4E−05 | 0.007 |
| rs11912763 (F-1) | 3.3E−15 | 0.0002 | 0.02 | 7.5E−05 |
| rs2269529 | 2.1E−06 | 0.03 | 0.25 | 0.02 |
| rs5756130 | 0.0005 | 0.003 | 0.63 | 0.55 |
| rs5756129 (L-1) | 4.0E−08 | 0.0004 | 0.89 | 0.73 |
| rs2071733 | 1.7E−08 | 0.01 | 0.05 | 0.009 |
| rs735853 (L-1) | 1.1E−14 | 0.01 | 0.13 | 0.009 |
| rs735854 | 1.3E−15 | 0.0001 | 0.0002 | 0.0006 |
| rs12107 (L-1) | 3.7E−06 | 0.08 | 0.59 | 0.04 |
| rs7078 (L-1) | 5.2E−06 | 0.04 | 0.83 | 0.08 |
aAnalysis on a subset of 412 FSGS cases (190) and controls (212), corrected for MYH9 chromosomal ancestry; bsubset of 412 FSGS cases (190) and controls adjusted for MYH9 ancestry and rs2413396; cadjusted for Chr 22 ancestry and rs2413396. dBold indicates P< 0.001.
As we had previously observed that the E-1 haplotype association was stronger than any individual SNP association, we extensively tested additional haplotypes derived from fine mapping SNPs for associations. We tested all frequent haplotypes in HapMap haplotype blocks, and all two and three SNP haplotypes, inferred in a moving window across all genotyped MYH9 SNPs (11). We observed no haplotype associations notably stronger than the individual SNP associations. The moving window analysis did reveal a risk haplotype (AGT for SNPs rs2157257, rs5750250 and rs3830104; OR = 6.0, P = 1.2 × 10⁻²⁷ FET for FSGS/HIVAN) and an overlapping protective haplotype (AT for SNPs rs5750250 and rs3830104; OR = 0.17, P = 1.2 × 10⁻²⁷ for FSGS/HIVAN), complementary to the risk haplotype; these haplotypes were in near absolute linkage disequilibrium with the strongest SNPs and marginally more significant. We also tested, in the combined HIVAN/FSGS group, haplotypes with associations reported in other studies of ESKD: L-1, and the F-1 and S-1 haplotypes reported in the companion publication (12) (Table 5). The S-1 and F-1 haplotypes are marginally more strongly associated than the strongest constituent SNPs, while the association for the L-1 haplotype was substantially stronger (P = 1.1 × 10⁻¹⁸ for L-1 versus 1.1 × 10⁻¹⁴ for rs735853).
Table 5.
Haplotype associations with combined HIVAN and FSGS
| Haplotype associations |
Strongest SNP in haplotype |
Haplotype associations independent of E-1a |
Haplotype associations independent of S-1a |
||||||||||||
|---|---|---|---|---|---|---|---|---|---|---|---|---|---|---|---|
| Dominant |
Recessive |
Dominant |
Recessive |
Dominant |
Recessive |
||||||||||
| Haplotypeb | OR | P (FET) | OR | P (FET) | ORc | P (FET) | OR | P-value | OR | P-value | OR | P-value | OR | P-value | |
| E-1 | 4.7 | 8.7E−06 | 5.0 | 4.9E−23 | rs4821481 | 4.5 (rec) | 1.3E−20 | – | – | – | – | 1.2 | 0.81 | 1.3 | 0.48 |
| S-1 | 7.5 | 5.9E−10 | 6.0 | 9.7E−28 | rs2413396 | 5.8 (rec) | 4.4E−27 | 2.7 | 0.09 | 3.9 | 0.0001 | – | – | – | – |
| F-1 | 3.8 | 3.1E−17 | 6.9 | 1.3E−10 | rs11912763 | 3.8 (dom) | 8.4E−17 | 2.2 | 2.4E−05 | 2.2 | 0.03 | 2.0 | 0.0005 | 2.2 | 0.04 |
| L-1 | 8.2 | 3.2E−05 | 4.6 | 1.1E−18 | rs735853 | 12.4 (rec) | 1.1E−14 | 2.8 | 0.20 | 2.4 | 0.0001 | 1.6 | 0.59 | 1.9 | 0.01 |
aHaplotypes considered as dominant and recessive variables together with dominant and recessive variables for E-1 or S-1, in logistic regression.
bSNP alleles defining the haplotypes: E-1: rs4821480 G, rs2032487 C, rs4821481 C, rs3752462 T. S-1: rs5750248 T, rs2413396 C, rs5750250 G. F-1: rs11912763 A, rs16996674 T, rs16996677 A. L-1: rs7078 A, rs12107 G, rs735853 C, rs5756129 T.
cOR and P-value for the model indicated for the OR.
With regard to H-ESKD, an effect independent of the strong association for the E-1 haplotype was previously observed for the L-1 haplotype, carrying SNPs close to the 3′-end of MYH9 (7). We tested in FSGS/HIVAN for an independent effect of SNPs in the 3′-region, and across MYH9, by running a logistic regression with each MYH9 SNP considered as a covariate along with rs2413396 and estimated MYH9 chromosomal ancestry (Table 4). In this analysis, rs875725 in intron 33 had the strongest independent effect (P = 6.4 × 10−05), with three other SNPs in the 3′-region having moderately significant (P < 0.005) associations. The three intron 23 SNPs identified as the strongest factors in the earlier reports showed no significance in this analysis (P < 0.1) (2,3,7). Testing for SNPs independent of MYH9 ancestry, rs2413396 and rs875725, revealed no highly significant effects (P > 0.03). For the four haplotypes (E-1, S-1, L-1 and F-1), we tested separately for effects independent of E-1 and S-1; S-1, L-1 and F-1 showed strong effects independent of E-1. E-1 showed no effect independent of S-1, while F-1 showed a strong, and L-1 a modest independent effect. As we were interested in identifying SNPs useful for genetic testing for propensity to kidney disease in AA and similar populations, for which we sought the strongest empirical association of SNPs with disease, independent of the mechanism of the association, we also performed logistic regressions with each MYH9 SNP considered as a covariate along with rs2413396 and estimated chromosome 22 ancestry, for both FSGS/HIVAN and H-ESKD (Tables 3 and 4). Here SNP rs11912763 was the most strongly associated, P = 7 × 10⁻⁵ for FSGS/HIVAN.
The high odds ratios for the strongest susceptibility factors, for each of the kidney diseases studied, combined with the factors' high frequencies, make these genetic factors strong predictors of kidney disease susceptibility. Figure 2 shows the ROC C statistics for haplotype E-1, rs2413396, rs5750250, and combined genotypes of rs5750250 and rs11912763, for the HIVAN, FSGS and H-ESKD. Rs2413396 and rs5750250 are equivalent, and rs5750250 would be preferred for genetic testing due to the genotyping difficulties of rs2413396. The strongest test uses the combined genotype of rs5750250 and the independent rs11912763; this test has ROC C statistics of 0.80, 0.73 and 0.65 for HIVAN, FSGS and H-ESKD, respectively.
Figure 2.
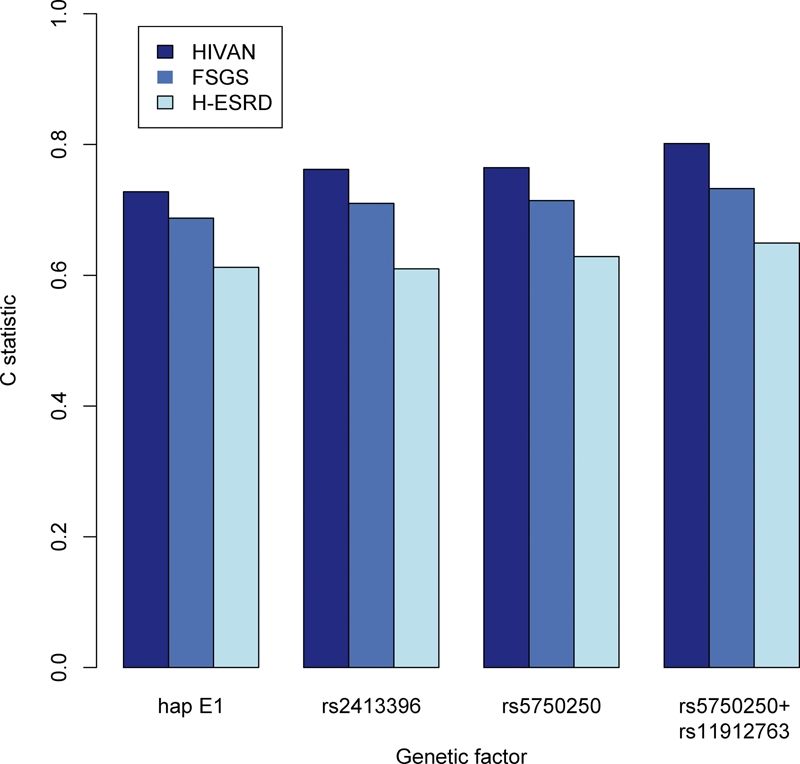
Receiver operating characteristic C statistics of haplotype E-1, SNPs rs2413396 and rs5750250, and combined genotypes of rs5750250 and rs11912763 as predictors of HIVAN, FSGS and H-ESKD. Statistics were calculated by counting the frequency with which, in random draws of cases and controls, the case has a more susceptible genotype than the control. For the E-1 and the SNPs, susceptibility of the genotype was taken to be the number of copies of the risk allele. For combined rs5750250 and rs11912763, susceptibility of the genotype was taken from the following ordering, from least to most susceptible, for rs5750250/rs11912763 genotypes: AA/GG or AA/AG; AG/GG or AG/AG; GG/GG; GG/AG; AG/AA or GG/AA.
We tested all typed MYH9 SNPs between exons 2 and 41, inclusive, along with additional HapMap SNPs in this region for possible effect on splicing with the splice motif prediction program SplicePort (11,13). Cases where motif alteration by a SNP changes predicted splice strengths that would change the likelihood of alternative splicing (substitution of a non-standard donor or acceptor for the standard donor or acceptor, Supplementary Material, Fig. S2) are of interest. Two possible splice changes are of particular interest are associated with notable MYH9 SNPs. First, for the boundary between exon 14 and intron 14, there is an alternate donor site whose use would reduce the size of exon 14 by 93 bp. The risk allele of the most strongly associated variant, rs2413396, decreased the score gap between the common splice site and the alternate by 25%; possibly this decrease could enhance alternative splicing. Although the SPLICEPORT program predicts this to be a weak change, it deserves attention considering the strength of the association of rs2413396. A variation predicted to have a stronger effect on splicing occurs at the boundary between intron 23 and exon 24, associated with rs4821480. An alternate acceptor site has nearly equal strength to that for the site used (0.43 versus 0.44) for the protective allele (T), but for the susceptible allele (G), the alternate site motif has much lower score 0.22. Based on these splice predictions, it is plausible that an alternate splicing could occur for the protective genotype that is abrogated with the susceptible genotype; notably the variant splicing, although in frame, introduces two stop codons and would likely act as a knockout mutation. We are actively investigating the expression of alternate splicing in these regions. Although the suggested splice changes have not been previously reported, the apparently kidney limited phenotype of MYH9 variation associated with FSGS, HIVAN and H-ESKD suggests that alternate splicing or alterations in expression may be specific to podocytes or other kidney cells.
DISCUSSION
In this report, we observed very strong new associations for MYH9 SNPs with idiopathic FSGS, HIVAN and H-ESKD, which underscore the profound effect of variation in this gene on major forms of kidney disease reported previously. The strongest SNP associations are for three SNPs in introns 13, 14 and 15 (P = 4 × 10⁻²⁷ for rs2413396 in intron 14 for combined FSGS, P = 3 × 10⁻²² for rs5750250 in intron 13 for H-ESKD). The multiple associations of SNPs spanning MYH9 are largely due to extensive linkage disequilibrium within and between haplotype blocks; however, this study and others suggest that multiple SNPs within the MYH9 gene predict renal disease (7), (12). We found that independent associations remain, after conditioning on rs2413396 or rs5750250 and controlling for ancestry for SNPs, in introns 1, 12, 33 and exon 40 (encoding the 3′-UTR). An independent association of rs11912763 in intron 33, in the region previously reported in Freedman et al. (7), is notably robust. A companion publication in this volume (12) describes generally similar, and correspondingly highly significant, associations for MYH9 SNPs and haplotypes with hypertensive ESKD in a New York-based Hispanic cohort.
Specific MYH9 non-synonymous mutations have been associated with giant platelet syndromes, including the spectrum of May-Hegglin, Epstein, Fechtner and Sebastian syndromes, which include thrombocytopenia and frequently sensori-neural deafness and/or glomerulonephritis (14). The functional variation in MYH9 responsible for the kidney diseases studied here remains elusive. Two resequencing efforts (data not shown) detected only sporadic coding sequence variation among the set of cases and controls chosen for study, identifying no variation frequent enough to be responsible for the observed effects. Thus, the functional variation is evidently not an amino acid substitution. The fact that the strongest associations are deep inside the gene—the SNPs rs2413396 and rs5750250 are more than 75 Kb from the start of transcription, and separated from it by a recombination hotspot (Fig. 1 and HapMap data) (11)—argues against a promoter variant being responsible. The 3′-end of MYH9 is less distant (∼30 Kb), and strong independent effects are seen close to the 3′-end, thus a 3′ regulatory effect is possible (15). The presence of associations independent of the strongest SNPs and haplotype (S-1) both closer to the 3′-end of MYH9 and spanning S-1 (haplotype F-1) complicates the interpretation of the association. These independent associations could indicate either multiple functional polymorphisms, or a complex pattern of medium-range LD reflecting differing patterns of recombination in ancestral populations carrying the risk variant, or both.
Considering the positional data, a splicing change seems a plausible functional variation. The SNP rs2413396, the strongest recessive association for FSGS, and rs4821480, in the strongest region of association in the earlier report, intron 23, are predicted to modify splice-determining motifs. The risk variant for rs2413396 decreases the predicted strength difference between the known splice site and a possible alternative by 20%; although this is a small predicted effect, it is of interest given the strength of association for this SNP. A much stronger effect is predicted for the intron 23 SNP rs4821480; with the protective alleles of rs4821480, an alternate donor site has equal predicted strength as the standard site for the start of exon 24, whereas with the risk allele the alternate motif is substantially weaker. Thus, the risk allele could plausibly abrogate alternate splicing. Although the possible splice variation is in frame, it contains two stop codons, indicating that it would have a knockout effect, eliminating the last 20 exons. This possible splice change cannot be the single primary functional effect, as rs4821480 is not significant when conditioned on re2413396, but it could contribute to a more complex pattern of splice and possibly expression variation.
Non-muscle myosin II molecular complexes, present in essentially every cell, are cellular motors that contribute to motility, adhesion, intra-cellular trafficking and cytokinesis. The variable presence of glomerulonephritis in the autosomal dominant giant platelet syndromes suggests the important role for these molecules in glomerular function. The glomerular podocyte expresses non-muscle myosin IIA and B in vivo (16) and in vitro (Kopp, unpublished data). Podocytes serve several essential functions: they elaborate matrix proteins of the glomerular basement membrane and their terminal foot processes, with the interdigitating slit diaphragms, determine the stringent permselectivity characteristics of glomerular filtration. Idiopathic FSGS has not been associated with extra-renal manifestations, and while HIVAN is due to systemic disease, there are no extra-renal manifestations that are associated specifically with these kidney diseases. H-ESKD is also likely a primary kidney disease in spectrum of FSGS (focal global glomerulosclerosis), without extrarenal manifestations except for secondarily elevated blood pressures. These observations lead us to seek mechanisms by which the MYH9 variation reported here could exclusively or primarily affect the kidney. One possibility is that MYH9 expression in podocytes is characterized by unique mRNA splicing patterns, which might be affected by the SNPs described here. To date, we have no evidence supporting this hypothesis. An alternative hypothesis is that the special structure and function of podocytes places particular functional demands on the myosin–actin cytoskeleton in maintaining the podocyte foot processes, so that minor changes in MYH9 protein structure, or MYH9 expression affecting the relative frequency of the different myosin heavy chain proteins, become critical.
Although we have not determined the cause of the profound MYH9 effect on kidney disease, the identification of more highly associated SNPs enhances the prospects of simple, highly informative genetic testing. This predictive power may be measured by the ROC C statistic, which gives a joint measure of the sensitivity and specificity of a predictive model. The C statistics for rs5750250 genotypes (rs2413396 has equivalent predictive power but is more difficult to genotype) was 0.76 and 0.71 for HIVAN and FSGS, respectively; the C statistic was lower (0.61) for H-ESKD, probably due to phenotype variation in patients with this clinical diagnosis. Increased predictive power is gained by considering combined genotypes of rs5750250 and rs11912763, which give ROC C statistics of 0.80, 0.73 and 0.65 for HIVAN, FSGS and H-ESKD, respectively. These results would make testing these two SNPs one of the strongest tests for genetic susceptibility to a common disease. In particular, we suggest that it is worth investigating whether, in individuals with HIV disease who have susceptible combined genotypes of rs5750250 and rs11912763, initiation of anti-retroviral therapy prior to the onset of kidney disease or with the appearance of microalbuminuria might reduce the burden of kidney disease among African descent individuals.
MATERIALS AND METHODS
Study participants
We studied three case groups, all self-identified as of African descent and for simplicity described as AA (Table 1). Cases included individuals with biopsy-proven idiopathic FSGS, biopsy-proven HIVAN with collapsing glomerulopathy; and H-ESKD, generally without kidney biopsy. These groups have been previously described (2,7). Idiopathic FSGS and HIVAN cases were enrolled from 22 academic medical centers in the USA as part of the NIH FSGS Genetic Study. Idiopathic FSGS cases were diagnosed according to standard pathologic criteria; cases consistent with post-adaptive FSGS (e.g. associated with obesity, reflux nephropathy and sickle cell nephropathy) and with FSGS due to hypertension, medications or other genetic causes were excluded. HIVAN cases had kidney biopsies that were consistent with collapsing glomerulopathy (also termed the collapsing variant of FSGS) with capillary collapse and podocyte hyperplasia. H-ESKD cases were recruited at the Wake Forest University School of Medicine from North Carolina and neighboring states; cases were defined by hypertension prior to kidney failure with hypertensive target organ damage and low-level proteinuria, when these data were available (≤30 mg/100 ml on urine dipstick, <0.5 g/day protein, or urine protein/creatinine ratio <0.5 g/g). H-ESKD cases did not have diabetes, HIV infection or other known specific etiologies of kidney disease.
Also included were three control groups, all self-identified as of African descent and for simplicity referred to as AA. Controls for the FSGS cases were normal control blood donors lacking a history of kidney disease, recruited at the NIH Clinical Center in Bethesda, MD, and age 44 ± 8 years at enrollment. Controls for HIVAN were enrolled in the AIDS Link to the Intravenous Drug Experience (ALIVE) cohort from Baltimore, MD and HIV-infected for 8 or more years with normal serum creatinine (≤1.4 mg/dl) and lack of proteinuria (urine protein to creatinine ratio < 0.5); this group represents a hypernormal control. Wake Forest controls were recruited from the same geographic region as the H-ESKD cases and denied a personal history of kidney disease and denied a first-degree relative with kidney disease on dialysis or with a kidney allograft, as previously described (7). The average African ancestry for the FSGS/HIVAN study, determined on the representative subset for which genome wide data were available, was 80% for cases and 83% for controls; average African ancestry was 88% for cases and 86% for controls for the ESKD study. There was no overlap of subjects (either H-ESKD cases or controls) between this study and the study described in the companion publication; however, the phenotype definition for H-ESKD between the two studies was nearly identical (12).
Institutional Review Boards at each collaborating medical center approved study protocols and each subject provided written informed consent.
SNP selection and genotyping
The Tagger function in Haploview was used to select 61 SNPs to extend the existing 17 typed SNPs to create a complete tagging set for all SNPs included in the HapMap panel, using YRI data (Table 2, Fig. 1) (11). We chose a tagging panel to capture all HapMap SNPs across MYH9 and with an R2 of at least 0.95, and with an R2 of at least 0.99 for the region spanning intron 12–23, previously shown to be most strongly associated with kidney disease (17). Indel rs3842715 in intron 14 was subsequently added to the SNP panel to resolve associations with rs2413396 as noted below. The H-ESKD cases and Wake Forest controls were genotyped for 46 SNPs (Table 3), a subset of the SNPs typed on the HIVAN and FSGS cases and controls (Table 2). We corrected for local ancestry for HIVAN, FSGS and H-ESKD using 35 diallelic ancestry informative markers (AIMs) (mean delta difference between CEU and YRI 49.6%, range 22–76%) across chromosome 22. For H-ESKD, 70 diallelic ancestry informative markers (AIMS) were used to correct for genome-wide continental ancestry as previously described (7).
MYH9 SNP genotyping was performed by TaqMan (ABI, Foster City, CA, USA) for the idiopathic FSGS and HIVAN cases. MYH9 SNP genotyping for the H-ESKD participants, and AIMs genotyping for all participants, was performed on a Sequenom Mass Array Genotyping System (Sequenom, San Diego, CA, USA). Each SNP was tested for departures from HWE expectations via a chi-square goodness of fit test. Deviations from HWE were observed for SNP rs2413396 in both TaqMan and Sequenom typing, due to faulty genotyping apparently caused by the close proximity of indel rs3842715; therefore, rs2413396 was re-genotyped by a restriction fragment length polymorphism (RFLP) assay for all subjects. The indel rs3842715 was also genotyped by RFLP for the FSGS and HIVAN cases and controls and added to the SNP panel. The allele calling for these two SNPs was confirmed by sequencing.
Statistical analyses
The association between each SNP and FSGS, HIVAN, and H-ESKD, and combined FSGS and HIVAN, was computed for recessive and additive models by Fisher's exact test, using the fisher.test function in R (R Foundation, www.r-project.org). Logistic regression (function glm in R) was used to test for association, adjusting for ancestry, rs2413396 and rs11912763 (for HIVAN/FSGS) or for ancestry and rs5750250 (for H-ESKD). We did not correct for multiple comparisons, as our purpose was to refine well-established associations. However, most of the associations would remain significant with the simple Bonferroni adjustment for 79 SNPs (P-value = 0.0006) tested and many would remain at a highly conservative genome-wide threshold of 1.0 × 10⁻⁸.
The receiver operating characteristic (ROC) C statistic was estimated by counting the frequency with which a case subject carried a more risk-associated genotype than a control subject in 1 000 000 random samplings of case and controls (18). Genotypes in this analysis were grouped so each step of increased risk was statistically significant.
Correction for ancestry
Since African inherited alleles will generally be more common among cases for the kidney disease studied, analyses were run corrected for this confounding effect by including ancestry estimates as covariates, along with the MYH9 SNP and haplotype effects, in logistic regression. Estimates of chromosome 22 admixture proportions were calculated for FSGS/HIVAN with EIGENSTRAT (using the first principal component) using 34 AIMS on chromosome 22, and for H-ESKD with ADMIXMAP using 35 AIMs (19–21). In addition, we tested the subset of FSGS/HIVAN subjects included in the admixture mapping analysis in the Kopp et al., study adjusting for the admixture proportion determined for MYH9 by ANCESTRYMAP, using probability estimates for carrying one or two African chromosomes in MYH9 as separate confounding factors to capture both dominant and recessive effects of ancestry (2,22). ANCESTRYMAP estimates of the probability of an individual carrying two African chromosomes were also used for a test of association limited to these individuals. As ANCESTRYMAP estimates of ancestry at each MYH9 SNP were strongly consistent, indicating no detected recombination in MYH9 between African and European chromosomes, we used the average across SNPs of the probability estimates for carrying one or two African chromosomes.
Haplotype inference
We inferred haplotypes within local haplotype blocks defined by the confidence interval method, and within longer regions of linkage disequilibrium bounded by defined recombination hot spots, and in addition inferred the defined haplotypes E-1, S-1, L-1 and F-1, some of which extend beyond defined blocks (15,23). Haplotypes were inferred by an in-house implementation of the expectation-maximization (EM) algorithm (24).
Splice-site prediction
Three representative haplotypes carrying alternate MYH9 alleles were generated by inserting the alleles in genomic sequence extending from exon 2 to exon 41, inclusive; the haplotypes were the most common YRI haplotypes consistent with protective (two haplotypes) and susceptible (one haplotype) MYH9 haplotypes from our analysis (see Supplementary Material, Figs S1 and S2). We compared splice site predictions from SplicePort (spliceport.cs.umd.edu/) for the three haplotypes, looking for allele-dependent variation in predicted splice motif strength (13).
SUPPLEMENTARY MATERIAL
FUNDING
This project has been funded in whole or in part with federal funds from the National Cancer Institute, National Institutes of Health under contract number N01-CO-12400 and HHSN261200800001E. This research was supported in part by the Intramural Research Program of National Cancer Institute, Center for Cancer Research (Project ZIA BC 010022). Additional funding was provided by the National Institute for Diabetes, Digestive and Kidney Diseases (Project ZO-1 DK043308, to J.B.K.), as well as well as by grants RO1 DK070941 and DK084149 (to B.I.F.). Funding to pay the Open Access publication charges for this article was provided by Project ZIA BC 010022.
Supplementary Material
ACKNOWLEDGEMENTS
The content of this publication does not necessarily reflect the views or policies of the Department of Health and Human Services, not does mention of trade names, commercial products or organizations imply endorsement by the US Government. We gratefully acknowledge the following clinical collaborators: Tejinder Ahuja, Jeffrey S. Berns, William Briggs, Monique E. Cho, Richard A. Dart, Paul L. Kimmel, Stephen M. Korbet, Susan Leitman, Donna M. Michel, Michelle Mokrzycki, Jeffrey R. Schelling, Eric Simon, Howard Trachtman and David Vlahov. We thank Elizabeth Binns-Roemer, Maida Jamba, Bailey D. Kessing and YuChan Zhou for excellent technical support.
Conflict of Interest statement. The NCI, NIH has patent application pending for MYH9 polymorphism and haplotypes for genetic screening and clinical applications; J.B.K., G.W.N., C.A.W. and R.C.J. are co-inventors.
REFERENCES
- 1.Coresh J., Selvin E., Stevens L.A., Manzi J., Kusek J.W., Eggers P., Van Lente F., Levey A.S. Prevalence of chronic kidney disease in the United States. JAMA. 2007;298:2038–2047. doi: 10.1001/jama.298.17.2038. [DOI] [PubMed] [Google Scholar]
- 2.Kopp J.B., Smith M.W., Nelson G.W., Johnson R.C., Freedman B.I., Bowden D.W., Oleksyk T., McKenzie L.M., Kajiyama H., Ahuja T.S., et al. MYH9 is a major-effect risk gene for focal segmental glomerulosclerosis. Nat. Genet. 2008;40:1175–1184. doi: 10.1038/ng.226. [DOI] [PMC free article] [PubMed] [Google Scholar]
- 3.Kao W.H., Klag M.J., Meoni L.A., Reich D., Berthier-Schaad Y., Li M., Coresh J., Patterson N., Tandon A., Powe N.R., et al. MYH9 is associated with nondiabetic end-stage renal disease in African Americans. Nat. Genet. 2008;40:1185–1192. doi: 10.1038/ng.232. [DOI] [PMC free article] [PubMed] [Google Scholar]
- 4.Freedman B.I., Hicks P.J., Bostrom M.A., Comeau M.E., Divers J., Bleyer A.J., Kopp J.B., Winkler C.A., Nelson G.W., Langefeld C.D., et al. Non-muscle myosin heavy chain 9 gene MYH9 associations in African Americans with clinically diagnosed type 2 diabetes mellitus-associated ESRD. Nephrol. Dial. Transplant. 2009;24:3366–3371. doi: 10.1093/ndt/gfp316. [DOI] [PMC free article] [PubMed] [Google Scholar]
- 5.Freedman B.I., Sedor J.R. Hypertension-associated kidney disease: perhaps no more. J. Am. Soc. Nephrol. 2008;19:2047–2051. doi: 10.1681/ASN.2008060621. [DOI] [PubMed] [Google Scholar]
- 6.Satko S.G., Sedor J.R., Iyengar S.K., Freedman B.I. Familial clustering of chronic kidney disease. Semin. Dial. 2007;20:229–236. doi: 10.1111/j.1525-139X.2007.00282.x. [DOI] [PubMed] [Google Scholar]
- 7.Freedman B.I., Hicks P.J., Bostrom M.A., Cunningham M.E., Liu Y., Divers J., Kopp J.B., Winkler C.A., Nelson G.W., Langefeld C.D., et al. Polymorphisms in the non-muscle myosin heavy chain 9 gene (MYH9) are strongly associated with end-stage renal disease historically attributed to hypertension in African Americans. Kidney Int. 2009;75:736–745. doi: 10.1038/ki.2008.701. [DOI] [PMC free article] [PubMed] [Google Scholar]
- 8.Freedman B.I., Bowden D.W., Rich S.S., Xu J., Wagenknecht L.E., Ziegler J., Hicks P.J., Langefeld C.D. Genome-wide linkage scans for renal function and albuminuria in Type 2 diabetes mellitus: the Diabetes Heart Study. Diabet. Med. 2008;25:268–276. doi: 10.1111/j.1464-5491.2007.02361.x. [DOI] [PubMed] [Google Scholar]
- 9.Freedman B.I., Kopp J.B., Winkler C.A., Nelson G.W., Rao D.C., Eckfeldt J.H., Leppert M.F., Hicks P.J., Divers J., Langefeld C.D., et al. Polymorphisms in the nonmuscle myosin heavy chain 9 gene (MYH9) are associated with albuminuria in hypertensive African Americans: The HyperGEN Study. Am. J. Nephrol. 2009;29:626–632. doi: 10.1159/000194791. [DOI] [PMC free article] [PubMed] [Google Scholar]
- 10.Reich D., Nalls M.A., Kao W.H., Akylbekova E.L., Tandon A., Patterson N., Mullikin J., Hsueh W.C., Cheng C.Y., Coresh J., et al. Reduced neutrophil count in people of African descent is due to a regulatory variant in the Duffy antigen receptor for chemokines gene. PLoS Genet. 2009;5:e1000360. doi: 10.1371/journal.pgen.1000360. [DOI] [PMC free article] [PubMed] [Google Scholar]
- 11.Altshuler D., Brooks L.D., Chakravarti A., Collins F.S., Daly M.J., Donnelly P. A haplotype map of the human genome. Nature. 2005;437:1299–1320. doi: 10.1038/nature04226. [DOI] [PMC free article] [PubMed] [Google Scholar]
- 12.Behar D.M., Rosset S., Tzur S., Selig S., Yudkovsky G., Bercovici S., Kopp J.B., Winkler C.A., Nelson G.W., Wasser W.G., et al. African ancestry allelic variation at the MYH9 gene contributes to increased susceptibility to non-diabetic end stage renal disease in Hispanics Americans. Hum. Mol. Genet. 2009 doi: 10.1093/hmg/ddq040. In press. [DOI] [PMC free article] [PubMed] [Google Scholar]
- 13.Dogan R.I., Getoor L., Wilbur W.J., Mount S.M. SplicePort—an interactive splice-site analysis tool. Nucleic Acids Res. 2007;35:W285–W291. doi: 10.1093/nar/gkm407. [DOI] [PMC free article] [PubMed] [Google Scholar]
- 14.Althaus K., Greinacher A. MYH9-related platelet disorders. Semin. Thromb. Hemost. 2009;35:189–203. doi: 10.1055/s-0029-1220327. [DOI] [PubMed] [Google Scholar]
- 15.Frazer K.A., Ballinger D.G., Cox D.R., Hinds D.A., Stuve L.L., Gibbs R.A., Belmont J.W., Boudreau A., Hardenbol P., Leal S.M., et al. A second generation human haplotype map of over 3.1 million SNPs. Nature. 2007;449:851–861. doi: 10.1038/nature06258. [DOI] [PMC free article] [PubMed] [Google Scholar]
- 16.Marini M., Bruschi M., Pecci A., Romagnoli R., Musante L., Candiano G., Ghiggeri G.M., Balduini C., Seri M., Ravazzolo R. Non-muscle myosin heavy chain IIA and IIB interact and co-localize in living cells: relevance for MYH9-related disease. Int. J. Mol. Med. 2006;17:729–736. [PubMed] [Google Scholar]
- 17.Barrett J.C., Fry B., Maller J., Daly M.J. Haploview: analysis and visualization of LD and haplotype maps. Bioinformatics. 2005;21:263–265. doi: 10.1093/bioinformatics/bth457. [DOI] [PubMed] [Google Scholar]
- 18.Hermansen S.W. SAS Global Forum 2008. San Antonio, TX: 2008. [Google Scholar]
- 19.Hoggart C.J., Parra E.J., Shriver M.D., Bonilla C., Kittles R.A., Clayton D.G., McKeigue P.M. Control of confounding of genetic associations in stratified populations. Am. J. Hum. Genet. 2003;72:1492–1504. doi: 10.1086/375613. [DOI] [PMC free article] [PubMed] [Google Scholar]
- 20.Hoggart C.J., Shriver M.D., Kittles R.A., Clayton D.G., McKeigue P.M. Design and analysis of admixture mapping studies. Am. J. Hum. Genet. 2004;74:965–978. doi: 10.1086/420855. [DOI] [PMC free article] [PubMed] [Google Scholar]
- 21.Price A.L., Patterson N.J., Plenge R.M., Weinblatt M.E., Shadick N.A., Reich D. Principal components analysis corrects for stratification in genome-wide association studies. Nat. Genet. 2006;38:904–909. doi: 10.1038/ng1847. [DOI] [PubMed] [Google Scholar]
- 22.Patterson N., Hattangadi N., Lane B., Lohmueller K.E., Hafler D.A., Oksenberg J.R., Hauser S.L., Smith M.W., O'Brien S.J., Altshuler D., et al. Methods for high-density admixture mapping of disease genes. Am. J. Hum. Genet. 2004;74:979–1000. doi: 10.1086/420871. [DOI] [PMC free article] [PubMed] [Google Scholar]
- 23.Gabriel S.B., Schaffner S.F., Nguyen H., Moore J.M., Roy J., Blumenstiel B., Higgins J., DeFelice M., Lochner A., Faggart M., et al. The structure of haplotype blocks in the human genome. Science. 2002;296:2225–2229. doi: 10.1126/science.1069424. [DOI] [PubMed] [Google Scholar]
- 24.Excoffier L., Slatkin M. Maximum-likelihood estimation of molecular haplotype frequencies in a diploid population. Mol. Biol. Evol. 1995;12:921–927. doi: 10.1093/oxfordjournals.molbev.a040269. [DOI] [PubMed] [Google Scholar]
Associated Data
This section collects any data citations, data availability statements, or supplementary materials included in this article.