

Summary
Altered glycosylation and/or expression of dystroglycan have been reported in forms of congenital muscular dystrophy as well as in cancers of the breast, colon, and oral epithelium. To date, however, there has been no study of the expression of dystroglycan in pediatric solid tumors. Using a combination of immunostaining on tissue microarrays and immunoblotting of snap-frozen unfixed tissues, we demonstrate a significant reduction in native α dystroglycan expression in pediatric alveolar rhabdomyosarcoma (RMS), embryonal RMS, neuroblastoma (NBL), and medulloblastoma, whereas expression of β dystroglycan, which is cotranslated with α dystroglycan, is largely unchanged. Loss of native α dystroglycan expression was significantly more pronounced in stage 4 NBL than in pooled samples of stage 1 and stage 2 NBL, suggesting that loss of native α dystroglycan expression increases with advancing tumor stage. Neuroblastoma and RMS samples with reduced expression of native α dystroglycan also showed reduced laminin binding in laminin overlay experiments. Expression of natively glycosylated α dystroglycan was not altered in several other pediatric tumor types when compared with appropriate normal tissue controls. These data provide the first evidence that α dystroglycan glycosylation and laminin binding to α dystroglycan are altered in certain pediatric solid tumors and suggest that aberrant dystroglycan glycosylation may contribute to tumor cell biology in patients with RMS, medulloblastoma, and NBL.
Keywords: Rhabdomyosarcoma, Medulloblastoma, Neuroblastoma, Glycosylation, Metastasis, Laminin
1. Introduction
Interactions of tumor cells with their extracellular environment, the extracellular matrix in particular, are important in determining their growth characteristics and metastatic potential. One important cell adhesion molecule implicated in such interactions is dystroglycan. Dystroglycan was originally characterized as a member of the dystrophin-glycoprotein complex in skeletal muscle [1] but is expressed in many tissues and cell types [2–5]. Dystroglycan is composed of 2 protein subunits, α and β, which are synthesized from the same mRNA and then posttranslationally cleaved from the same polypeptide [1,6]. α dystroglycan is a highly glycosylated extracellular glycoprotein that binds to extracellular matrix components including laminins, agrins, and perlecan [7,8]. α dystroglycan binds tightly, but noncovalently, to β dystroglycan, a transmembrane protein that then links matrix components to filamentous actin via dystrophin or utrophin [9,10]. β dystroglycan, either directly or via proteins associated with dystrophin, can also stimulate several intracellular signal transduction pathways, including those mediated by trimeric G proteins [11], Ras [12], extracellular signal-regulated or mitogen activated protein (ERK-MAP) kinase [13],PI3/Akt kinases [14],Rac [15], and growth factor receptor 2 [16,17]. Thus, dystroglycan serves both structural and signaling roles that can govern cellular adhesion and migration on the extracellular matrix, cell-induced polymerization of extracellular matrix, cell growth, and cellular differentiation [3,18,19].
The ability of α dystroglycan to bind to extracellular matrix proteins requires its proper glycosylation [20]. The middle third of the α dystroglycan polypeptide contains a mucin-like region with 55 potential sites for glycosylation of serine or threonine residues [8]. Within this region, roughly two thirds of the O-linked sites are glycosylated with O-linked mannose structures, whereas the other third receive O-linked GalNAc [21–23]. Although O-linked GalNAc is a very common modification of glycoproteins, α dystroglycan is the only mammalian glycoprotein yet shown to contain O-linked mannose [8]. Of note, genes that regulate O-linked mannosylation and its subsequent glycosylation steps are known to be defective in certain forms of congenital muscular dystrophy (CMD), including Walker-Warburg syndrome and muscle-eye-brain disease [24]. In tissues from such patients, Campbell et al [20] have shown that α dystroglycan glycosylation is reduced, as is laminin binding to α dystroglycan, whereas β dystroglycan glycosylation and expression is unchanged. Thus, it is likely that these O-linked mannosyl structures mediate, or at least modulate, laminin binding to α dystroglycan.
The apparent direct relationship between dystroglycan glycosylation and its ability to bind extracellular matrix proteins begs the question of whether dystroglycan glycosylation and/or expression would be altered in malignant tumor cells and whether such alterations would impact tumor cell behavior [25–27]. Recently, dystroglycan expression was shown to be altered in human primary prostate and breast cancers, with the most prominent changes occurring in high-grade disease [28,29]. Altered dystroglycan expression has also been reported in oral epithelial cancers [30]. In addition, aberrant dystroglycan expression and dystroglycan cleavage have been reported in cell lines representative of adult tumor types including breast and colon [29–33]. Here, we expand such analyses of dystroglycan expression and glycosylation to pediatric solid tumors and demonstrate marked alterations of α dystroglycan in pediatric rhabdomyosarcoma (RMS), neuroblastoma (NBL), and medulloblastoma.
2. Materials and methods
2.1. Immunoblotting
Snap-frozen unfixed tumor and control tissues (listed in Table 1) were obtained from Dr Stephen Qualman (Columbus Children's Hospital, Columbus, OH) and the Cooperative Human Tissue Network (National Cancer Institute, Bethesda, MD). Tumor and control tissue samples were denatured in sodium dodecyl sulfate (SDS)–urea buffer containing 75 mmol/L Tris (pH 6.8), 4% SDS, 4 mol/L urea, 20% glycerol, and 1% β-mercaptoethanol. Samples were diluted, and protein amounts were quantitated in triplicate using the Bio-Rad (Richmond, CA) DC protein assay kit. α dystroglycan was analyzed by separating 40-μg samples of whole cell protein lysate on a 6% SDS–polyacrylamide gel electrophoresis (SDS-PAGE) gel, followed by immunoblotting using VIA4-1 or IIH6. β dystroglycan blots were separated on a 12% SDS-PAGE gel, followed by immunoblotting for β dystroglycan (as in [34]). Blots were stripped and reprobed with anti-actin antibody to control for protein loading and transfer.
Table 1.
Summary of results for dystroglycan expression, glycosylation, and laminin binding in pediatric tumors
| Sample | Location | Age |
Sex | Race | αDG |
βDG |
αDG |
L N (binding) |
|---|---|---|---|---|---|---|---|---|
| (y) | (Expressed) | (Underglycosylated) | ||||||
| 1. RMS (embryonal) | Testicle | 5 | M | C | + | + | + | +/− |
| 2. RMS (metastatic) | Lung | 13 | M | + | + | + | +/− | |
| 3. RMS | L femur | 7 | F | C | + | + | + | − |
| 4. RMS (embryonal) | Abdominal wall | 4 | M | + | + | + | − | |
| 5. RMS (alveolar) | R forearm | 9 | M | + | + | + | +/− | |
| 6. Normal muscle | R quadriceps | 8 | M | + | + | − | + | |
| 7. Normal muscle | R quadriceps | 5 | F | + | + | − | + | |
| 8. Normal muscle | R quadriceps | 8 | M | + | + | − | + | |
| 9. Normal muscle | R quadriceps | 3 | F | + | + | − | + | |
| 10. Normal muscle | R quadriceps | 4 | F | + | + | − | + | |
| 11. Normal muscle | R quadriceps | 5 | F | + | + | − | + | |
| 12. NBL | 1 | M | − | + | +a | − | ||
| 13. NBL | 2 | M | − | + | +a | − | ||
| 14. NBL | 1 | M | − | + | +a | − | ||
| 15. NBL | 1 | M | − | + | +a | − | ||
| 16. NBL | 4 | M | + | + | − | + | ||
| 17. Ganglioneuroma | L thorax | 7 | F | C | − | + | + | + |
| 18. Ganglioneuroma | Adrenal | 16 | F | + | + | + | +/− | |
| 19. Ganglioneuroma | L thorax | 6 | M | + | + | + | +/− | |
| 20. Ganglioglioma | Brain | 16 | F | + | + | − | + | |
| 21. Atypical teratoid/rhabdoid | Brain | 3 | M | +/− | + | − | +/− | |
| 22. Medulloblastoma | Brain | 12 | M | − | − | − | − | |
| 23. Retinoblastoma | Eye | 21 d | F | − | − | − | − | |
| 24. Normal Brain | R gyrus | 6 d | F | + | + | − | + | |
| 25. Normal Brain | Frontal Lobe | 6 d | F | + | + | − | + | |
| 26. Normal Brain | Cerebellum | 6 mo | F | + | + | − | + | |
| 27. Wilms tumor | Kidney | 3 | F | B | + | +/− | − | − |
| 28. Wilms tumor | Kidney | 6 | M | C | + | + | − | + |
| 29. Wilms tumor | Kidney | 3 | F | C | + | + | − | + |
| 30. Wilms tumor | Kidney | 4 | M | + | +/− | + | +/− | |
| 31. Wilms tumor | Kidney | 2 | F | C | + | +/− | + | +/− |
| 32. Normal kidney | Kidney | 3 | F | B | + | + | − | + |
| 33. Normal kidney | Kidney | 3 mo | M | + | + | − | + | |
| 34. Normal kidney | Kidney | 7 | M | + | + | − | + | |
| 35. Osteosarcoma | Bone | 14 | F | + | + | − | + | |
| 36. Osteosarcoma | Bone | 10 | M | + | + | − | + | |
| 37. Osteosarcoma | Bone | 8 | M | + | + | − | + | |
| 38. Ewing's sarcoma | Chest | 9 | F | C | − | + | +a | − |
| 39. Ewing's sarcoma | Bone | 12 | M | C | + | + | − | + |
| 40. Osteosarcoma | Bone | 8 | M | + | + | − | + | |
| 41. Osteosarcoma | Bone | 15 | M | − | − | − | ND | |
| 42. Normal bone | Rib | 2 mo | F | + | + | − | + | |
| 43. Normal bone | Rib | 4 | M | + | + | − | + | |
| 44. Normal bone | Rib | 2 | F | C | + | + | − | + |
| 45. Normal bone | Rib | 6 mo | M | C | + | + | − | ND |
| 46. Yolk sac tumor | Testes | 2 | M | + | + | − | + | |
| 47. Yolk sac tumor | Testes | 6 mo | M | + | + | − | + | |
| 48. Yolk sac tumor | Testes | 12 | M | ++ | + | − | ++ | |
| 49. Normal testes | Testes | 11 | M | + | + | − | + | |
| 50. Normal testes | Testes | 4 mo | M | + | + | − | + | |
| 51. Yolk sac tumor | Kidney | 1 | F | ++ | + | − | ++ | |
| 52. Yolk sac tumor | Ovary | 15 | F | ++ | + | − | ++ | |
| 53. Yolk sac tumor | Ovary | 15 | F | C | ++ | + | − | ++ |
| 54. Yolk sac tumor | Ovary | 2 | F | C | +/− | + | − | +/− |
| 55. Normal ovary | Ovary | 2 | F | C | + | + | − | + |
| 56. Normal ovary | Ovary | 11 | F | C | + | + | − | + |
| 57. Normal ovary | Ovary | 15 | F | + | + | − | + | |
| 58. Hepatoblastoma (embryonal) | Liver | 3 | M | + | + | − | + | |
| 59. Hepatocellular carcinoma | Liver | 10 | M | C | + | + | − | + |
| 60. Hepatocellular carcinoma | Liver | 11 | F | B | + | + | − | + |
| 61. Hepatoblastoma | Liver | 1 | M | C | + | + | − | + |
| 62. Hepatoblastoma | Liver | 1 | M | + | + | − | + | |
| 63. Normal liver | Liver | 1 mo | M | + | + | − | + | |
| 64. Normal liver | Liver | 2 mo | F | + | + | − | + | |
| 65. Normal liver | Liver | 4 | M | + | + | − | + | |
| 66. Hodgkin's lymphoma (NS) | Lung | 15 | M | C | + | + | − | ND |
| 67. Hodgkin's lymphoma | Lymph node | 7 | M | C | ++ | + | − | ++ |
| 68. Hodgkin's lymphoma | Lymph node | 15 | M | + | + | − | + | |
| 69. Hodgkin's lymphoma | Lymph node | 14 | F | + | + | − | + | |
| 70. Hodgkin's lymphoma | Lymph node | 15 | F | − | +/− | − | + | |
| 71. Normal lymph node | Lymph node | 7 | F | + | + | − | + | |
| 72. Normal lymph node | Lymph node | 1 | M | B | + | + | − | + |
| 73. Normal lymph node | Lymph node | 1 | F | + | + | − | + | |
Abbreviations: αDG, α dystroglycan; βDG, β dystroglycan; LN, laminin; ND, not determined; NS, nonsignificant; M, male; F, female; L, left; R, right; B, black; C, caucasian.
Cannot differentiate loss of glycosylation from loss of expression.
2.2. Laminin overlays
Laminin overlays were done using a recombinant FLAG (DYKDDDDK) epitope-tagged protein fragment of the G1-G5 domains of laminin α2, the region responsible for binding to α dystroglycan [35]. Briefly, mRNA was purified from C2C12 myotube cultures and reversed-transcribed as done previously [36], after which the G1-G5 (from nt 2977 to stop codon) fragment was amplified by polymerase chain reaction using oligonucleotides containing BglII and XbaI sites at their 5′ and 3′ ends, respectively. The amplified cDNA fragment was digested with BglII and XbaI and ligated into pCMV1-FLAG at the same sites to create a FLAG epitope–tagged cDNA encoding G1-G5 domains of laminin α2. The integrity of the amplified fragment was confirmed by DNA sequencing. pCMV1FLAG-laminin α2 (G1-G5) was transfected into HEK293T cells (as in Ref. [37]), allowing plasmid replication and production of secreted laminin α2 protein. Epitope-tagged α2 laminin (G1-G5) was purified from the cellular supernatant of transfected cells by addition of anti-FLAG (M2)–conjugated agarose (Sigma, St Louis, MO) overnight at 4°C. Precipitated protein was washed 3 times for 10 minutes each in 10 mL of Tris-buffered saline (TBS; pH 7.4) and eluted in TBS with 0.1 μg/mL 3XFLAG (MDYKDHDGDYKDHDIDYKDDDDK; Sigma) overnight at 4°C. Recombinant laminin was dialyzed against a 30000–molecular weight filter to remove 3XFLAG peptide and analyzed by SDS-PAGE, followed by M2 immunoblotting and laminin immunoblotting to confirm protein integrity. Protein amount was measured as before [37].
Protein samples (40 μg) from tissue lysates were separated on a 6% SDS-PAGE gel and transferred to polyvinylidene difluoride (PVDF) membrane. Membranes were blocked in bovine serum albumin with LBB buffer (10 mmol/L triethanolamine, pH 7.6; 140 mmol/L NaCl, 1 mmol/L MgCl2, and 1 mmol/L CaCl2). Laminin α2(0.1 μg/mL) (G1-G5) was incubated in this buffer overnight at 4°C. Membranes were washed 4 times for 5 minutes each with LBB buffer, followed by incubation with a 1:15,000 dilution of horseradish peroxidase (HRP)–conjugated anti-FLAG antibody (M2) in LBB buffer with 3% bovine serum albumin for 1 hour (Sigma). Membranes were washed again 4 times for 5 minutes in LBB buffer and developed using the enhanced chemiluminescence (ECL) detection method (Amersham; Piscataway, NJ).
2.3. Immunostaining of tissue microarrays
Tissue microarray slides were obtained after review by the Children's Oncology Group from the Biopathology Center at Columbus Children's Research Institute (CCRI). Tissue microarrays consisted of slides containing alveolar RMS (32 unique cases with 5 embryonal RMS and 5 normal muscle controls), embryonal RMS (32 unique cases with 5 alveolar RMS and 5 normal muscle controls), staged NBL (16 cases of stage 1, 16 cases of stage 2, 15 cases of stage 3, 15 cases of stage 4s, and 29 cases of stage 4, with 6 normal tonsil and 6 ganglioneuroma controls) and medulloblastoma (47 unique cases with 11 normal cerebellum controls). Hematoxylin and eosin–stained slides of all tissue arrays were obtained from Dr Stephen Qualman at CCRI. Arrays contained between 1 and 8 duplicate blocks from the represented cases spaced randomly throughout the slide. Antibodies to glycosylated α dystroglycan (VIA4-1 and IIH6 [38]) were obtained from Upstate Biotechnology (Lake Placid, NY) or were a gift from Kevin Campbell (University of Iowa). Purified antipeptide antibody against β dystroglycan was made in the laboratory, as previously described [34], and the 43DAG monoclonal antibody against β dystroglycan was purchased from NovoCastra (Newcastle Upon Tyne, UK). A purified antipeptide polyclonal antibody against α dystroglycan [39] was a gift from Stephan Kroger (University of Mainz). Polyclonal antiserum against laminin 1 was purchased from Sigma. Secondary antibodies goat anti-mouse IgG or IgM or anti-rabbit IgG conjugated to HRP were obtained from Jackson Immunochemicals (Seattle, WA). Recombinant laminin α2 (G1-G5 domains) was produced and purified in the laboratory. A peroxidase staining kit was purchased from Vector Laboratories (Burlingame, CA).
Tissue microarray slides were deparaffinized in xylene, rinsed through 2 changes of 100% ethanol, and rehydrated in graded ethanol (95%–70%) and water. Slides were subjected to antigen retrieval by incubation with 10 mmol/L sodium citrate, pH. 6.0, with 0.05% Tween 20 for 30 minutes at 95°C. Slides were then cooled and washed in phosphate-buffered saline (PBS). Endogenous peroxidase activity was blocked by preincubation with 3% hydrogen peroxide, and slides were blocked by incubation in PBS with 10% goat serum for 1 hour at 25°C. Primary antibody was added overnight, as previously described [40]. Slides were washed in 3 to 4 washes of PBS for 40 minutes and then incubated with HRP-conjugated secondary antibody for 1 hour in PBS with 10% goat serum. Slides were again washed in PBS 4 times for 40 minutes, after which, they were developed for HRP activity using the Vector SG substrate kit. Slides were developed for 15 minutes, then washed in water and mounted in VectaMount media (Vector Laboratories, Burlingame, CA).
The overall intensity of immunohistochemical staining was scored by eye using blinded scoring with respect to case, tumor type, and control tissues using an inverted Zeiss microscope (Thornwood, NY). Intensity was scored as 3, strong staining; 2, moderate or intermittent staining; and 1, no staining above background. Scoring was not automated because some blocks contained normal tissue at the border of the tumor, which would have generated inflated scores for certain samples. Intermittent staining was defined as at least 50% of cells with a score of 1, with the remainder having a score of 2 or 3. On each microarray slide, particular tumors were represented in as many as 8 independent regions. Staining scores for tumors with multiple sections per slide gave very reproducible results for each antibody used. An antibody that recognizes a protein domain in α dystroglycan was also used to stain several tissue array slides. This antibody, which stains but does not blot [39], showed similar staining levels between tumor and nontumor samples, but gave weaker staining than β dystroglycan antibodies (data not shown). β dystroglycan staining, which was much stronger and more reproducible, was therefore used instead for comparison. In all instances, secondary antibody alone gave a score of 1 (or no staining). Specificity of β dystroglycan antibody was also verified by blocking several array slides with the immunogenic peptide, and similar results were obtained when a second independent antibody to the β dystroglycan protein was used (43DAG, NovoCastra).
2.4. Statistics
Comparisons of immunostaining were done using a 2-tailed Student t test. Significance was reported at P < .05 (*), P < .01 (**), or P < .001 (***). Errors shown are SEMs.
3. Results
We analyzed the expression of α and β dystroglycan in 73 snap-frozen pediatric tumor samples and their appropriate pediatric control tissues to determine if expression of native α dystroglycan was reduced (Figs. 1 and 2)(Table 1). Both of the α dystroglycan antibodies used, IIH6 and VIA4-1, require native glycosylation of α dystroglycan to bind. Native glycosylation of α dystroglycan, in turn, is required for extracellular matrix binding to the dystroglycan protein [20,38]. Because α and β dystroglycan are cotranslated from the same mRNA [1], immunoblotting using antibodies to the β dystroglycan polypeptide was used as a means of determining if dystroglycan protein was expressed.
Fig. 1.
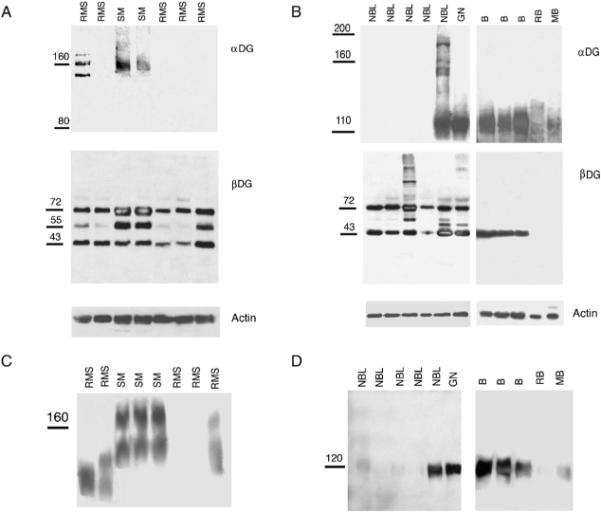
Expression of α and β dystroglycan in RMS, NBL, and brain tumors. A and B, Comparison of natively glycosylated α dystroglycan expression (αDG) and β dystroglycan (βDG) expression in pediatric RMS, normal skeletal muscle (SM), NBL, ganglioneuroma (GN), normal brain (B), retinoblastoma (RB), and medulloblastoma (MB). C and D, Laminin overlay showing reduced laminin binding in RMS, NBL, retinoblastoma, and medulloblastoma.
Fig. 2.
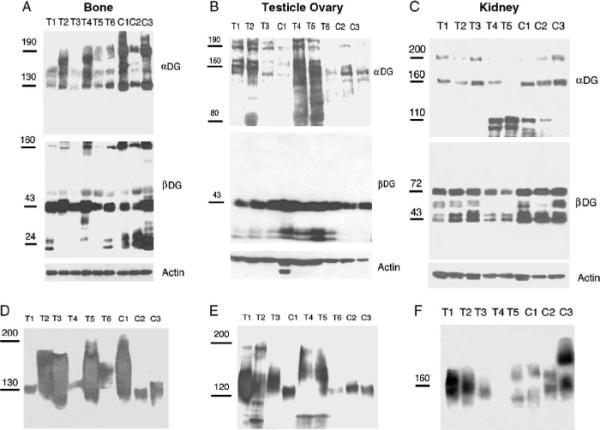
Expression of α and β dystroglycan in bone, yolk sac, and kidney tumors. Comparison of α and β dystroglycan (DG) expression in pediatric bone (A), yolk sac (B), and kidney tumors (C). In A, T1–3 and T6 are osteosarcomas, T4 and T5 are Ewing's sarcomas. In C, all tumors are Wilms tumors. (D–F) Laminin overlays showing laminin binding in pediatric bone (D) and yolk sac (E) and kidney tumors (F) and normal control tissue.
Two groups of tumors stood out as being most affected with regard to a reduction in native α dystroglycan expression. Of 5 RMS samples displayed, 5 had reduced or absent expression of native α dystroglycan (Fig. 1)(Table 1). Extracts from normal skeletal muscles, by contrast, could be immunblotted and recognized an α dystroglycan protein centered on 160 kd, the expected molecular weight in this tissue [1,6]. β dystroglycan was present in all RMS samples, and its molecular weight in the tumor samples was similar to normal muscle controls (Fig. 1, Table 1). Blots were stripped and reprobed for actin as a control for normal protein loading and transfer.
Native cleaved β dystroglycan migrates at 43 kd in skeletal muscle and in other tissues [1,38]. This species was, on average, equivalent between RMS samples and normal skeletal muscle (Fig. 1). In all RMS and normal muscle samples, a 72-kd protein was also present in β dystroglycan immunoblots, as was a 55-kd fragment in control muscle. These fragments likely represent uncleaved αβ dystroglycan polypeptides that are made intracellularly in the endoplasmic reticulum before its cleavage and subsequent glycosylation [41]. Such fragments would not be expected to be identified by the glycosylation-dependent α dystroglycan antibodies used here. We found no evidence of an enrichment in the 31-kd cleaved β dystroglycan fragment reported in a variety of adult tumors and tumor cell lines [29–33].
Neuroblastoma samples also showed a dramatic change in α dystroglycan expression (Fig. 1, Table 1). Of 5 NBL samples, 4 had reduced or absent immunoblotting for α dystroglycan, as compared with control ganglioneuroma or normal brain. Native α dystroglycan migrates as a 120-kd species in both brain and peripheral nerve (as opposed to 160 kd in skeletal muscle). This difference in molecular weight between brain and skeletal muscle has been reported by many investigators (for review, see Ref. [8]); however, the basis for the difference in glycosylation between tissues is not known. Immunoblots from ganglioneuroma and from normal brain all also showed α dystroglycan expression of the expected 120-kd molecular weight. Expression of β dystroglycan was present in all NBL samples at roughly equivalent levels, again suggesting a α dystroglycan–specific change in glycosylation and/or expression.
We also analyzed a small group of brain tumors compared with normal brain samples taken from the cortex or cerebellum (Fig. 1, Table 1). One ganglioglioma sample and one atypical teratoid/rhabdoid sample showed expression of α dystroglycan at levels within the range of normal brain controls (Table 1), whereas the one retinoblastoma and one medulloblastoma sample showed very reduced expression of both α and β dystroglycan (Fig. 1).
Because native glycosylation of α dystroglycan is required for laminin binding, we also analyzed all samples for laminin binding using a blot overlay assay with recombinant laminin α2 protein (Fig. 1) (Table 1). Laminin α2 is the predominant α chain of laminin in adolescent and adult skeletal muscle [42–44]. Laminin binding was reduced in all RMS samples as compared with controls, as was its binding to 4 of 5 NBL samples. Unlike the NBL samples, however, 3 of 5 RMS samples showed some degree of laminin binding. It is unclear if this binding is reflective of small amounts of α dystroglycan that cannot be visualized with antibodies or if it represents another laminin binding protein. Regardless, laminin binding was significantly reduced (by 50% or more) in all RMS samples as compared with normal skeletal muscle. Such a reduction, both in signal intensity and in molecular weight, is consistent with reduced α dystroglycan glycosylation.
We next surveyed other pediatric tumors, including bone tumors, yolk sac tumors, Wilms tumors, liver tumors, and lymph nodes from Hodgkin's lymphoma patients. In each case, we compared α and β dystroglycan expression to appropriate normal pediatric bone, testes, ovary, kidney, liver, or lymph node controls (Fig. 2 and Table 1). One of 2 Ewing's and 1 of 5 osteosarcomas had reduced α dystroglycan expression compared with normal bone (Table 1). There was high variability in α dystroglycan expression among the normal bone samples. Assessments of reduced native α dystroglycan expression in tumor samples, therefore, were considered relative to the lowest expressing normal control. Almost all bone samples had a 160-kd β dystroglycan-positive species. This species is similar to the uncleaved αβ dystroglycan protein we previously described in skeletal muscles of cleavage-resistant dystroglycan transgenic mice [45] and suggests that some uncleaved αβ dystroglycan protein is normally present in pediatric bone. Several yolk sac tumors had increased α dystroglycan expression, as compared with the respective controls (Fig. 2), whereas 2 of 5 Wilms tumors had reduced 160 and 200 kd α dystroglycan species with enriched lower molecular weight species (120-kd and 110-kd fragments). No change in native α dystroglycan expression was observed in liver tumors compared with normal liver or in lymph nodes samples from Hodgkin's lymphoma patients compared with normal lymph nodes (Table 1). Thus, although some changes were observed, the other pediatric tumor types examined did not reproducibly show the pattern of altered α dystroglycan expression found in NBL and RMS.
We next immunostained larger numbers of tumors using tissue microarray slides containing embryonal or alveolar RMS samples (both with normal muscle controls), staged NBLs (with ganglioneuroma and tonsil controls), or medulloblastoma (with normal cerebellum controls) (Fig. 3). Both the embryonal and alveolar RMS samples had a significant reduction in α dystroglycan staining (about 50%, on average) relative to normal skeletal muscle (with both VIA4-1 and IIH6) (Fig. 3) (Table 2). In addition, α dystroglycan staining was significantly reduced relative to β dystroglycan staining within these tumor groups (P < .001 for both antibodies). α dystroglycan staining occurred primarily in the tumor vasculature in both embryonal and alveolar rhabodomyosarcoma sections, although tumor cell staining was sometimes present (Fig. 4). β dystroglycan staining, by contrast, was abundant in tumor cells in both tumor types (Fig. 4). Staining for α dystroglycan was often absent from all structures, including tumor vasculature, in large regions of the section, whereas normal skeletal muscle showed high levels of expression in the sarcolemmal membrane as well as in blood vessels (Fig. 4). Laminin expression was also significantly reduced relative to β dystroglycan expression in both types of RMS (P <.001, Table 2). The percentages of tumor samples with a score of 1, or no staining, for α dystroglycan were 67% (for VIA4-1) and 55% (for IIH6) for embryonal RMSs and 43% (for VIA4-1) and 33% (for IIH6) for alveolar RMSs, whereas no samples for either tumor type received this score for β dystroglycan staining. Some minor differences between IIH6 and VIA4-1 staining were observed in a small fraction of tumor samples, which is to be expected, as these antibodies likely bind to different epitopes on α dystroglycan [38].
Fig. 3.
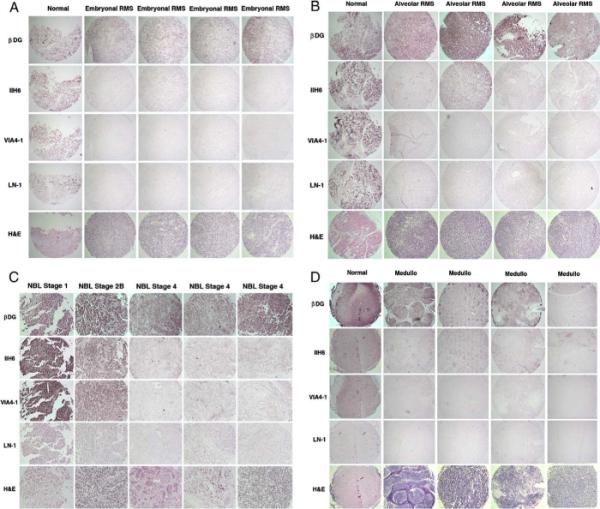
Tissue microarray staining for dystroglycan and laminin pediatric RMS, NBL, and medulloblastoma. Examples of array blocks stained with antibodies that recognize natively glycosylated α dystroglycan (IIH6 and VIA4-1), β dystroglycan polypeptide (βDG), laminin 1 (LN-1), or with hematoxylin and eosin (H & E) are shown. Each vertical column represents a single block cut and stained on independent slides with the indicated antibodies or stains. Each lateral column reflects cases from the same slide stained with the same antibody. α dystroglycan expression was reduced in embryonal RMS (A) and alveolar RMS (B) relative to β dystroglycan and relative to normal pediatric skeletal muscle (Normal). C, Expression of α dystroglycan was reduced in NBL with increasing tumor stage. (D) Expression of α dystroglycan, and sometimes β dystroglycan, was reduced in medulloblastoma (Medullo), compared with normal pediatric cerebellum (Normal). Blocks were photographed at 10× magnification in A, B, and D and at 20× in C.
Table 2.
Summary of tissue microarray staining for control and pediatric tumor samples
| n | βDG | VIA4-1 | IIH6 | LN-1 | |
|---|---|---|---|---|---|
| Normal muscle | 7 | 2.96 ± 0.03 | 2.78 ± 0.15 | 2.78 ± 0.15 | 2.55 ± 0.17 |
| RMS | |||||
| Embryonal | 23 | 2.91 ± 0.21 | 1.46 ± 0.11*** | 1.70 ± 0.15*** | 1.66 ± 0.21* |
| Alveolar | 14 | 2.89 ± 0.07 | 1.55 ± 0.16** | 1.90 ± 0.19* | 1.80 ± 0.13* |
| Ganglioneuroma/tonsil | 12 | 2.66 ± 0.10 | 2.57 ± 0.11 | 2.53 ± 0.12 | 2.08 ± 0.15 |
| NBL | |||||
| Stage 1 | 15 | 2.76 ± 0.08 | 2.34 ± 0.14 | 2.37 ± 0.13 | 2.00 ± 0.14 |
| Stage 2 | 14 | 2.87 ± 0.06 | 2.11 ± 0.17 | 2.14 ± 0.15 | 2.14 ± 0.12 |
| Stage 3 | 16 | 2.77 ± 0.10 | 1.91 ± 0.13** | 1.84 ± 0.18** | 2.01 ± 0.14 |
| Stage 4s | 11 | 2.85 ± 0.09 | 1.82 ± 0.13*** | 1.85 ± 0.12*** | 1.79 ± 0.10 |
| Stage 4 | 29 | 2.80 ± 0.07 | 1.64 ± 0.09*** | 1.59 ± 0.06*** | 1.91 ± 0.10 |
| Stage 1 + 2 | 29 | 2.81 ± 0.05 | 2.23 ± 0.11 | 2.26 ± 0.10 | 2.07 ± 0.09 |
| Stage 4 | 29 | 2.80 ± 0.07 | 1.64 ± 0.09*** | 1.60 ± 0.06*** | 1.91 ± 0.10 |
| Normal cerebellum | 11 | 2.87 ± 0.07 | 2.60 ± 0.11 | 2.55 ± 0.12 | 2.54 ± 0.19 |
| Medulloblastoma | 45 | 2.78 ± 0.06 | 1.71 ± 0.11*** | 1.73 ± 0.11** | 1.46 ± 0.09*** |
NOTE. Samples were scored by a blinded investigator on a 3-point scale: 3, strong staining; 2, moderate or intermittent staining; 1, no significant staining. Average staining scores for all cases of a particular tumor type are given where n equals the number of unique cases analyzed. Between 1 and 8 blocks of each tumor were analyzed to generate the staining score for each case, with each case represented, on average, between 2 and 3 times per slide. Errors are SEMs. P values reflect a 2-tailed paired Student t test between tumor samples and control tissue (listed immediately above each tumor class) or between pooled data for stage 1 + 2 NBL and stage 4 NBL.
P < .05.
P < .01.
P < .001.
Fig. 4.
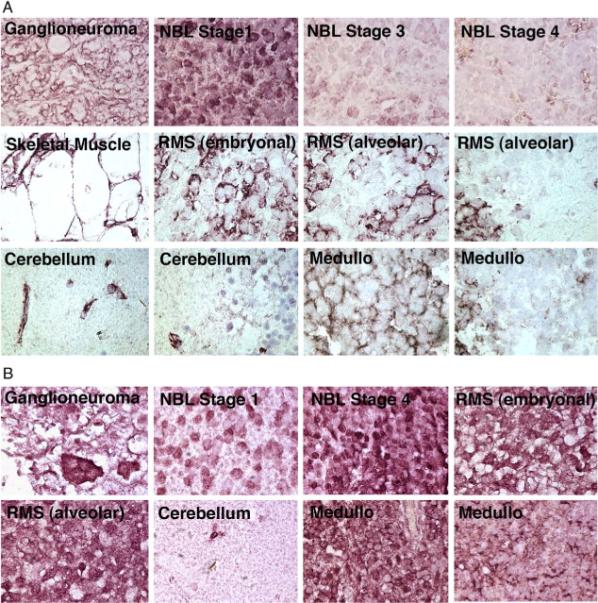
High-power images of α and β dystroglycan immunostaining in pediatric tumors and controls. A, IIH6, an antibody that binds to natively glycosylated α dystroglycan, was used to probe expression in ganglioneuroma, NBL, pediatric skeletal muscle, RMS, pediatric brain (cerebellum), and medulloblastoma (Medullo). B, An antibody to β dystroglycan polypeptide was used to demonstrate β dystroglycan expression in tumor cells taken from the same tissues. Sections were imaged at 100× magnification.
Similar results were observed for NBLs (Figs. 3 and 4) (Table 2): 5% (VIA4-1) and 18% (IIH6) of stage 1, 19% (VIA4-1) and 19% (IIH6) of stage 2, 33% (VIA4-1) and 43% (IIH6) of stage 3, 33% (VIA4-1) and 24% (IIH6) of stage 4s, and 39% (VIA4-1) and 44% (IIH6) of stage 4 NBL had no staining for α dystroglycan. Stage 3 and 4 tumors each had 3% of samples with no β dystroglycan staining, whereas stages 1, 2, and 4s had 0% with this score. A significant difference in α dystroglycan expression was found between the pooled data sets containing stages 1 and 2 NBL and stage 4 NBL (P < .001, Table 2). Insufficient numbers of samples were available to assess differences between other individual tumor stages. α dystroglycan staining was present primarily on Schwannian stromal cells in ganglioneuromas and some lower-stage NBLs, whereas β dystroglycan staining was very high in neuroblastic cells in ganglioneuromas and in NBLs of all stages (Fig. 4). Thus, the reduction in α dystroglycan expression with increasing tumor stage could be due in part to the relative preponderance of staining in nonneuroblastic cells. Regardless, α dystroglycan clearly was reduced to absent in neuroblastic cells in high stage NBL, whereas β dystroglycan was abundant (Fig. 4).
Lastly, we analyzed tissue arrays that contained medulloblastoma samples along with normal cerebellum (Figs. 3 and 4)(Table 2). Again, we observed a highly significant decrease in VIA4-1 and IIH6 staining (P <.001 for both antibodies) in medulloblastomas compared with normal cerebellum. Fifty percent of medulloblastoma samples showed no VIA4-1 or IIH6 staining (score, 1), compared with 0% of normal cerebellum controls. Only 1% of medulloblastomas showed no staining for β dystroglycan. In addition, α dystroglycan expression was clearly high in blood vessels of normal cerebellum (10/11), whereas this score of 3 (strong staining) in blood vessels only occurred in 1 of 45 medulloblastomas. α dystroglycan could also be observed in some glial and neuronal cells in normal cerebellum, akin to the heterogeneous expression in these cell types previously reported [46–48], whereas expression was predominantly in the vasculature in medulloblastomas (Fig. 4). As with the other tumors studied, α dystroglycan staining was reduced to absent from tumor cells in most medulloblastomas, whereas β dystroglycan staining was abundant.
4. Discussion
We have shown a significant reduction in native α dystroglycan expression in embryonal RMS, alveolar RMS, NBL, and medulloblastoma. In almost all tumor samples examined, expression of natively glycosylated α dystroglycan expression was reduced, whereas β dystroglycan remained present. In addition, the degree of reduced α dystroglycan expression correlated with tumor stage for NBL, with stage 4 samples being significantly reduced relative to stage 1 and 2–pooled samples. Like many molecules that are altered in tumors, however, there was significant heterogeneity both between tumors and within individual tumors with regard to dystroglycan expression. Thus, dystroglycan, although a candidate to participate in tumor progression, is by no means a singular marker for tumor advancement, and further work will be required to understand both its role in these tumors and the mechanisms for its heterogeneous expression. Nevertheless, these data build on previous studies with regard to dystroglycan expression in colon and breast cancer [28,29] and demonstrate that several pediatric solid tumors also have altered α dystroglycan glycosylation and/or expression that may contribute to tumor cell behavior and to subsequent clinical outcome.
The altered expression of dystroglycan seen in these pediatric tumors likely arises from deficient glycosylation of α dystroglycan. The simplest mechanism by which this can occur is via reduced expression of glycosyltransferases that modify the α dystroglycan protein. The 6 CMD genes known to affect α dystroglycan glycosylation are therefore good candidate mediators of the tumor-specific changes we have found. Loss of any of these 6 genes, POMT1, POMT2, POMGnT1, FUKUTIN, FKRP, and LARGE, reduces the binding of the glycosylation-dependent α dystroglycan antibodies used here and also reduces or abrogates laminin binding [18,24]. These changes are consistent with the changes we have shown here for RMS, NBL, and medulloblastoma. Current studies are focused at identifying changes in the expression of CMD genes that could explain the altered glycosylation of α dystroglycan found in these tumor samples.
Although the relationship of reduced α dystroglycan glycosylation to tumor biology remains to be determined, one of several scenarios seems likely. First, it is well known from the work on α dystroglycan glycosylation in the congenital muscular dystrophies that native glycosylation of α dystroglycan is required in order for extracellular matrix proteins, including laminins, to bind [20]. Because dystroglycan is a major cell surface receptor for the extracellular matrix, loss of matrix binding to α dystroglycan in tumor cells could permit their metastasis and migration from the original tumor site. α dystroglycan not only binds laminin but can stimulate the incorporation of laminin into an extracellular matrix [49]. Thus, tumor cells with aberrantly glycosylated α dystroglycan may also have reduced ability to incorporate laminin into their micro-environment. By virtue of unmasking “novel” binding sites, decreased glycosylation may also lead to a gain of function for dystroglycan. For example, Fletcher et al [50] have shown that hAG-2 and hAG-3, 2 secreted proteins expressed in some breast cancers, can bind unglycosylated polypeptides in the mucin domain of α dystroglycan, a region that would normally be masked by dense glycosylation in the native protein. Binding of these or other factors may stimulate several cell signaling pathways that can be activated by dystroglycan, including those mediated by the βγ subunits of trimeric G proteins [11], Ras [12], ERK-MAP kinase [13], PI3/Akt kinase [14], Rac [15], and growth factor receptor 2 [16,17]. Further studies will be required to fully understand both the nature of the reduced glycosylation in these pediatric tumors and the consequences of this loss for tumor cell behavior.
Acknowledgments
The authors thank Drs Stephen Qualman and Amanda Termuhlen at Columbus Children's Hospital for additional support in acquiring tumor samples and for funds related to their acquisition. Additional thanks go to Dr Qualman for assistance in interpreting staining data. Tissue microarrays were purchased from the Biopathology Core at CCRI after institutional review board approval from Columbus Children's Hospital and the appropriate Children's Oncology Group tumor subcommittees.
This work was supported by National Institutes of Health grant (AR050202) to PTM. ED was supported by a Samuel J. Roessler Research Scholarship through the Ohio State University College of Medicine and Public Health, Columbus, OH.
References
- [1].Ibraghimov-Beskrovnaya O, Ervasti JM, Leveille CJ, Slaughter CA, Sernett SW, Campbell KP. Primary structure of dystrophin-associated glycoproteins linking dystrophin to the extracellular matrix. Nature. 1992;355:696–702. doi: 10.1038/355696a0. [DOI] [PubMed] [Google Scholar]
- [2].Durbeej M, Henry MD, Ferletta M, Campbell KP, Ekblom P. Distribution of dystroglycan in normal adult mouse tissues. J Histochem Cytochem. 1998;46:449–57. doi: 10.1177/002215549804600404. [DOI] [PubMed] [Google Scholar]
- [3].Durbeej M, Henry MD, Campbell KP. Dystroglycan in development and disease. Curr Opin Cell Biol. 1998;10:594–601. doi: 10.1016/s0955-0674(98)80034-3. [DOI] [PubMed] [Google Scholar]
- [4].Gorecki DC, Derry JM, Barnard EA. Dystroglycan: brain localisation and chromosome mapping in the mouse. Hum Mol Genet. 1994;3:1589–97. doi: 10.1093/hmg/3.9.1589. [DOI] [PubMed] [Google Scholar]
- [5].Zaccaria ML, Di Tommaso F, Brancaccio A, Paggi P, Petrucci TC. Dystroglycan distribution in adult mouse brain: a light and electron microscopy study. Neuroscience. 2001;104:311–24. doi: 10.1016/s0306-4522(01)00092-6. [DOI] [PubMed] [Google Scholar]
- [6].Ervasti JM, Campbell KP. Membrane organization of the dystrophin-glycoprotein complex. Cell. 1991;66:1121–31. doi: 10.1016/0092-8674(91)90035-w. [DOI] [PubMed] [Google Scholar]
- [7].Henry MD, Campbell KP. Dystroglycan inside and out. Curr Opin Cell Biol. 1999;11:602–7. doi: 10.1016/s0955-0674(99)00024-1. [DOI] [PubMed] [Google Scholar]
- [8].Martin PT. Dystroglycan glycosylation and its role in matrix binding in skeletal muscle. Glycobiology. 2003;13:55R–66R. doi: 10.1093/glycob/cwg076. [DOI] [PubMed] [Google Scholar]
- [9].Blake DJ, Weir A, Newey SE, Davies KE. Function and genetics of dystrophin and dystrophin-related proteins in muscle. Physiol Rev. 2002;82:291–329. doi: 10.1152/physrev.00028.2001. [DOI] [PubMed] [Google Scholar]
- [10].Chung W, Campanelli JT. WW and EF hand domains of dystrophin-family proteins mediate dystroglycan binding. Mol Cell Biol Res Commun. 1999;2:162–71. doi: 10.1006/mcbr.1999.0168. [DOI] [PubMed] [Google Scholar]
- [11].Zhou YW, Oak SA, Senogles SE, Jarrett HW. Laminin-alpha1 globular domains 3 and 4 induce heterotrimeric G protein binding to alpha-syntrophin's PDZ domain and alter intracellular Ca2+ in muscle. Am J Physiol Cell Physiol. 2005;288:C377–88. doi: 10.1152/ajpcell.00279.2004. [DOI] [PubMed] [Google Scholar]
- [12].Chockalingam PS, Cholera R, Oak SA, Zheng Y, Jarrett HW, Thomason DB. Dystrophin-glycoprotein complex and Ras and Rho GTPase signaling are altered in muscle atrophy. Am J Physiol Cell Physiol. 2002;283:C500–11. doi: 10.1152/ajpcell.00529.2001. [DOI] [PubMed] [Google Scholar]
- [13].Spence HJ, Dhillon AS, James M, Winder SJ. Dystroglycan, a scaffold for the ERK-MAP kinase cascade. EMBO Rep. 2004;5:484–9. doi: 10.1038/sj.embor.7400140. [DOI] [PMC free article] [PubMed] [Google Scholar]
- [14].Langenbach KJ, Rando TA. Inhibition of dystroglycan binding to laminin disrupts the PI3K/AKT pathway and survival signaling in muscle cells. Muscle Nerve. 2002;26:644–53. doi: 10.1002/mus.10258. [DOI] [PubMed] [Google Scholar]
- [15].Zhou YW, Thomason DB, Gullberg D, Jarrett HW. Binding of laminin alpha1-chain LG4-5 domain to alpha-dystroglycan causes tyrosine phosphorylation of syntrophin to initiate Rac1 signaling. Biochemistry. 2006;45:2042–52. doi: 10.1021/bi0519957. [DOI] [PubMed] [Google Scholar]
- [16].Russo K, Di Stasio E, Macchia G, Rosa G, Brancaccio A, Petrucci TC. Characterization of the beta-dystroglycan-growth factor receptor 2 (Grb2) interaction. Biochem Biophys Res Commun. 2000;274:93–8. doi: 10.1006/bbrc.2000.3103. [DOI] [PubMed] [Google Scholar]
- [17].Yang B, Jung D, Motto D, Meyer J, Koretzky G, Campbell KP. SH3 domain-mediated interaction of dystroglycan and Grb2. J Biol Chem. 1995;270:11711–4. doi: 10.1074/jbc.270.20.11711. [DOI] [PubMed] [Google Scholar]
- [18].Barresi R, Campbell KP. Dystroglycan: from biosynthesis to pathogenesis of human disease. J Cell Sci. 2006;119:199–207. doi: 10.1242/jcs.02814. [DOI] [PubMed] [Google Scholar]
- [19].Higginson JR, Winder SJ. Dystroglycan: a multifunctional adaptor protein. Biochem Soc Trans. 2005;33:1254–5. doi: 10.1042/BST0331254. [DOI] [PubMed] [Google Scholar]
- [20].Michele DE, Barresi R, Kanagawa M, et al. Post-translational disruption of dystroglycan-ligand interactions in congenital muscular dystrophies. Nature. 2002;418:417–22. doi: 10.1038/nature00837. [DOI] [PubMed] [Google Scholar]
- [21].Chiba A, Matsumura K, Yamada H, et al. Structures of sialylated O-linked oligosaccharides of bovine peripheral nerve alpha-dystroglycan. The role of a novel O-mannosyl-type oligosaccharide in the binding of alpha-dystroglycan with laminin. J Biol Chem. 1997;272:2156–62. doi: 10.1074/jbc.272.4.2156. [DOI] [PubMed] [Google Scholar]
- [22].Sasaki T, Yamada H, Matsumura K, Shimizu T, Kobata A, Endo T. Detection of O-mannosyl glycans in rabbit skeletal muscle alpha-dystroglycan. Biochim Biophys Acta. 1998;1425:599–606. doi: 10.1016/s0304-4165(98)00114-7. [DOI] [PubMed] [Google Scholar]
- [23].Smalheiser NR, Haslam SM, Sutton-Smith M, Morris HR, Dell A. Structural analysis of sequences O-linked to mannose reveals a novel Lewis X structure in cranin (dystroglycan) purified from sheep brain. J Biol Chem. 1998;273:23698–703. doi: 10.1074/jbc.273.37.23698. [DOI] [PubMed] [Google Scholar]
- [24].Martin PT, Freeze HH. Glycobiology of neuromuscular disorders. Glycobiology. 2003;13:67R–75R. doi: 10.1093/glycob/cwg077. [DOI] [PubMed] [Google Scholar]
- [25].Brennan PA, Jing J, Ethunandan M, Gorecki D. Dystroglycan complex in cancer. Eur J Surg Oncol. 2004;30:589–92. doi: 10.1016/j.ejso.2004.03.014. [DOI] [PubMed] [Google Scholar]
- [26].Raz A. Dystroglycan: to adhere or not adhere during cancer progression. Cancer Biol Ther. 2004;3:976. doi: 10.4161/cbt.3.10.1224. [DOI] [PubMed] [Google Scholar]
- [27].Sgambato A, Brancaccio A. The dystroglycan complex: from biology to cancer. J Cell Physiol. 2005;205:163–9. doi: 10.1002/jcp.20411. [DOI] [PubMed] [Google Scholar]
- [28].Henry MD, Cohen MB, Campbell KP. Reduced expression of dystroglycan in breast and prostate cancer. Hum Pathol. 2001;32:791–5. doi: 10.1053/hupa.2001.26468. [DOI] [PubMed] [Google Scholar]
- [29].Sgambato A, Migaldi M, Montanari M, et al. Dystroglycan expression is frequently reduced in human breast and colon cancers and is associated with tumor progression. Am J Pathol. 2003;162:849–60. doi: 10.1016/S0002-9440(10)63881-3. [DOI] [PMC free article] [PubMed] [Google Scholar]
- [30].Jing J, Lien CF, Sharma S, Rice J, Brennan PA, Gorecki DC. Aberrant expression, processing and degradation of dystroglycan in squamous cell carcinomas. Eur J Cancer. 2004;40:2143–51. doi: 10.1016/j.ejca.2004.05.018. [DOI] [PubMed] [Google Scholar]
- [31].Losasso C, Di Tommaso F, Sgambato A, et al. Anomalous dystroglycan in carcinoma cell lines. FEBS Lett. 2000;484:194–8. doi: 10.1016/s0014-5793(00)02157-8. [DOI] [PubMed] [Google Scholar]
- [32].Muschler J, Levy D, Boudreau R, Henry M, Campbell K, Bissell MJ. A role for dystroglycan in epithelial polarization: loss of function in breast tumor cells. Cancer Res. 2002;62:7102–9. [PubMed] [Google Scholar]
- [33].Sgambato A, Di Salvatore MA, De Paola B, et al. Analysis of dystroglycan regulation and functions in mouse mammary epithelial cells and implications for mammary tumorigenesis. J Cell Physiol. 2006;207:520–9. doi: 10.1002/jcp.20600. [DOI] [PubMed] [Google Scholar]
- [34].Xia B, Hoyte K, Kammesheidt A, Deerinck T, Ellisman M, Martin PT. Overexpression of the CT GalNAc transferase in skeletal muscle alters myofiber growth, neuromuscular structure, and laminin expression. Dev Biol. 2002;242:58–73. doi: 10.1006/dbio.2001.0530. [DOI] [PubMed] [Google Scholar]
- [35].Talts JF, Andac Z, Gohring W, Brancaccio A, Timpl R. Binding of the G domains of laminin alpha1 and alpha2 chains and perlecan to heparin, sulfatides, alpha-dystroglycan and several extracellular matrix proteins. EMBO J. 1999;18:863–70. doi: 10.1093/emboj/18.4.863. [DOI] [PMC free article] [PubMed] [Google Scholar]
- [36].Xia B, Martin PT. Modulation of agrin binding and activity by the CT and related carbohydrate antigens. Mol Cell Neurosci. 2002;19:539–51. doi: 10.1006/mcne.2001.1095. [DOI] [PubMed] [Google Scholar]
- [37].Parkhomovskiy N, Kammesheidt A, Martin PT. N-acetyllactosamine and the CT carbohydrate antigen mediate agrin-dependent activation of MuSK and acetylcholine receptor clustering in skeletal muscle. Mol Cell Neurosci. 2000;15:380–97. doi: 10.1006/mcne.2000.0835. [DOI] [PubMed] [Google Scholar]
- [38].Ervasti JM, Campbell KP. A role for the dystrophin-glycoprotein complex as a transmembrane linker between laminin and actin. J Cell Biol. 1993;122:809–23. doi: 10.1083/jcb.122.4.809. [DOI] [PMC free article] [PubMed] [Google Scholar]
- [39].Herrmann R, Straub V, Blank M, et al. Dissociation of the dystroglycan complex in caveolin-3-deficient limb girdle muscular dystrophy. Hum Mol Genet. 2000;9:2335–40. doi: 10.1093/oxfordjournals.hmg.a018926. [DOI] [PubMed] [Google Scholar]
- [40].Ahn J, Serrano de la Pena L, Shore EM, Kaplan FS. Paresis of a bone morphogenetic protein-antagonist response in a genetic disorder of heterotopic skeletogenesis. J Bone Joint Surg Am. 2003;85-A:667–74. doi: 10.2106/00004623-200304000-00013. [DOI] [PubMed] [Google Scholar]
- [41].Holt KH, Crosbie RH, Venzke DP, Campbell KP. Biosynthesis of dystroglycan: processing of a precursor propeptide. FEBS Lett. 2000;468:79–83. doi: 10.1016/s0014-5793(00)01195-9. [DOI] [PubMed] [Google Scholar]
- [42].Engvall E, Earwicker D, Haaparanta T, Ruoslahti E, Sanes JR. Distribution and isolation of four laminin variants; tissue restricted distribution of heterotrimers assembled from five different subunits. Cell Regul. 1990;1:731–40. doi: 10.1091/mbc.1.10.731. [DOI] [PMC free article] [PubMed] [Google Scholar]
- [43].Sanes JR, Engvall E, Butkowski R, Hunter DD. Molecular heterogeneity of basal laminae: isoforms of laminin and collagen IV at the neuromuscular junction and elsewhere. J Cell Biol. 1990;111:1685–99. doi: 10.1083/jcb.111.4.1685. [DOI] [PMC free article] [PubMed] [Google Scholar]
- [44].Chiu AY, Sanes JR. Development of basal lamina in synaptic and extrasynaptic portions of embryonic rat muscle. Dev Biol. 1984;103:456–67. doi: 10.1016/0012-1606(84)90333-6. [DOI] [PubMed] [Google Scholar]
- [45].Jayasinha V, Nguyen HH, Xia B, Kammesheidt A, Hoyte K, Martin PT. Inhibition of dystroglycan cleavage causes muscular dystrophy in transgenic mice. Neuromuscul Disord. 2003;13:365–75. doi: 10.1016/s0960-8966(03)00040-3. [DOI] [PubMed] [Google Scholar]
- [46].Moukhles H, Carbonetto S. Dystroglycan contributes to the formation of multiple dystrophin-like complexes in brain. J Neurochem. 2001;78:824–34. doi: 10.1046/j.1471-4159.2001.00466.x. [DOI] [PubMed] [Google Scholar]
- [47].Saito Y, Yamamoto T, Mizuguchi M, et al. Altered glycosylation of alpha-dystroglycan in neurons of Fukuyama congenital muscular dystrophy brains. Brain Res. 2006;1075:223–8. doi: 10.1016/j.brainres.2005.12.108. [DOI] [PubMed] [Google Scholar]
- [48].Henion TR, Qu Q, Smith FI. Expression of dystroglycan, fukutin and POMGnT1 during mouse cerebellar development. Brain Res Mol Brain Res. 2003;112:177–81. doi: 10.1016/s0169-328x(03)00055-x. [DOI] [PubMed] [Google Scholar]
- [49].Henry MD, Campbell KP. A role for dystroglycan in basement membrane assembly. Cell. 1998;95:859–70. doi: 10.1016/s0092-8674(00)81708-0. [DOI] [PubMed] [Google Scholar]
- [50].Fletcher GC, Patel S, Tyson K, et al. hAG-2 and hAG-3, human homologues of genes involved in differentiation, are associated with oestrogen receptor-positive breast tumours and interact with metastasis gene C4.4a and dystroglycan. Br J Cancer. 2003;88:579–85. doi: 10.1038/sj.bjc.6600740. [DOI] [PMC free article] [PubMed] [Google Scholar]