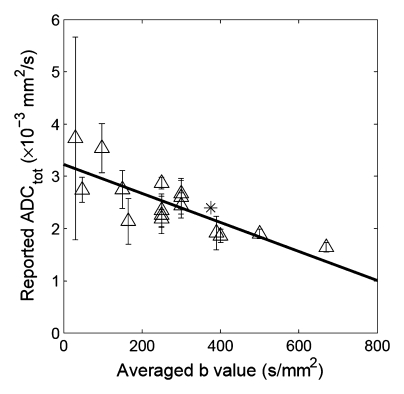
Figure 1a:
Correlation between reported ADC (ADCtot) values from published literature (Table 1) and averaged b values used for exponential fitting in each publication. (a) Renal parenchyma: R = 0.79, P = .0002; (b) renal cortex: R = 0.65, P = .0575; and (c) renal medulla: R = 0.50, P = .171. ∗ = ADC estimate from simulated diffusion decay curves sampled at b from 0 to 750 sec/mm2 with intervals of 50 sec/mm2. The range of b values sampled from published DW imaging studies in healthy volunteers varied considerably. The higher the averaged b value, the lower the estimated ADC values, suggesting an intrinsic limitation of the monoexponential model to derive ADC.

