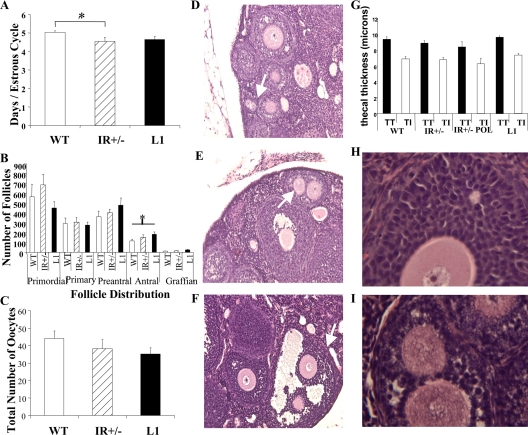
Figure 3.
Assessment of ovarian function. A, Estrous cycling. The data represent the average number of days ± sem per estrous cycle (n = 6–11). B, Follicular analysis. The average number of healthy primordial, primary, preantral, antral, and graffian follicles (n = 6–8) is shown. C, Superovulation. The number of oocytes retrieved ± sem is shown (n = 7–9). *, P < 0.05. Polyovular follicles in IR+/− ovaries (indicated with white arrows). Photomicrographs of primary (D), preantral (E), and antral (F) follicles are depicted. For thecal dimensions, the mean ± sem of thecal thickness (TT, total thickness; TI, theca interna) in WT, IR+/−, polyovular IR+/− (IR+/− POL), and L1 follicles is presented (G). Granulosa cell morphology in WT (H) and a subset of IR+/− ovaries (I) is shown.

