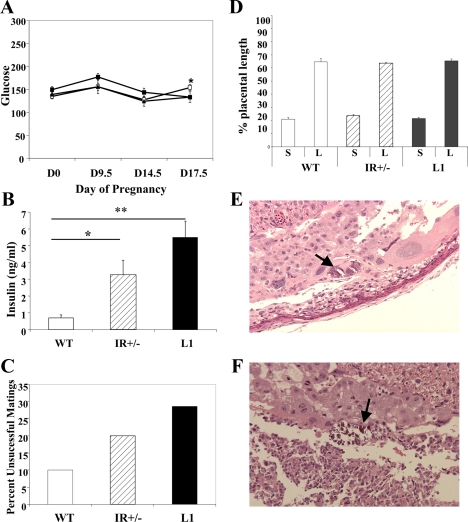
Figure 4.
Gestational analyses and metabolic characterization. A, Fed glucose levels from gestational d 0, 9.5, 14.5, and 17.5 remained in the nondiabetic range in WT (closed square), IR+/− (open square), and L1 (closed triangle) mice. B, The data represent the mean ± sem fed insulin level in late gestation, d 17.5 (n = 5–8). *, P < 0.05; **, P < 0.005. C, Pregnancy outcomes and unsuccessful matings. The data represent the percentage of plugged females that did not proceed to successful pregnancies (n = 7–10). D, Placental histology. Histological sections of placentae from gestational d 17.5 were evaluated with light microscopy. Percentage of placental diameter consisting of labyrinthian (L) and spongiform (S) layers is presented. Foci of calcifications in IR+/− (E) and L1 (F) placentae are indicated with black arrows. Photomicrographs were taken under ×20 magnification.

