Abstract
Tomographic phase microscopy is a laser interferometry technique in which a 3D refractive index map of a biological sample is constructed from quantitative phase images collected at a set of illumination angles. Although the resulting tomographic images provide valuable information, their resolution declines at axial distances beyond about 1 μm from the focal plane. We describe an improved 3D reconstruction algorithm in which the field at the focal plane is numerically propagated to depths throughout the sample. Diffraction is thus incorporated, extending the depth of focus to more than 10 μm. Tomograms with improved focal depth are demonstrated for single HT29 cells.
The recently developed method of tomographic phase microscopy (TPM) [1] creates maps of the structure of live cells and tissues in 3D, with contrast provided by the refractive index of the sample. In TPM, a heterodyne laser interferometric microscope [2] is used to obtain quantitative phase images of a sample collected at a set of illumination angles. A 3D refractive index map is then constructed via a filtered back-projection algorithm, in analogy to x-ray tomography [3].
The TPM reconstruction algorithm is based on the projection approximation, according to which light traverses the sample as straight lines (rays), and the optical path length is computed as the line integral of the refractive index along the ray [4,5]. However, this approximation is not accurate for samples that are thick compared with the depth of focus of the imaging system and/or that have a sufficiently large refractive index relative to that of the background. In particular, the projection approximation is inaccurate for high-resolution imaging, since the large numerical aperture (NA) of the objective lens gives a small depth of focus. In such cases diffraction must be taken into account, requiring a different approach. This is the purview of diffraction tomography. One such approach is to use the first-order Born or Rytov approximation in combination with filtered back-propagation [3]. However, these approximations placed strong constraints on maximum sample size and refractive index contrast. More complex algorithms have been proposed, including higher-order Born or Rytov approximations, which usually require extensive numerical computations to solve nonlinear inversion problems [6].
In TPM, the limitations of the projection approximation manifest themselves as a gradual deterioration of image quality at progressive distances above and below the focal plane. As the sample plane moves away from the focus, the edges of objects develop fringes and other distortions and overall spatial resolution is reduced (Fig. 2 in [1]). One way to maintain high resolution over an extended axial range is to acquire tomograms at multiple depths within the sample and combine their undistorted portions [1]. This greatly increases both the amount of data to be collected and the collection time required. Here we present a new algorithm that extends the sampling depth of the projection approximation by incorporating wave propagation into the filtered backprojection algorithm.
Fig. 2.
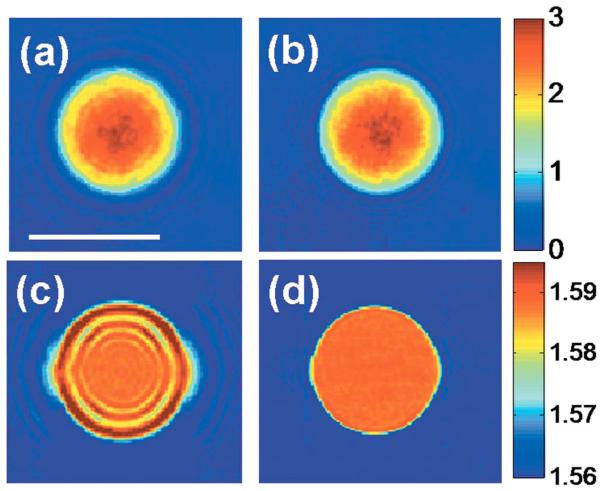
(Color online) Effect of sampling depth on refractive index tomograms. (a) Phase image of a 10 μm polystyrene bead with the focus 4 μm above the center of the bead. (b) Quantitative phase image after applying the propagation correction, with the focus brought to the center of the bead. The color bar indicates phase in radians. (c) x–y slice of the refractive index tomogram for the same focus as in (a). (d) x–y slice of the refractive index tomogram after applying the propagation algorithm. The color bar indicates the refractive index measured at λ=633 nm.
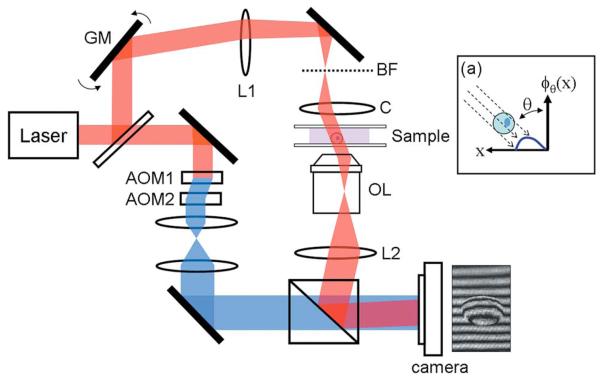
The experimental setup is as previously described [1]. The setup is based on a Mach–Zehnder heterodyne phase microscope (Fig. 1) [2]. A helium–neon laser beam (λ=633 nm) is divided into sample and reference arm paths by a beam splitter. In the sample arm, a tilting galvanometer-mounted mirror positioned at an image plane varies the angle of illumination of the laser beam traversing the sample over ±60°.
Fig. 1.
(Color online) Tomographic phase microscope. GM, galvanometer scanning mirror; L1, lens, focal length f =250 mm; BF, back focal plane of condenser lens; C, condenser lens; OL, objective lens; L2, lens, 200 mm; AOMs, acousto-optic modulators. The frequency-shifted reference laser beam is shown in blue online. The diagram (a) describes the phase projection geometry, with θ the illumination angle.
Samples are prepared in chambers composed of two glass coverslips separated by a 125 μm plastic spacer. Sample chambers are clamped on a stage between an oil-immersion condenser lens (Nikon 1.4 NA) and an objective lens (Olympus UPLSAPO 100×, 1.4 NA). A tube lens (focal length f=200 mm) images the sample onto the camera plane with magnification M=110. In the reference arm, the laser beam passes through two acousto-optic modulators (AOMs), and net frequency of the beam is shifted by Ω=1250 Hz.
A beam splitter recombines the sample and reference beams, creating an interference image that is recorded by a high-speed complementary metal-oxide semiconductor camera (Photron 1024PCI). For each illumination angle the distribution of the irradiance, I(x,y;θ , t), at the camera plane is determined by the interference between the frequency-shifted reference beam and the magnified sample beam:
| (1) |
Here, IR and IS(x,y) are the intensities of the reference and sample fields, respectively, and ϕθ (x,y) is the phase shift induced by the sample, with transverse coordinates (x,y); θ is the angle of illumination of the sample beam with respect to the optic axis, and km=2πnm/λ is the wavenumber of the laser in the medium, with nm the refractive index of the medium. At each angle step the camera records four interferograms, each separated by 200 μs, exactly one-quarter the reciprocal of the heterodyne frequency Ω. In doing so, four interference images, I1, I2 , I3 , and I4 , are produced in which the sample-reference phase shift of each consecutive image is incremented by π/2. The E-field of the sample beam, uθ(x,y), is then obtained by applying phase shifting interferometry using the four-bucket algorithm [7]:
| (2) |
Taking the argument of u0(x,y), we obtain the phase distribution of the sample field relative to the reference phase. Phase unwrapping is then performed, with 2π-phase ambiguities resolved using Goldstein's algorithm [8]. Finally, we remove the phase ramp along the beam tilting direction, (km sin θ)x/M, induced by the nonzero angle θ between sample and reference beams. This yields a set of quantitative phase images at the focal plane, ϕθ(x,y), at about 100 illumination angles in our studies
In our earlier work [1], the filtered backprojection algorithm was used to construct a 3D refractive index map from these quantitative phase images. The projection approximation is satisfied reasonably well for cells of diameter up to ~10 μm, but optimal image quality was obtained only within about 1 μm of the focal plane. Our strategy is to numerically propagate the sample field to various axial distances, d, and create tomograms at multiple planes within the sample. This is the numerical equivalent of acquiring tomograms at multiple focal planes by physically translating objective lens in the axial direction.
We first locate the focus at the (approximate) center of the sample, z=0, and, as above, obtain the E-field and quantitative phase images. We can then obtain a tomogram with well-resolved features near the center of the sample. We then calculate the propagation of this field in free space by a distance d:
| (3) |
Here, Uθ(kx,ky;z=0) is the Fourier transform of the field, uθ(x,y;z=0), and z=d is the axial location of the focus. Equation (3) provides a new set of field amplitudes and quantitative phase images at the set of illumination angles, in which the focus has been propagated to z=d. We then apply the filtered back-projection method to the new quantitative phase image to obtain a tomogram with well-resolved features near z=d. This procedure is repeated for successive values of d such that optimal focus is maintained throughout the depth of the sample.
We first tested our propagation algorithm on a sample composed of 10 μm diameter polystyrene beads (n=1.588 at λ=633 nm) in immersion oil (n =1.559 at λ=633 nm). Figure 2(a) shows the quantitative phase image of a single bead for θ =0° when the focus is 4 μm above the center of the bead. A fringe pattern is observed around the bead, due to diffraction. The refractive index tomogram at this focus position also displays prominent fringe pattern artifacts [as seen in the x–y slice of Fig. 2(c)].
After applying the propagation correction with d =4 μm, bringing the focus to the center of the bead, the fringe pattern in the quantitative phase image is greatly attenuated [Fig. 2(b)]. Similarly, the x–y slice of the refractive index tomogram at the center of the bead is nearly uniform and free from fringe artifacts after applying the propagation algorithm [Fig. 2(d)]. Measured values of the refractive index contrast between bead and oil are in agreement with manufacturers' specifications (see [1]).
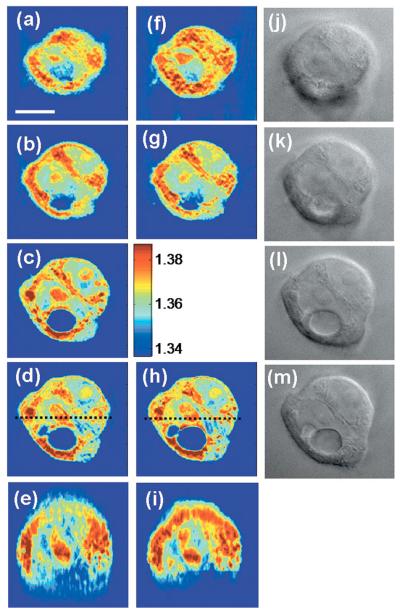
Next, we applied the propagation algorithm to imaging single cells of a human colon adenocarcinoma cell line, HT29. The cells were dissociated from culture dishes and allowed to attach to chamber cover-slips for about 4 h before imaging. Angle-dependent field images were then obtained with the objective focused approximately at the center of the cells. Figures 3(a)–3(d) show four x–y slices of the resulting tomogram, uncorrected for propagation, at a succession of sample depths spaced by 2 μm. The slice shown in Fig. 3(c) is at the focal plane (z=0). We recorded a stack of bright field images of the same cell within 1 min after acquiring the tomogram data. These are shown in Figs. 3(j)–3(m) and correspond to the tomographic slices in Figs. 3(a)–3(d).
Fig. 3.
(Color online) Refractive index tomogram of an HT29 cell before and after applying the propagation correction. (a)–(d) Successive x–y slices of the refractive index tomogram at 2 μm intervals in the axial direction, before applying the propagation correction. (f)–(h) x–y slices corresponding to (a), (b), and (d) after applying the propagation algorithm. (e) and (i) x–z slices along the dashed lines indicated in (d) and (h), respectively. The color bar indicates refractive index at λ=633 nm. (j)–(m) Bright field images with the image focus corresponding to (a)–(d). Scale bar, 10 μm.
At the plane of focus [Fig. 3(c)], sharp structures such as two nucleoli, the boundary of the nucleus and a large vacuole can be seen, and there is a clear correspondence between the tomogram and the bright field image [Fig. 3(l)]. As seen in Fig. 3(b), however, out-of-focus slices exhibit a loss of transverse resolution in these structures, even for a defocus of only 2 μm.
Figures 3(f)–3(h) show the corresponding x–y slices of the tomogram in which the propagation correction has been applied so that the computed sampling depth matches the position of the slice. Overall sharpness is substantially improved, particularly at boundaries. The improved resolution of the laminar structure revealed in Fig. 3(g) by the propagation algorithm [compare Fig. 3(b)] can be identified in the bright field image, Fig. 3(k). Figures 3(e) and 3(i), x–z sections along the dashed lines indicated in Figs. 3(d) and 3(h), respectively, show clear distinctions of two nucleoli and details of the nuclear boundary at the top part of the cell after the correction.
This new algorithm incorporates diffraction effects into the filtered backprojection algorithm and therefore provides an alternative 3D reconstruction method to diffraction tomography. The increased resolution provided by this technique will find important applications in imaging smaller organelles such as mitochondria and lysosomes, and in studying light scattering from cells and tissues.
Acknowledgments
This work was funded by the National Institutes of Health (P41-RR02594-18) and Hamamatsu Corporation.
References
- 1.Choi W, Fang-Yen C, Badizadegan K, Oh S, Lue N, Dasari RR, Feld MS. Nat. Methods. 2007;4:717. doi: 10.1038/nmeth1078. [DOI] [PubMed] [Google Scholar]
- 2.Fang-Yen C, Oh S, Park Y, Choi W, Song S, Seung HS, Dasari RR, Feld MS. Opt. Lett. 2007;32:1572. doi: 10.1364/ol.32.001572. [DOI] [PubMed] [Google Scholar]
- 3.Kak AC, Slaney M. Principles of Computerized Tomographic Imaging. 1999 Academic. [Google Scholar]
- 4.Barty A, Nugent KA, Roberts A, Paganin D. Opt. Commun. 2000;175:329. [Google Scholar]
- 5.Charriere F, Pavillon N, Colomb T, Depeursinge C, Heger TJ, Mitchell EAD, Marquet P, Rappaz B. Opt. Express. 2006;14:7005. doi: 10.1364/oe.14.007005. [DOI] [PubMed] [Google Scholar]
- 6.Tsihrintzis GA, Devaney AJ. IEEE Trans. Image Process. 2000;9:1560. doi: 10.1109/83.862637. [DOI] [PubMed] [Google Scholar]
- 7.Creath K. Prog. Opt. 1988;26:349. [Google Scholar]
- 8.Goldstein RM, Zebker HA, Werner CL. Radio Sci. 1988;23:713. [Google Scholar]


