Abstract
The SAP domain from the Saccharomyces cerevisiae THO1 protein contains a hydrophobic core and just two α-helices. It could provide a system for studying protein folding that bridges the gap between studies on isolated helices and those on larger protein domains. We have engineered the SAP domain for protein folding studies by inserting a tryptophan residue into the hydrophobic core (L31W) and solved its structure. The helical regions had a backbone root mean-squared deviation of 0.9 Å from those of wild type. The mutation L31W destabilised wild type by 0.8 ± 0.1 kcal mol−1. The mutant folded in a reversible, apparent two-state manner with a microscopic folding rate constant of around 3700 s−1 and is suitable for extended studies of folding.
Keywords: α-helix, model protein, protein structure, two-helix bundle, two state folding mechanism
Introduction
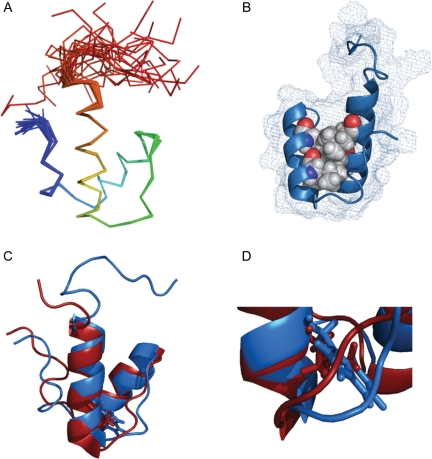
There are extensive studies of the folding kinetics of very small peptides to analyse isolated individual helices (Thompson et al., 1997; Huang et al., 2001; Du et al., 2007) and of three- to five-helix bundles to study protein domains with hydrophobic cores (Munson et al., 1994; Huang and Oas, 1995; Burton et al., 1998; Ferguson et al., 1999, 2005; Kubelka et al., 2003; Mayor et al., 2003; Wang et al., 2003; Jemth et al., 2004; Sato et al., 2004; Horng et al., 2005; Korzhnev et al., 2007; Yang et al., 2008; Wensley et al., 2009). Here we have established a system to bridge the gap between these studies by analysing the folding events of a two-helix bundle, the SAP domain from the THO1 protein from Saccharomyces cerevisiae (PDB accession numbers 1h1j and 2wqg; Fig. 1).
Fig. 1.
Solution structure of L31W SAP domain from THO1. (A) Ensemble of 25 lowest energy structures coloured blue to red, N to C termini. (B) L31W possesses a defined hydrophobic core (filled spheres). The mesh shows the van der Waals' radius surface. (C) Overlay of wild-type (red, PDB ID 1h1j) and L31W pseudo-wild-type (blue, PDB ID 2wqg) structures with residue 31 shown in stick representation. (D) The tryptophan is accommodated by a minor readjustment of the loop at the base of helix 2.
The SAP domain is the only domain identified in the 218 amino acid THO1 protein, where it is found at the N-terminus. While the C-terminal portion of the protein plays a role in the control of transcription elongation by RNA polymerase II (Jimeno et al., 2002, 2006), the role of the N-terminal SAP domain remains unclear. Comparison with homologous proteins (Aravind and Koonin, 2000) suggests that it may be involved in targeting the C-terminal domain to actively transcribed DNA. The SAP domain has a hydrophobic core formed from conserved leucine residues (L13, 17, 31 and 35) and is stable in solution at millimolar concentrations. We introduced a tryptophan fluorophore into the core of the domain to report on kinetic transitions, and conducted equilibrium and kinetic studies to determine its suitability for extended protein folding studies.
Results
Fluorophore probe and solution structure
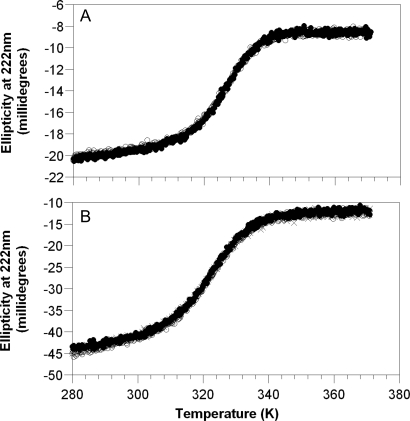
The THO1 SAP domain does not possess an intrinsic tryptophan probe suitable for monitoring the folding kinetics, so we engineered tryptophan residues into various core locations of SAP in order to obtain a suitable, minimally perturbing fluorescence probe. The most suitable mutant to act as a pseudo-wild type was SAP L31W. It expressed in milligram quantities in Escherichia coli and was stable in solution at millimolar concentrations. The equilibrium unfolding of both wild-type and pseudo-wild-type proteins was monitored by CD at 222 nm. Both displayed reversible apparent two-state transitions (Fig. 2). L31W was destabilised by 0.8 ± 0.1 kcal mol−1 relative to the wild-type construct at its midpoint (Table I).
Fig. 2.
Repeat thermal denaturations of SAP domain. Ellipticity measured at 222 nm for (A) wild-type and (B) L31W pseudo-wild-type proteins in 50 mM MES pH 6.0, total ionic strength of 150 mM (wild type) and 500 mM (L31W) made up with NaCl. Initial scan shown in filled circles, repeat scan with open circles and further repeat with crosses (L31W only).
Table I.
Thermal denaturation of wild-type and L31W SAPa
| Wild type | L31W pseudo-wild type | |
|---|---|---|
| Tm (K) | 327.1 ± 0.1 | 320.2 ± 0.3 |
| ΔH at Tm (kcal mol−1) | 40.5 ± 0.6 | 35.0 ± 1.2 |
| ΔΔGD–N at 327 K (kcal mol−1) | N/A | 0.49 ± 0.0 |
aThermal denaturation was carried out in 50 mM MES, pH 6.0, total ionic strength of 150 mM made up with NaCl. Errors displayed are fitting errors.
The solution structure of L31W was determined de novo using NMR spectroscopy (Table II). The domain consists of two α-helices (13 and 14 residues, respectively) connected by a structured loop of five residues. The N-terminal tail, eight residues long, was structured from residue 3 onwards and contained a single turn of α-helix, whereas the C-terminal tail of 11 residues appeared disordered throughout (Fig. 1). The structure of L31W was almost identical to that of the wild type (backbone root mean-squared deviation (RMSD) of 0.9 Å over helices), with minor rearrangement of the loop packing to accommodate the larger residue (Fig. 1C and D), backbone RMSD rising to 1.3 Å over helices and loop). This structure was consistent with the alignment tensor calculated from measured residual dipolar couplings (RDCs) of the amide bond (correlation coefficient of 0.93 for ordered regions where S2 > 0.8, 0.90 over helices and loop, 0.93 over helices only).
Table II.
Statistics for L31W solution structure calculationa
| Structural constraints | |
| Intra-residue NOEs | 385 |
| Sequential NOEs | 237 |
| Medium-range NOEs (1.8 < |i–j| < 5.0 Å) | 227 |
| Long-range NOEs | 165 |
| Dihedral angle restraints | 58 |
| Hydrogen bonds | 48 |
| Total | 1130 |
| RMSD from restraints (±SD) | |
| Distance restraints (Å) | 0.013 (±0.001) |
| Dihedral restraints (deg) | 0.39 (±0.04) |
| CNS energies (±SD) | |
| Eoverall (kcal mol−1) | 95 (±8) |
| Evdw (kcal mol−1) | 39 (±3) |
| ENOE (kcal mol−1) | 13 (±3) |
| Edihedral (kcal mol−1) | 30 (±1) |
| RMSD from ideal geometry (±SD) | |
| Bond lengths (Å) | 0.00 (±0.00) |
| Bond angles (deg) | 0.39 (±0.02) |
| Improper angles (deg) | 0.26 (±0.02) |
| RMSD from ensemble meanb | |
| Backbone (Å) | 0.149 |
| All heavy atoms (Å) | 0.562 |
| Ramachandran statistics | |
| Favourable regions (%) | 82 |
| Allowed regions (%) | 96 |
| Generously allowed regions (%) | 99 |
| Disallowed regions (%)c | 1 |
aThe structure was solved in 50 mM MES, pH 6.0, total ionic strength of 500 mM made up with NaCl, at 283 K.
bResidues 4–41.
cResidue 23 lies just outside the cutoff for region ∼ b in a number of ensemble members.
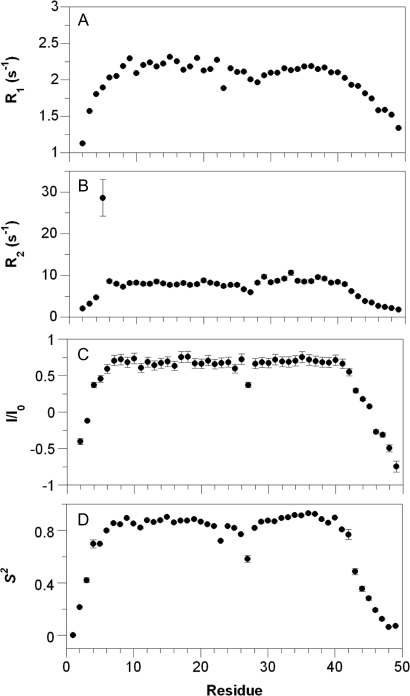
Backbone dynamics of the amide vector was measured to probe the mobility of L31W (Fig. 3A–C. Formal analysis of the measured rates using the program Tensor2 (http://eva.ibs.fr/ext/labos/LRMN/softs/) to calculate the order parameter, S2, confirmed that the helices and most of the connecting loop are ordered (S2 > 0.8, Fig. 3D). Overall, the similarity between the solution structure of SAP L31W and that of the wild-type protein showed that the mutant would be a suitable pseudo-wild-type protein for folding studies.
Fig. 3.
Backbone dynamics and order in L31W. (A) Longitudinal, (B) transverse relaxation times and (C) heteronuclear NOE enhancement for L31W. Errors are set to 10% of measured value, which is consistent with the error from five repeat measurements of R2 relaxation rate constants. (D) Order parameter for L31W. The order parameter reports on the proportion of the measured relaxation, which can be attributed to global motion. A value of S2 = 1 indicates that relaxation is due to global motion alone; if S2 = 0, relaxation is due to only internal motion. Errors shown are fitting errors. The anomalously low value for L27 in all four panels is an artefact due to overlap of the HSQC peak with that of D4.
Tuning the stability of L31W
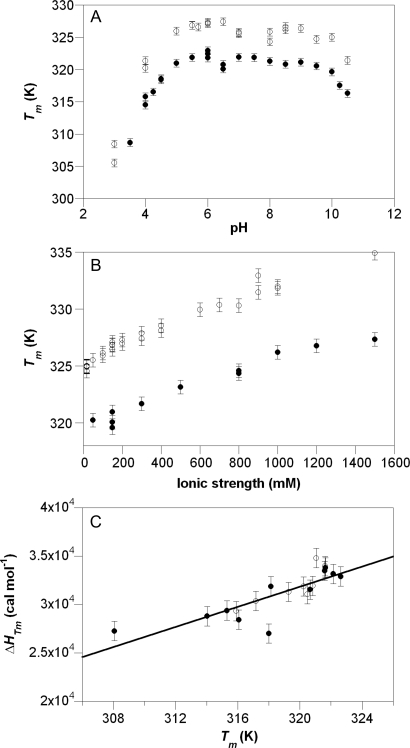
We determined whether variations in the ionic strength or pH modulated the stability of SAP L31W (Fig. 4A and B, filled circles) in order to identify the optimal conditions for in vitro studies of protein folding reactions (Ferguson and Fersht, 2008). Ideally, such studies should be performed under conditions where the protein stability is independent of small changes in pH, so that changes in pH with temperature (arising from non-zero ionisation enthalpies for buffers) or batch-to-batch variation in reagents have negligible effects.
Fig. 4.
Biophysical characterisation of the SAP domain. (A) pH and (B) ionic strength dependency of stability for L31W (filled circles) and wild-type SAP (open circles). pH buffers were 50 mM buffer salts, total ionic strength of 500 mM (L31W) and 150 mM (wild type) made up with NaCl, ionic strength was made up to stated value with NaCl in 50 mM MES, pH 6.0. Error bars show a fixed error of 0.6 K (three standard deviations (SD) of an estimated error of 0.2 K). (C) Determination of ΔCp for L31W using acid (filled circles) and base (open circles) perturbation of L31W. The intrinsic error of the measurement of ΔH was greater than the error introduced by non-zero total ionisations, so points from basic perturbation of SAP were included in the overall fit in order to increase the precision of ΔCp determination. The slope of the fitted line is 520 cal mol−1 K−1 and the error bars are set to 1 kcal mol−1.
L31W had near constant stability between pH 5.5 and 9.5 in thermal denaturation studies. However, SAP L31W had a marked increase in stability with increasing [NaCl] from 150 mM to 1.5 M, at pH 6.0 most likely resulting from an increasing screening of surface charge clusters. We tuned the stability of L31W by varying the [NaCl] to optimise the definition of baselines within the experimentally accessible window in order to aid curve fitting. We used urea for chemical denaturation studies as it does not affect the ionic strength.
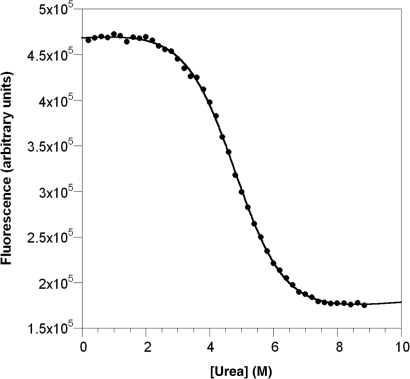
Increasing the ionic strength from 150 to 500 mM with NaCl stabilised the construct by 0.6 kcal mol−1 and when combined with a reduction in temperature from 298 to 283 K resulted in an overall increase in the L31W stability of 1.1 kcal mol−1. Urea denaturation of L31W at 283 K in this optimised buffer gave data with well-defined baselines (Fig. 5 for example curve). Five repeat denaturations, each monitored at 100 single wavelengths (see Materials and methods for exact averaging procedure), yielded an average midpoint, D50, of 4.8 ± 0.1 M urea and an m-value,  , of 700 ± 60 cal mol−1 M−1 (standard error from replicates).
Fig. 5.
Chemical denaturation of L31W under optimised conditions of 50 mM MES, pH 6.0, total ionic strength of 500 mM made up to stated value with NaCl, at 283 K.
The apparent ΔCp of denaturation (the difference in the heat capacity between native and denatured states) for L31W was determined from a plot of ΔH versus Tm determined by measuring thermal denaturation as a function of solvent pH (Privalov, 1979). Since ΔCp is a constant parameter in the fitting of thermal transitions, we used an iterative process of fitting transitions and plotting ΔH versus Tm until there was no further change (Fig. 4C). The value so determined was 520 ± 40 cal mol−1 K−1 (errors using a ‘jack-knifing’ procedure of deleting each value in turn and refitting the data in its absence). This value was similar to that estimated using the method of Myers et al. (1995) assuming 14 cal mol−1 per residue but using only the number of ordered residues (calculated ΔCp of 532 cal mol−1 K−1).
SAP domain folding and unfolding kinetics
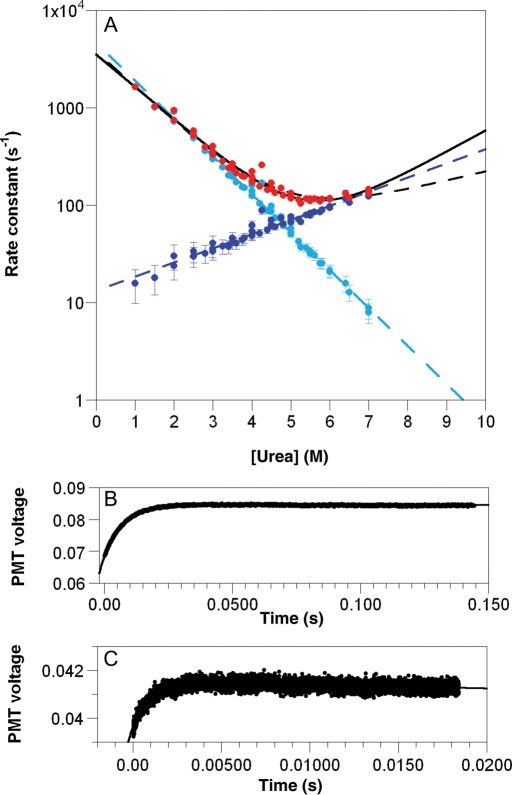
Temperature-jump measurements of the folding kinetics of L31W in different concentrations of urea yielded linear arms in chevron plots of logarithm of observed rate constant versus concentration of chemical denaturant (Fig. 6). The curves were deconvolved in three ways: the most widely used ‘unconstrained’ fit where all parameters are allowed to float freely (Jackson and Fersht, 1991), a ‘constrained’ fit where the reference urea concentration is the denaturation midpoint (determined from equilibrium measurements and thus constrained in the kinetic fit) (Ferguson et al., 2005, 2006) and constraining using the equilibrium constant, Keq, determined from equilibrium measurements (Ferguson et al., 2006). All three methods yielded excellent fits to the data of the folding limb, whereas the unfolding limb at higher [urea] was not fitted as well (Table III). The poorer fitting results from the difficulties inherent in measuring outside the transition region by perturbation kinetics and for a protein with a late transition state that has a low mu value. The small variation in rate constant at high concentrations of urea gives large errors on the midpoint of the curve fitted purely on kinetic data,  . Constraining the fits by using independently determined values of KD–N or D50 at equilibrium gives more reliable values of mu.
Fig. 6.
(A) Chevron plot for L31W in 50 mM MES, pH 6.0, total ionic strength of 500 mM made up with NaCl, at 283 K. The observed rate constant is shown in red with error bars showing fitting error on each rate constant. Unconstrained fit (solid line) and fit constrained by equilibrium D50 (black dashed line) are shown. Deconvolution of the observed rate constant into kf (light blue) and ku (dark blue) using Keq derived from equilibrium measurements is shown together with respective fits (light and dark blue dashed lines). Error bars on deconvolved values are propagated errors. (B) Representative transient measured at the centre of chevron (5.0 M urea). (C) Representative transient measured at the edge of chevron (1.5 M urea). Fits to a single exponential shown.
Table III.
Kinetic data for folding and unfolding of SAP L31W
| Fit constrained using equilibrium Keqa | Fit constrained using equilibrium D50a | Unconstrained fita | |
|---|---|---|---|
| mf (cal mol−1 M−1) | 460 ± 10 | 410 ± 10 | 430 ± 20 |
| mu (cal mol−1 M−1) | 180 ± 10 | 120 ± 40 | 280 ± 110 |
 (s−1) (s−1) |
3710 ± 120 | 3680 ± 360 | 3530 ± 150 |
 (s−1) (s−1) |
15 ± 1 | 26 ± 9 | 4 ± 5 |
| k50 (s−1)b | 80 ± 10 | 70 ± 0 | 90 ± 10 |
| mtot (cal mol−1 M−1)c | 630 ± 10 | 580 ± 40 | 720 ± 110 |
| D50 (M) | 4.9 ± 0.1 | 4.8 ± 0.1d | 5.4 ± 1.4 |
 (kcal mol−1) (kcal mol−1) |
3.1 ± 0.0 | 2.8 ± 0.2 | 3.8 ± 0.7 |
aNon-italicised quantities are parameters derived directly from the curve-fitting expression. Italicised quantities are calculated from these. Errors are fitting errors (or errors propagated from these).
bk50 is the microscopic rate constant at the midpoint, i.e. at k50, kf = ku (=k50).
cmtot = mf + mu.
dD50 for constrained fit is determined by equilibrium denaturation.
The chemically denatured state of THO1 L31W appeared random-coil-like
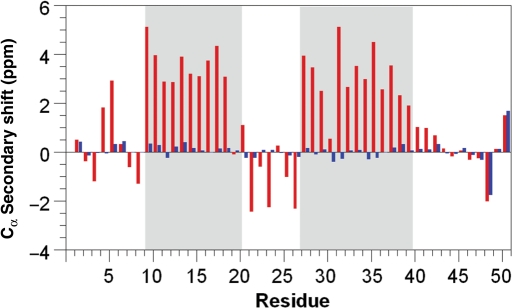
The Cα secondary shifts (the difference between the measured chemical shift and the expected random coil value) of L31W were measured in 8 M urea to provide an indication of structure in non-native states (Williamson, 1990; Wishart et al., 1991; Mittag and Forman-Kay, 2007). Regions of positive secondary shifts measured for the native state correlated well with the determined helices and are destroyed in the presence of urea (Fig. 7). Thus, the Cα chemical shifts for all residues in the urea-denatured state are close to those expected in a random coil and did not provide any evidence of residual structure upon denaturation.
Fig. 7.
Cα secondary shifts for L31W in 0 M (red) and 8 M (blue) urea. Shading indicates boundaries of helices determined from final structure. Apparent large values in the denatured state can be rationalised as the C-terminal residue (Q51) and the residue immediately preceding a proline (S49), which is expected to show a negative offset of 1–2 ppm.
Discussion
L31W as a paradigm two-helix protein
SAP L31W is a suitable system for studying the folding of two-helix bundle proteins. The SAP domain was monomeric at up to millimolar concentrations as determined by NMR measurements of both wild-type and pseudo-wild-type proteins (C.A. Dodson, T.J. Rutherford and J.O.B. Jacobsen, unpublished results). SAP L31W denatured reversibly without aggregation and the equilibrium unfolding transition fitted well within the experimentally accessible window (0–10 M urea, 275–371 K) and multiple repeats of thermal denaturation of both wild-type and pseudo-wild-type SAP domains superimposed (Fig. 2). There was also a wide pH range (Fig. 4A, filled circles) in which the folding and unfolding reactions of SAP L31W were well defined using equilibrium and kinetic biophysical methods.
The tryptophan residue inserted into the core of wild-type SAP domain at position 31 minimally perturbed its structure (Fig. 1). The fluorescence reported on the conformational state of the protein. The presence of the tryptophan did not alter its major biophysical properties (the stability of both wild-type and pseudo-wild-type proteins showed the same pH and ionic strength dependencies–Fig. 4A and B, filled and open circles, respectively).
The chemical denaturation curves of L31W were well defined with good baselines for native and denatured regions under all conditions, apart from the native state at low ionic strength. Addition of NaCl tuned the stability of L31W so that under optimised conditions both native and denatured baselines were well defined (Fig. 5). In this way, the ionic strength dependence of the stability of L31W can be exploited, making future Φ-value analysis possible. This is fortunate, since the best mutations for Φ-value analysis are often destabilising and thus have truncated pre-transition baselines compared with the wild-type protein. The acquisition of accurate stability measurements for marginally stable small proteins is complicated as over-truncation impinges on the precision of the thermodynamic parameters determined by curve fitting.
L31W displayed simple folding kinetics
Kinetic transients for L31W were monophasic and the observed rate constants displayed a classic chevron plot with linear arms (Fig. 6). Measurement of L31W kinetics on longer timescales or using laser T-jump apparatus (capable of measuring nano-second kinetics) gave a trace with single exponential decays and no evidence of phases faster or slower than those measured here.
Both the kinetic midpoint,  (the [urea] at k50 where kf = ku), and the total m-value, mtot (=mf + mu), determined from unconstrained fits were in agreement with the equilibrium measurements (Table III compared with D50 and meq from urea denaturation—parameters in main text above), although the propagated error in
  was large, which is inherent in studies on proteins with low values of mu.
L31W is a paradigm for two-helix bundle protein folding studies
L31W is one of the simplest naturally occurring protein domains possible and can be considered either as two helices oriented by a connecting loop or a small hydrophobic core being protected from solvent by essentially only a single layer of solvating residues. This minimal composition bridges the divide between studies of isolated elements of secondary structure, which focus on local interactions, and larger globular domains where long-range forces may dominate. L31W is a suitable model protein for extensive studies on folding including Φ-value analysis.
Materials and methods
Reagents
Wild-type SAP domain (GSADYSSLTVVQLKDLLTKRNLSVGGLKNELVQRLIKDDEESKGESEVSPQ) and L31W mutant were over-expressed in E. coli C41 cells as His-tagged, C-terminal fusion proteins. Unlabelled recombinant proteins were expressed in 2×TY rich media, whereas isotopically enriched samples for NMR experiments were expressed in a modified K-Mops medium (Sattler et al., 1999) using 0.1% (w/v) [15 N]ammonium chloride and 0.4% (w/v) [U-13C]glucose (Cambridge Isotopes Laboratories, Andover, MA) as the sole N and C sources. The wild-type plasmid (a derivative of pRSETa) was the kind gift of Dr Mark Bycroft (MRC Centre for Protein Engineering) and the L31W mutant was generated from this by the Stratagene Quikchange mutagenesis procedure. Fused proteins were isolated from clarified cell lysate by Ni-charged IMAC resin (GE Healthcare BioSciences, Sweden). SAP domain was cleaved from fusion protein with a protease cleavage at 37°C for 3 h using ∼100 units of bovine plasma thrombin (Sigma, UK). After cleavage, the SAP domains were purified to homogeneity using ion exchange (6 mL Resource S column; GE Healthcare BioSciences, Sweden) and reverse phase chromatography (0–50% (v/v) acetonitrile gradient, 0.1% (v/v) trifluoroacetic acid using a C4 column). Proteins were lyophilised to remove volatile solvents. The identity and mass of purified proteins were confirmed by SDS–PAGE and matrix-assisted laser desorption ionisation mass spectrometry. All reagents were purchased from Sigma (Sigma-Aldrich Corp., St Louis, MO), BDH or Fisher Scientific and most were AnalaR grade or higher, with the exception of ultrapure urea that was purchased from MP Biomedicals.
Buffers
All experiments were measured in 50 mM buffer salts with the ionic strength adjusted to the stated value using NaCl. Water with resistivity of 18 MΩ cm was used for dilution of all reagents, and urea concentrations were accurately determined using a refractometer. Buffers used were 50 mM Na formate (pH 3.5–4), Na acetate (pH 4–5.5), MES (pH 6–6.5), Na phosphate (pH 7–8.5) and ethanolamine (pH 9–10.5) with ionic strengths corrected to 500 mM using NaCl. For studies on the effects of ionic strength we used 50 mM MES pH 6.0 with ionic strength adjusted to the stated value with NaCl. The buffer used for the final studies under optimised conditions was 50 mM MES pH 6.0, with the ionic strength adjusted to 500 mM with NaCl, at 283 K where appropriate.
NMR spectroscopy
NMR spectra were acquired at 283 K on Bruker DRX 500 or AVANCE 800 spectrometers equipped with 5 mm inverse detection triple resonance probes. 1H–15N heteronuclear single quantum coherence (HSQC), 1H—13C HSQC, HNCACB, CBCA(CO)NH, HN(CA)CO and HNCO spectra were acquired for backbone assignments (Neri et al., 1989; Johnson et al., 1996). These spectra were augmented by H(CCCO)NH homonuclear 2D TOCSY (55 ms MLEV-17 spin-lock in 7.1 kHz B1 field), 2D NOESY (120 ms τm) and DQF-COSY spectra to obtain side-chain assignments and distance restraints. Methyl resonances of valine and leucine residues were assigned stereospecifically from the sign of correlations in a constant-time 1H–13C-HSQC obtained for fractionally (10%) 13C-labelled THO1 (Delaglio et al., 1995). Chemical shifts were referenced to external 3-trimethylsilylpropanesulphonic acid. All data were processed in NMRPipe (Wuthrich, 1986; Bax, 1994), and analysed in the program Sparky (T.D. Goddard and D.G. Kneller, SPARKY 3, University of California, San Francisco, CA). Assignment of backbone and side-chain resonances, followed by assignment of cross-peaks in the 2D 1H–1H NOESY spectrum, proceeded by standard methods (McDonald and Thornton, 1994). Hydrogen-bond donor amide groups were identified from the slowly exchanging peaks in H–D exchange experiments. 1H–15N HSQC spectra were recorded after dissolving lyophilised protein-buffered deuterium oxide. Cognate hydrogen bond acceptors were identified by manual inspection of structures and the program hbplus (Cornilescu et al., 1999).
The input to iterative rounds of structure calculations comprised, in order of inclusion, Nuclear Overhauses Effect (NOE) intensity-derived distance restraints in four categories (corresponding to inter-proton distance constraints of 1.8–2.7, 1.8–3.3, 1.8–5.0 and 1.8–7.0 Å), side-chain torsion angle restraints obtained from stereo-specific assignments, π and φ angle restraints obtained from secondary shifts of backbone resonances using the program TALOS (Stein et al., 1997) and fixed hydrogen bond distance constraints. Structures were calculated using a standard torsion angle-simulated annealing protocol (Brunger et al., 1998) in the program CNS (Nicholson and Scholtz, 1996).
1DNH RDCs were measured by TROSY and IPAP-HSQC sequences in micelles formed from 5% (w/v) aqueous C8E5 polyethyleneglycol/octanol (Ottiger et al., 1998; Ruckert and Otting, 2000). 15N T1 values were obtained from 13 standard inversion-recovery HSQC spectra, varying the relaxation delays between 4 ms and 1.6 s. 15N T2 values were obtained from 12 HSQC spectra modified with a CPMG sequence of 180° pulses of 6.3 kHz B1, repeating at 800 µs intervals. CPMG mixing times ranged from 14 to 350 ms. [1H]15N-NOE spectra were acquired with 3 s 1H saturation (120° pulses of 7 kHz B1 at 30 ms intervals) and 7 s relaxation delay. Peak intensities and rate constants were analysed using the Sparky software package.
Equilibrium thermal denaturation
Far-UV CD spectroscopy or differential scanning calorimetry (DSC) was used to measure the thermal denaturation of wild-type and pseudo-wild-type proteins. For all measurements except the ionic strength dependence of wild-type SAP domain, the change in differential absorbance at 222 nm was measured using a Jasco J-720 or J-815 spectrapolarimeter (Jasco Inc., Easton, MD) with temperature controlled by a Peltier unit. Samples generally contained 50 µM protein and were measured in a 1 mm pathlength cuvette. Samples were heated from 280 to 360 K using a scan rate of 60 K/h and data were fit a two-state transition (Pace, 1986; Jackson and Fersht, 1991). The change in the heat capacity (ΔCp) was used as a constrained parameter (ΔCp = 520 cal mol−1). The thermal stability of wild-type SAP domain on varying ionic strength was measured using a VP-Capillary DSC (MicroCal/G E Healthcare). Samples containing 300 µM protein were heated at a scan rate of 120 K/h between 2 and 115°C and the resulting transitions fitted using the MicroCal Origin software supplied with the instrument.
Equilibrium chemical denaturation
Equilibrium chemical denaturation was monitored by fluorescence emission between 300 and 400 nm using either a PTI QuantaMaster fluorimeter (West Sussex, UK) or a 320 nm cut-off filter on an Aviv 215SF spectrometer. The sample block temperature was controlled using a Peltier unit and a thermocouple used to ensure that the final sample temperature in the cuvette was correct. Excitation was at 280 nm. Solutions of varying concentrations of urea were used for equilibrium denaturation. For curves measured under optimised conditions, all 100 single-wavelength measurements were independently fitted to two-state transitions to determine both the m-value (∂ΔGD–N/∂ [urea]) and denaturation midpoint (D50). Those with fitting errors greater than ∼10% were discarded and the remainder averaged, the averaging weighted according to the goodness of fit (fitting error). Results from fitting in this manner were very similar to those from globally fitting all data to a single m-value and D50 and also to fits of the wavelengths showing greatest amplitude over the denaturation.
Kinetic measurements
We measured relaxation kinetics on the microsecond to millisecond timescale using T-jump fluorescence spectroscopy. Temperature jumps of 3–5 K were used to induce the resistive heating on a modified Hi-Tech PTJ-64 (Hi-Tech Ltd., Sailisbury, UK) capacitor-discharge, T-jump apparatus. Filtered solutions were degassed, with stirring, for ∼10 min before kinetic measurements. We acquired and averaged between 8 and 256 traces at each concentration of denaturant measured in order to obtain similar signal-to-noise for reactions with different relaxation amplitudes. Data corresponding to the instrumental rise-time were removed prior to curve fitting and the transients were well described by single-exponential functions under all conditions.
Acknowledgement
Spectral acquisition of L31W in 8 M urea was very kindly carried out by Stefan Freund (MRC Centre for Protein Engineering).
Footnotes
Edited by Valerie Daggett
Funding
Medical Research Council, UK.
References
- Aravind L., Koonin E.V. Trends Biochem. Sci. 2000;25:112–114. doi: 10.1016/s0968-0004(99)01537-6. [DOI] [PubMed] [Google Scholar]
- Bax A. Curr. Opin. Struct. Biol. 1994;4:738–744. [Google Scholar]
- Brunger A.T., et al. Acta Crystallogr. D Biol. Crystallogr. 1998;54:905–921. doi: 10.1107/s0907444998003254. [DOI] [PubMed] [Google Scholar]
- Burton R.E., Myers J.K., Oas T.G. Biochemistry. 1998;37:5337–5343. doi: 10.1021/bi980245c. [DOI] [PubMed] [Google Scholar]
- Cornilescu G., Delaglio F., Bax A. J. Biomol. NMR. 1999;13:289–302. doi: 10.1023/a:1008392405740. [DOI] [PubMed] [Google Scholar]
- Delaglio F., Grzesiek S., Vuister G.W., Zhu G., Pfeifer J., Bax A. J. Biomol. NMR. 1995;6:277–293. doi: 10.1007/BF00197809. [DOI] [PubMed] [Google Scholar]
- Du D., Bunagan M.R., Gai F. Biophys. J. 2007;93:4076–4082. doi: 10.1529/biophysj.107.108548. [DOI] [PMC free article] [PubMed] [Google Scholar]
- Ferguson N., Fersht A. In: Protein Engineering Handbook. Lutz S., Theo U., editors. Wiley-VCH Verlag GmbH; 2008. pp. 81–120. [Google Scholar]
- Ferguson N., Capaldi A.P., James R., Kleanthous C., Radford S.E. J. Mol. Biol. 1999;286:1597–1608. doi: 10.1006/jmbi.1998.2548. [DOI] [PubMed] [Google Scholar]
- Ferguson N., Sharpe T.D., Schartau P.J., Sato S., Allen M.D., Johnson C.M., Rutherford T.J., Fersht A.R. J. Mol. Biol. 2005;353:427–446. doi: 10.1016/j.jmb.2005.08.031. [DOI] [PubMed] [Google Scholar]
- Ferguson N., Sharpe T.D., Johnson C.M., Fersht A.R. J. Mol. Biol. 2006;356:1237–1247. doi: 10.1016/j.jmb.2005.12.016. [DOI] [PubMed] [Google Scholar]
- Guntert P., Salzmann M., Braun D., Wuthrich K. J. Biomol. NMR. 2000;18:129–137. doi: 10.1023/a:1008318805889. [DOI] [PubMed] [Google Scholar]
- Horng J.C., Tracz S.M., Lumb K.J., Raleigh D.P. Biochemistry. 2005;44:627–634. doi: 10.1021/bi048852p. [DOI] [PubMed] [Google Scholar]
- Huang G.S., Oas T.G. Proc. Natl Acad. Sci. USA. 1995;92:6878–6882. doi: 10.1073/pnas.92.15.6878. [DOI] [PMC free article] [PubMed] [Google Scholar]
- Huang C.Y., Klemke J.W., Getahun Z., DeGrado W.F., Gai F. J. Am. Chem. Soc. 2001;123:9235–9238. doi: 10.1021/ja0158814. [DOI] [PubMed] [Google Scholar]
- Jackson S.E., Fersht A.R. Biochemistry. 1991;30:10428–10435. doi: 10.1021/bi00107a010. [DOI] [PubMed] [Google Scholar]
- Jemth P., Gianni S., Day R., Li B., Johnson C.M., Daggett V., Fersht A.R. Proc. Natl Acad. Sci. USA. 2004;101:6450–6455. doi: 10.1073/pnas.0401732101. [DOI] [PMC free article] [PubMed] [Google Scholar]
- Jimeno S., Rondon A.G., Luna R., Aguilera A. EMBO J. 2002;21:3526–3535. doi: 10.1093/emboj/cdf335. [DOI] [PMC free article] [PubMed] [Google Scholar]
- Jimeno S., Luna R., Garcia-Rubio M., Aguilera A. Mol. Cell. Biol. 2006;26:4387–4398. doi: 10.1128/MCB.00234-06. [DOI] [PMC free article] [PubMed] [Google Scholar]
- Johnson P.E., Joshi M.D., Tomme P., Kilburn D.G., McIntosh L.P. Biochemistry. 1996;35:14381–14394. doi: 10.1021/bi961612s. [DOI] [PubMed] [Google Scholar]
- Korzhnev D.M., Religa T.L., Lundstrom P., Fersht A.R., Kay L.E. J. Mol. Biol. 2007;372:497–512. doi: 10.1016/j.jmb.2007.06.012. [DOI] [PubMed] [Google Scholar]
- Kubelka J., Eaton W.A., Hofrichter J. J. Mol. Biol. 2003;329:625–630. doi: 10.1016/s0022-2836(03)00519-9. [DOI] [PubMed] [Google Scholar]
- Mayor U., Guydosh N.R., Johnson C.M., Grossmann J.G., Sato S., Jas G.S., Freund S.M., Alonso D.O., Daggett V., Fersht A.R. Nature. 2003;421:863–867. doi: 10.1038/nature01428. [DOI] [PubMed] [Google Scholar]
- McDonald I.K., Thornton J.M. J. Mol. Biol. 1994;238:777–793. doi: 10.1006/jmbi.1994.1334. [DOI] [PubMed] [Google Scholar]
- Mittag T., Forman-Kay J.D. Curr. Opin. Struct. Biol. 2007;17:3–14. doi: 10.1016/j.sbi.2007.01.009. [DOI] [PubMed] [Google Scholar]
- Munson M., O'Brien R., Sturtevant J.M., Regan L. Protein Sci. 1994;3:2015–2022. doi: 10.1002/pro.5560031114. [DOI] [PMC free article] [PubMed] [Google Scholar]
- Myers J.K., Pace C.N., Scholtz J.M. Protein Sci. 1995;4:2138–2148. doi: 10.1002/pro.5560041020. [DOI] [PMC free article] [PubMed] [Google Scholar]
- Neri D., Szyperski T., Otting G., Senn H., Wuthrich K. Biochemistry. 1989;28:7510–7516. doi: 10.1021/bi00445a003. [DOI] [PubMed] [Google Scholar]
- Nicholson E.M., Scholtz J.M. Biochemistry. 1996;35:11369–11378. doi: 10.1021/bi960863y. [DOI] [PubMed] [Google Scholar]
- Ottiger M., Delaglio F., Bax A. J. Magn. Reson. 1998;131:373–378. doi: 10.1006/jmre.1998.1361. [DOI] [PubMed] [Google Scholar]
- Pace C.N. Methods Enzymol. 1986;131:266–280. doi: 10.1016/0076-6879(86)31045-0. [DOI] [PubMed] [Google Scholar]
- Privalov P.L. Adv. Protein Chem. 1979;33:167–241. doi: 10.1016/s0065-3233(08)60460-x. [DOI] [PubMed] [Google Scholar]
- Ruckert M., Otting G. J. Am. Chem. Soc. 2000;122:7793–7797. [Google Scholar]
- Sato S., Religa T.L., Daggett V., Fersht A.R. Proc. Natl Acad. Sci. USA. 2004;101:6952–6956. doi: 10.1073/pnas.0401396101. [DOI] [PMC free article] [PubMed] [Google Scholar]
- Sattler M., Schleucher J., Griesinger C. Prog. Nucl. Mag. Reson. Spectrosc. 1999;34:93–158. [Google Scholar]
- Stein E.G., Rice L.M., Brunger A.T. J. Magn. Reson. 1997;124:154–164. doi: 10.1006/jmre.1996.1027. [DOI] [PubMed] [Google Scholar]
- Thompson P.A., Eaton W.A., Hofrichter J. Biochemistry. 1997;36:9200–9210. doi: 10.1021/bi9704764. [DOI] [PubMed] [Google Scholar]
- Wang M., Tang Y., Sato S., Vugmeyster L., McKnight C.J., Raleigh D.P. J. Am. Chem. Soc. 2003;125:6032–6033. doi: 10.1021/ja028752b. [DOI] [PubMed] [Google Scholar]
- Wensley B.G., Gartner M., Choo W.X., Batey S., Clarke J. J. Mol. Biol. 2009;390:1074–1085. doi: 10.1016/j.jmb.2009.05.010. [DOI] [PMC free article] [PubMed] [Google Scholar]
- Williamson M.P. Biopolymers. 1990;29:1423–1431. doi: 10.1002/bip.360291009. [DOI] [PubMed] [Google Scholar]
- Wishart D.S., Sykes B.D., Richards F.M. J. Mol. Biol. 1991;222:311–333. doi: 10.1016/0022-2836(91)90214-q. [DOI] [PubMed] [Google Scholar]
- Wuthrich K. NMR of Proteins and Nucleic Acids. New York: Wiley; 1986. [Google Scholar]
- Yang J.S., Wallin S., Shakhnovich E.I. Proc. Natl Acad. Sci. USA. 2008;105:895–900. doi: 10.1073/pnas.0707284105. [DOI] [PMC free article] [PubMed] [Google Scholar]


