

Abstract
Mice infected with the neurotropic JHM strain of mouse hepatitis virus (JHMV) develop acute and chronic demyelinating diseases with histopathological similarities to MS. The process of demyelination is largely immune-mediated, as immunodeficient mice (RAG1−/− mice) do not develop demyelination upon infection; however, demyelination develops if these mice are reconstituted with either JHMV-immune CD4 or CD8 T cells. Since myelin destruction is a consequence of the inflammatory response associated with virus clearance, we reasoned that decreasing the amount of inflammation would diminish clinical disease and demyelination. Given that regulatory T cells (Tregs) have potent anti-inflammatory effects, we adoptively transferred Tregs into infected C57BL/6 and RAG1−/− mice. In both instances, transfer of Tregs decreased weight loss, clinical scores and demyelination. Transferred Tregs were not detected in the CNS of infected RAG1−/− mice, but rather appeared to mediate their effects in the draining cervical lymph nodes. We show that Tregs dampen the inflammatory response mediated by transferred JHMV-immune splenocytes in infected RAG1−/− mice by decreasing T cell proliferation, dendritic cell activation and pro-inflammatory cytokine/chemokine production, without inducing apoptosis. By extension, decreasing inflammation, whether by Treg transfer or by otherwise enhancing the anti-inflammatory milieu, could contribute to improved clinical outcomes in patients with virus-induced demyelination.
Introduction
Viral infections in the central nervous system (CNS) involve a delicate balance between host immune pro-inflammatory and anti-inflammatory factors. A rapid and robust immune response will help to clear the virus, while an appropriate anti-inflammatory response will minimize any immunopathology. Examples of anti-inflammatory mediators include IL-10, TGFβ and natural and adaptive Tregs, characterized by the surface expression of CD4+CD25+ and intracellular expression of Foxp3 (1-3). Most studies of Tregs in the context of viral infections have focused on their role in chronic disease (4). In mice persistently infected with viruses such as Friend virus, Tregs dampen immune responses, preventing immunopathology (5). However, virus persistence is a consequence of their action, and abrogation of Treg function enhances virus clearance. More recently, other studies showed a key role for these cells during the early stages of the inflammatory process. In mice infected with herpes simplex virus (HSV-2) Tregs are critical for ingress of inflammatory cells into sites of infection. In their absence, inflammatory cells do not exit draining lymph nodes, leading to impaired antigen clearance and enhanced disease severity (6). Similar results were obtained after Treg depletion in mice infected with respiratory syncytial virus (7).
Tregs have been shown to function at sites of inflammation, directly inhibiting T cell function and in draining lymph nodes, suppressing dendritic cell (DC) function. Tregs suppress effector T cell function via multiple mechanisms, including expression of suppressor cytokines such as IL-35, TGF-β and IL-10, IL-2 consumption, direct T cell destruction, CD39/CD73-mediated generation of the inhibitory molecule, adenosine, and surface expression or secretion of suppressive molecules such as galectin-1. Tregs inhibit DC function by a variety of mechanisms including CTLA-4/CD80/86 engagement, CD39-mediated ATP hydrolysis, induction of suppressive factors such as indoleamine 2,3-dioxygenase (IDO) and LAG-3 expression, which inhibits DC maturation (reviewed in (8-10)). The relative importance of each of these inhibitory molecules in mediating Treg function is likely pathogen-dependent and will depend in part on whether Tregs function at sites of inflammation or in draining lymph nodes (2).
Mice infected with neurotropic strains of mouse hepatitis virus (MHV), develop acute and chronic neurological infections (11-13). Susceptible strains of mice infected with the neurovirulent JHMV strain rapidly succumb to acute encephalitis whereas infection with an attenuated JHMV variant, J2.2-V-1, results in a chronic demyelinating encephalomyelitis. Viral antigen, but not infectious virus, can be detected in infected spinal cords for at least 70 days (11, 14). The disease is largely immunopathological, with demyelination occurring as a consequence of virus clearance. In support of this, demyelination does not occur in J2.2-V-1-infected immunodeficient mice: sublethally irradiated, SCID (severe combined immunodeficiency) or RAG1−/− (recombination activation gene 1) (15-17). However, transfer of splenocytes from JHMV-immune mice to J2.2-V-1-infected RAG1−/− or SCID mice results in demyelination occurring within 7 days (15, 17). Either CD4 or CD8 T cells, in the absence of the other subset are able to mediate demyelination (18, 19) and in both instances, macrophages and microglia are the final effector cells (20, 21).
Previously, we showed that adoptive transfer of natural Tregs to mice infected with a recombinant form of neurovirulent JHMV (rJ) decreased mortality from 100% to 50% (22). Additionally, depletion of Tregs prior to infection with an attenuated JHMV variant resulted in increased mortality and morbidity. These studies did not distinguish an effect of Tregs on priming versus the effector stage of the infection nor did they identify the downstream effects of Treg activity. Such analyses were hindered by the rapid disease course that occurs in rJ-infected mice.
The prolonged disease course observed after J2-2-V-1 infection facilitates such studies and also makes possible investigations of Tregs in the context of virus-induced demyelination. A relative paucity of functional Tregs is implicated in autoimmune diseases, including experimental autoimmune encephalomyelitis and multiple sclerosis (23-27). Tregs are present at abnormally low levels in the blood of MS patients and adoptive transfer of these cells into patients with MS has been suggested as a therapeutic option (28-30). However, it is not known in the context of virus-induced demyelination whether regulatory T cells contribute to disease severity by prolonging virus persistence or are beneficial by minimizing the immunopathological disease that occurs during the process of virus clearance. Here, using J2.2-V-1-infected C57BL/6 (B6) and RAG1−/− mice, we showed that adoptive transfer of Tregs decreased weight loss, clinical disease, and demyelination. In addition, using J2.2-V-1-infected RAG1−/− mice, we present evidence that Tregs function by suppressing T cell proliferation and inflammatory cytokine/chemokine production, thereby reducing the anti-virus T cell response.
Materials and Methods
Animals
Six week old specific pathogen-free B6 mice (Thy1.2) were purchased from the National Cancer Institute (Bethesda, MD) and RAG1−/− mice were purchased from The Jackson Laboratory (Bar Harbor, ME). Foxp3-GFP mice were kindly provided by A. Rudensky (Sloan-Kettering Institute, NY, NY) and bred onto a Thy1.1 background. After viral inoculation, mice were examined and weighed daily. Clinical evaluation was based on the following scoring system: 0, asymptomatic; 1, limp tail; 2, wobbly gait with righting difficulty; 3, hind-limb weakness and extreme righting difficulty; 4, hind-limb paralysis; 5, moribund. All animal studies were approved by the University of Iowa Animal Care and Use Committee.
Virus
Non-recombinant and recombinant (rJ2.2) J2.2-V-1 were propagated on mouse 17Cl-1 cells (a BALB/c-derived fibroblast cell line) and titered on HeLa cells expressing the MHV receptor (CEACAM1) (23) as described previously (31). Mice were inoculated intracerebrally (i.c.) with 500 (RAG1−/− mice) or 1000 PFU (B6 mice) of rJ2.2 or J2.2-V-1 in 30 μl of DMEM. The same results were obtained when mice were inoculated with J2.2-V-1 or rJ2.2 and in the text we refer to all infected mice as J2.2-V-1-infected.
Antibodies and flow cytometric analyses
All antibodies were purchased from BD-Pharmingen (San Diego, CA) unless indicated below. To detect total cells, cells harvested from brains, spleens or lymph nodes were stained with anti-CD8-PE and anti-CD4-PerCP or CD19-PE alone. In some experiments, Tregs were identified by Foxp3 expression. Briefly, cells were harvested from brains, spleens or lymph nodes and stained with anti-CD4-PerCP mAb. After permeabilization and fixation, cells were stained with anti-Foxp3-PE or isotype control Rat IgG2a-PE mAb, as per the manufacturer, eBiosciences (San Diego, CA).
For detection of intracellular cytokine expression, CD8 or CD4 T cells were stimulated for 5 hours with 1 μM peptide S510 (spanning residues S510-518 of the surface (S) glycoprotein) or 5 μM peptide M133 (spanning residues M133-147 of the transmembrane (M) protein) in the presence of 1 μl/ml Golgiplug (BD Pharmingen) and APCs (CHB3 cells, H-2Db, I-Ab). Intracellular IFN-γ expression was detected following fixation and permeabilization (BD Pharmingen). For tetramer staining, M133-specific and S510-specific cells were detected using PE-conjugated I-Ab/M133 and H-2Db/S510 tetramers respectively, obtained from the N.I.H. MHC Tetramer Core Facility (Atlanta, GA). Cells were stained with 8 μg/ml I-Ab/M133 tetramers for 2 hours at 37°C, or 5 μg/ml H-2Db/S510 tetramers for 1 hour at 4°C. Cells were then incubated with anti-CD16/CD32-biotin and anti-CD4-PerCP or anti-CD8-PerCP mAb, followed by Avidin-APC. Results are shown after gating on CD16/CD32 negative cell populations.
To assess DC activation, CLN cells were stained for CD11c-APC and I-A/I-E-PerCp/Cy5.5 (BioLegend, San Diego, CA) and either CD80-PE, CD40-PE, or CD86-PE or their respective isotypes (hamster IgG-PE or rat IgG2a-PE) (eBioscience). Cells were analyzed using a FACSCalibur (BD Biosciences).
Preparation of CNS leukocytes
Mononuclear cells were isolated from brains and spinal cords as described previously (32). Briefly, tissues were mechanically homogenized using frosted glass slides. Cells were suspended in 30% Percoll (Pharmacia, Uppsala, Sweden) and centrifuged at 300 × g at 4°C for 30 min. Percoll and lipid layers were aspirated and the cell pellet was resuspended, passed through a 70 μm cell strainer, and counted.
CD4+Foxp3+ and CD4+Foxp3− cell separation and sorting
CD4 T cells were purified using an autoMACS Separator and a CD4 T Cell Isolation Kit (Miltenyi Biotec, Auburn, CA) according to the manufacturer’s protocol. Briefly, CD4 T cells were negatively selected from naïve Foxp3-GFP splenocytes by depletion with a cocktail of lineage-specific biotin-conjugated antibodies against CD8 (Ly-2), CD11b (Mac-1), CD45R (B220), CD49b (DX5), Ter-119 and anti-biotin microbeads. GFP+ and GFP− CD4 T cells were sorted by a FACSDiva (BD Biosciences). Post sort analysis showed that CD4+Foxp3+ cells were >99% pure and CD4+Foxp3− cells were >97% pure.
Adoptive transfer into B6 and RAG1−/− mice
For B6 mice, 4 × 10⁵ CD4+Foxp3+ T cells were adoptively transferred (AT) into 6 week old B6 mice five days after infection with J2.2-V-1. Control J2.2-V-1-infected mice received the same numbers of CD4+Foxp3− T cells. For transfer into RAG1−/− mice, JHMV-immune splenocytes were prepared from B6 mice immunized with 3 × 10⁵ PFU wild-type JHMV intraperitoneally 7 days prior to adoptive transfer. In addition, these cells were depleted of Tregs by treatment with 0.5 mg of rat mAb PC61 (American Type Culture Collection, Manassas, VA) administered in vivo 3 days prior to harvest. CD4+Foxp3+ T cells were purified from Foxp3-GFP mice as described above. RAG1−/− mice were infected with 500 PFU J2.2-V-1 by intracranial inoculation. Four days later, one group of infected mice received 1 × 10⁶ JHMV-immune B6 splenocytes and 4 × 10⁵ CD4+Foxp3+ T cells while controls received the same numbers of JHMV-immune splenocytes and CD4+Foxp3− T cells. Cells were transferred to mice in 200 μl PBS intravenously.
In vivo proliferation BrdU assays
All mice were given one intraperitoneal injection of 2 mg of BrdU solution (BD Pharmingen). BrdU incorporation was examined 16 hours after injection by intracellular detection using reagents and protocols provided by the manufacturer (APC BrdU Flow Kit, BD Pharmingen). Cells harvested from an infection-matched, BrdU-nontreated mouse served as a control for the FACS analyses.
Assessment of apoptosis by measurement of active caspases 3 & 7
To assay caspase 3 and 7 expression, cells were stained with sulforhodamine fluorochrome inhibitors of caspases (FLICA) (Immunochemistry Technologies, Bloomington, MN) for 1 hour at 37°C, followed by staining for CD4, CD8, and 7-AAD. Cells were analyzed using a LSR II with a 405nm (violet) laser (BD Biosciences).
qRT-PCR
Brain and CLN were homogenized directly into TRIzol Reagent (Invitrogen/Life Technologies, Carlsbad, CA). RNA was extracted and reverse-transcribed using Superscript II (Invitrogen) according to the manufacturer’s instructions. Relative cytokine transcript quantities were determined by qRT-PCR using SYBR Green (Invitrogen) and primers specific for IL-2, IL-10, IL-27 EBV-induced gene 3, IL-6, CCL2, TNF, and IL-12 p40 subunit. Amplification was performed using the 7300 Sequence Detector (Applied Biosystems, Foster City, CA). Specificity of the amplification was confirmed using melting curve analysis. Data were analyzed as previously described (33), with normalization to hypoxanthine-guanine phosphoribosyltransferase (HPRT).
ELISA for cytokines and chemokines
Brain and CLN were weighed and homogenized directly into 50 mM Tris, 150 mM NaCl, 5 mM EDTA, 1 mM Na3VO4, 1% NP-40 and a protease inhibitor cocktail (Complete, Roche, Mannheim, Germany). Samples were diluted to a concentration of 10 mg/ml. IL-2, IL-12, TNF, and CCL2 concentrations were determined by ELISA using reagents and protocols provided by the manufacturer (eBioscience).
Immunohistochemistry and quantification of demyelination
After perfusion of mice with PBS, spinal cords were fixed with 10% zinc-formalin and embedded in paraffin. For examination of myelin and cell morphology, 8 μm sections were stained with Luxol fast blue and counterstained with hematoxylin and eosin. For macrophage/microglia staining, 8 μm sections were blocked with CAS Block (Zymed Laboratories, San Francisco, CA), and stained with F4/80 antibody (eBioscience) as previously described (34). Macrophage infiltration into the white and gray matter was assessed by counting F4/80+ cells in ten randomly selected fields under 40X magnification. No staining was detected in the absence of primary antibody. Images of stained spinal cord sections were digitalized using an Optiphot charge-coupled camera attached to a Leitz diaplan light microscope (Leica Microsystems, Wetzlar, Germany). Blinded quantification of demyelination was performed as previously described (35).
Statistical analysis
Two-tailed unpaired Student’s t tests were used to analyze differences in mean values between groups. All results are expressed as means ± standard errors of the means (s.e.m.). Differences with values of P < 0.05 were considered significant.
Results
Transferred Tregs diminished weight loss, clinical disease and demyelination without delaying virus clearance in J2.2-V-1-infected B6 mice
In a previous report, we showed that adoptive transfer of CD25+ Tregs into neurovirulent JHMV-infected B6 mice prolonged survival without affecting the kinetics of virus clearance (22). Since cells were transferred 1 day post infection (p.i.), it was not possible in these experiments to determine whether Tregs functioned during the priming or effector stage of the T cell response. To begin to answer this question, we transferred naïve splenic CD4+Foxp3+ Tregs or as a control, CD4+Foxp3− T cells, intravenously (i.v.) into J2.2-V-1-infected B6 mice at day 5 p.i. In these experiments, we transferred cells from mice that expressed GFP behind the Foxp3 promoter, enabling Treg purification. Demyelination in J2.2-V-1-infected mice is largely T cell-driven so we transferred cells at day 5 p.i. to allow sufficient time for T cell priming to occur in the absence of any interventions. We monitored weight loss and clinical disease daily for three weeks. As shown in Figure 1a, the adoptive transfer of Tregs to B6 mice significantly decreased weight loss in mice infected with J2.2-V-1 (days 9-21, P < 0.05) but did not change survival (Figure 1b). Consistent with the differences in weights, there was a significant reduction in clinical scores at the peak of clinical disease (days 8-12, P < 0.05), starting just 3 days post Treg transfer (Figure 1c).
Figure 1. Transferred Tregs ameliorated disease in J2.2-V-1-infected B6 mice with demyelinating encephalomyelitis.

B6 mice were infected with 1000 PFU J2.2-V-1 and received 4×10⁵ CD4+Foxp3+ or 4×10⁵ CD4+Foxp3− naïve splenocytes at day 5 p.i. Mice were weighed daily (a), and monitored for survival (b) and clinical disease (c). Scoring was as described in Materials and Methods. Data are from three independent experiments with at least 16 mice/group. Statistically significant differences in weight (a, days 9-21, P < 0.05) and clinical disease (c, days 8-12, P < 0.05) were detected.
We next examined infected spinal cords for myelin destruction at day 21 p.i., the peak of demyelination in J2.2-V-1-infected B6 mice (36). The level of demyelination in mice receiving Tregs, as assessed by Luxol fast blue staining, was significantly decreased when compared to those that received CD4 T cells depleted of Tregs (Figure 2a-c). To confirm the presence of demyelination, adjacent spinal cord sections were stained for macrophages and microglia with F4/80 antibody, since increased infiltration of these cells is detected at sites of active demyelination (20, 37). As expected large numbers of macrophages/microglia could be seen at sites of demyelination with a diminished number detected in mice receiving Tregs compared to those that received CD4+Foxp3− T cells (99 ± 16/40X field, compared to 181 ± 15/40X field, P < 0.05; 10 fields/mouse, n = 3 mice for each group). We also examined viral titers to determine if the decrease in immunopathology was associated with diminished ability to control virus replication. There were no differences in virus titers at day 9 or day 14 p.i., with approximately 50% of mice in each group clearing the virus by day 14, showing that the transferred Tregs did not significantly alter the kinetics of virus clearance (Figure 2d).
Figure 2. Transferred Tregs reduced demyelination without affecting virus clearance in J2.2-V-1-infected B6 mice.

(a,b) Luxol fast blue staining of spinal cords at day 21 p.i. from B6 mouse receiving CD4+Foxp3+ (a) or CD4+Foxp3− (b) splenocytes at day 5 p.i. Less demyelination was detected in the spinal cords of mice that received CD4+Foxp3+ cells. Demyelinated areas are outlined in yellow. (c) Percent demyelination from individual mice at day 21 p.i. Numbers are % demyelination ± s.e.m. A statistically significant difference in demyelination was observed (*, P < 0.05). (d) Viral titers from J2.2-V-1-infected B6 mice at days 9 and 14 p.i. The dashed line represents the limit of detection. Data are from two independent experiments with ≥ 6 mice/group.
Treg transfer decreased total numbers of T lymphocytes but not the percentage of virus-specific cells in the CNS of J2.2-V-1-infected B6 mice
The decrease in weight loss, clinical scores, and demyelination in B6 mice receiving CD4+Foxp3+ T cells compared to those receiving CD4+Foxp3− T cells raised the possibility that Tregs diminished the inflammatory response. We next analyzed the T cell response in the brain at a time point when T cell expansion was at its peak (day 9) and at a later time p.i. when demyelination was maximal (day 21). There were decreased numbers of CD4 and CD8 T cells at day 9 p.i. in mice that received Tregs although only the difference in CD4 T cell numbers achieved statistical significance (Figure 3a). These differences in cell numbers reflected differences in total numbers of infiltrating inflammatory cells, since the frequency of each population was not different between mice that received CD4+Foxp3+ and CD4+Foxp3− cells (Figure 3b). Therefore, the addition of Tregs affected migration of all cell types to the brain. The adoptive transfer of Tregs resulted in an increase in the percentage of CD4 T cells that were Foxp3+. Tregs were identified by intracellular Foxp3 expression, so that both transferred and endogenous Tregs were counted.
Figure 3. Transferred Tregs reduced inflammatory infiltration into the J2.2-V-1-infected CNS.

(a-d) Total CD4 and CD8 T cell numbers and percentage of T cells isolated from the brain at day 9 p.i. (a, b) and 21 p.i. (c,d) *, P < 0.05; **, P < 0.01; N.S., not significant. Data are from three independent experiments. (e) FACS data from CNS-derived lymphocytes directly stimulated with peptide ex vivo or stained for tetramer at day 14 p.i. Cells are gated on CD8+ or CD4+ T cells. Frequency and number of epitope-specific T cells are shown. Four mice were analyzed per group. Data are from one experiment representative of two.
By day 21 p.i., there were no significant differences in CD4, CD8, or Treg cell numbers or frequency in mice receiving Tregs compared to those that received Foxp3− T cells (Figure 3c, d). We also examined the antigen specificity of the T cells directly ex vivo by tetramer staining and detected no differences in the fractions of CD4 and CD8 T cells that were specific for the immunodominant CD4 (M133) and CD8 (S510) epitopes at day 14 (Figure 3e) or 21 p.i. (data not shown). We examined functionality of these cells using an intracellular cytokine staining for IFN-γ after stimulation with peptides corresponding to these two epitopes and detected a lower number but not frequency of epitope M133-specific CD4 T cells at day 14 (Figure 3e). In summary, transferred Tregs ameliorated clinical disease and demyelination in J2-2-V-1 infected B6 mice, and this correlated with diminished infiltration of inflammatory cells into the CNS.
Treg transfer into infected RAG1−/− mice decreased weight loss, clinical scores and kinetics of virus clearance
Since Tregs were effective when administered 5 days p.i., they likely functioned after initial effector T cell priming occurred, affecting either effector T cell function at the site of inflammation or in the lymph node during secondary stages of stimulation. To address these possibilities, we used J2.2-V-1-infected RAG1−/− mice with adoptive transfer of JHMV-immune effector T cells, since this infectious system is amenable to manipulation of the transferred cells. We transferred 1×10⁶ JHMV-immune Treg-depleted effector splenocytes along with 4×10⁵ Tregs (CD4+Foxp3+) or 4×10⁵ CD4+Foxp3− T cells harvested from a naïve Foxp3-GFP spleen to RAG1−/− mice at day 4 p.i. A high ratio of Tregs to splenocytes was chosen in order to amplify any effects mediated by Tregs. A control group of RAG1−/− mice received no adoptively transferred cells. First we tracked weight loss and determined clinical scores in all mice groups until day 14 p.i., when the majority of mice that did not receive Tregs died. While all groups exhibited severe weight loss, recipients of Tregs and JHMV-immune splenocytes maintained their weight for a significantly longer time (Figure 4a, days 6-14, P < 0.05) and had a two-day delay in deterioration in clinical scores (Figure 4b) compared to mice that received non-Treg CD4 T cells and JHMV-immune splenocytes. Adoptive transfer of JHMV-immune splenocytes with or without Tregs diminished virus titers in J2.2-V-1-infected RAG1−/− mice, but the process of clearance resulted in myelin destruction and clinical disease (17). Consistent with the delayed onset of weight loss and clinical disease in mice that received Tregs, we detected higher virus titers at days 10 and 14 p.i in these mice, although statistically significant differences were only observed at day 14 p.i. (Figure 4c). Of note, both groups of recipients exhibited significant virus clearance when compared to RAG1−/− mice that did not receive transferred cells. Differences in virus clearance were probably detected in infected RAG1−/− but not B6 mice (Figure 2c) because virus was cleared rapidly in immunocompetent mice, obscuring any role that Tregs had in delaying this process.
Figure 4. RAG1−/− mice receiving transferred Tregs showed improved clinical outcomes with delayed virus clearance and decreased demyelination.

RAG1−/− mice were infected with 500 PFU J2.2-V-1 and received 1×10⁶ JHMV-immune B6 splenocytes and 4×10⁵ CD4+Foxp3+ or 4×10⁵ CD4+Foxp3− naïve splenocytes or no cells at day 4 p.i. Weight (a) and clinical scores (b) were monitored. Differences in weight and clinical scores between mice that received CD4+Foxp3+ and CD4+Foxp3− reached statistical significance at days 6-14 (P < 0.05) and days 8-14 (P < 0.05), respectively. (c) Virus titers from J2.2-V-1 infected RAG1−/− mice at days 10 and 14 p.i. (d) Luxol fast blue stained spinal cords were examined for demyelination at day 14 p.i. A statistically significant difference in demyelination was observed. Each symbol represents an individual mouse. *, P < 0.05; **, P < 0.01; ***, P < 0.001; N.S., not significant; N.D., not determined. Data are from three (a,b) or two (c,d) independent experiments with at least 6 mice/group.
The delay in weight loss and clinical scores and increased virus titers observed in the presence of Tregs suggested that demyelination would also be decreased. To examine this possibility, we quantified the amount of myelin destruction at day 14 p.i. Of note, no demyelination is observed in J2.2-V-1-infected RAG1−/− mice in the absence of adoptively transferred cells (17). Less demyelination was detected in infected RAG1−/− mice that received Tregs when compared to those that did not (16 ± 2% vs. 31 ± 3%, P = 0.001) (Figure 4d). Therefore, Tregs diminished clinical disease and demyelination even if added after priming of anti-virus T cells had occurred.
Transferred Tregs were detected in the draining cervical lymph nodes (CLN) but not in the brain
To begin to determine the site of action of the co-transferred Tregs, we examined their numbers in the brain, CLN and spleen. Transferred CD4 and CD8 T cells were detected in the brain (Figure 5a), spleen and CLN (data not shown) while few transferred B cells were detected. We next examined these sites for transferred Tregs, assaying for both GFP and intracellular Foxp3 expression. At days 10 and 14 p.i., Foxp3-GFP cells could be found in RAG1−/− mice that received Tregs (Figure 5b, 6). There was complete concordance between Foxp3 and GFP expression. As expected, few Foxp3+ cells could be found in infected RAG1−/− mice that received virus-immune splenocytes but not Tregs, suggesting that little or no peripheral conversion occurred up to 9 days post transfer and that Treg depletion of JHMV-immune splenocytes prior to transfer was efficient. Surprisingly, very few Tregs could be found in the CNS at all time points examined. No Tregs were detected in the brain or spinal cord at day 10 p.i. and only 2% of the CD4 T cells were Foxp3+ at day 14 p.i. (Figure 6d). The highest frequency of Tregs were found in the CLN, where they constituted 15% and 20% of CD4 T cells at days 10 and 14 p.i., respectively, in mice that received Tregs (Figure 6e and 6f).
Figure 5. Transferred effector T cells but not Tregs reconstituted the brains of infected RAG1−/− mice.
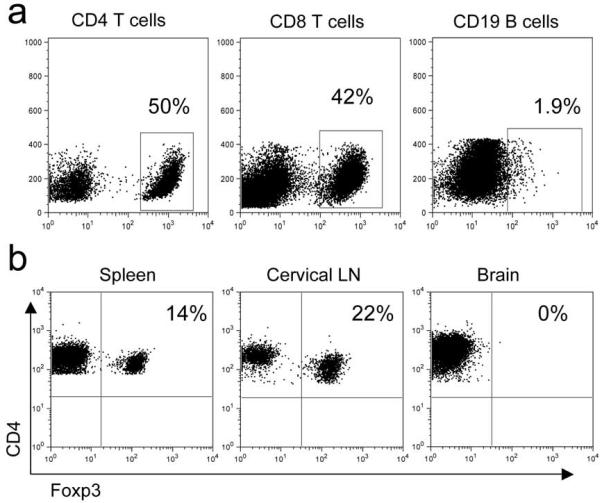
(a) RAG1−/− mice were infected with 500 PFU J2.2-V-1 and received 4×10⁵ CD4+Foxp3+ T cells and 1×10⁶ JHMV-immune B6 splenocytes at day 4 p.i. Mice were sacrificed at day 14 p.i. and analyzed for CD4 and CD8 T and B cells in the brain. Gated cells are labeled above plots with percentages shown from gates. (b) Flow cytometry of Tregs isolated from RAG1−/− mice as described in (a). Cells are gated on CD4+ T cells isolated from indicated site. Numbers are percentage of cells in right upper quadrant. Data are from one experiment representative of three independent experiments.
Figure 6. Treg transfer diminished the numbers of CD4 and CD8 T cells in the CLN and brains of J2.2-V-1-infected RAG1−/− mice.

RAG1−/− mice were infected with 500 PFU J2.2-V-1 and received 1×10⁶ JHMV-immune B6 splenocytes and 4×10⁵ CD4+Foxp3+ (filled bars) or 4×10⁵ CD4+Foxp3− (open bars) cells at day 4 p.i. Mice were sacrificed at day 10 p.i. (a,b,e,g) or day 14 p.i. (c,d,f,h). Numbers and percentages of T cells in the brain (a-d), CLN (e,f) and spleen (g,h) are shown. Numbers of Tregs were below the level of detection in the brain at day 10 p.i. *, P < 0.05; **, P < 0.01; ***, P < 0.001; N.S., not significant. Data are from three independent experiments with at least 9 mice/group.
CD4 and CD8 T cell number and frequencies were decreased in RAG1−/− mice receiving Tregs, reflecting effects on T cell proliferation
We next examined whether co-transferred Tregs diminished infiltration of inflammatory cells into the CNS, as occurred in infected B6 mice. As seen in figure 6a-d, there was a 10- to 20-fold decrease in numbers and frequencies of CD4 and CD8 T cells in the brain at days 10 and 14 p.i., with the greatest effects observed on numbers of CD4 T cells. Decreases in CD4 T cell frequencies were also detected in the CLN and spleen, but these reached statistical significance only in the spleen at day 10 p.i. (Figure 6g). As observed in J2.2-V-1-infected B6 mice (Figure 3e), the fraction of CD4 and CD8 T cells that were J2.2-V-1-specific were the same in both groups as detected by tetramer staining (Figure 7). Similar fractions expressed IFN-γ in response to peptides M133 and S510 as measured by intracellular cytokine staining, suggesting that while numbers of both virus-specific and nonspecific CD4 and CD8 T cells in the brain were diminished by Treg transfer, the cells that did migrate to the CNS were functional (Figure 7).
Figure 7. Transferred Tregs did not change percentage of virus-specific T cells in the CNS of J2.2-V-1-infected RAG1−/− mice.

RAG1−/− mice were infected with 500 PFU J2.2-V-1 and received 1×10⁶ JHMV-immune B6 splenocytes and 4×10⁵ CD4+Foxp3+ or 4×10⁵ CD4+Foxp3− cells at day 4 p.i. Mice were sacrificed at day 10 p.i. and flow cytometric analyses were performed on CNS-derived lymphocytes stimulated with virus-specific peptide directly ex vivo or stained with tetramer. Cells are gated on CD8+ or CD4+ T cells. Numbers are percentage of cells in right upper quadrant. Data are from one experiment representative of two independent experiments with 6 mice/group.
Tregs have been shown to have both anti-proliferative and pro-apoptotic effects (8, 38). Our observations led us to question whether the presence of Tregs inhibited effector T cell proliferation or increased their turnover. To address effects on proliferation, we measured BrdU incorporation in vivo after a 16-hour treatment at day 10 p.i. Both CD4 and CD8 T cells proliferated at higher rates in the brains of RAG1−/− mice that received CD4+Foxp3− T cells when compared to those that received Tregs (Figure 8a). Additionally, CD4 T cells in the CLN proliferated at higher rates in mice that did not receive Tregs (Figure 8b). Further, the amount of proliferation was approximately 10-fold higher in the CLN than in the brain, suggesting that Tregs suppressed proliferation of effector CD4 and CD8 T cells in the CLN, with subsequent effects on T cell numbers in the brain.
Figure 8. Transferred Tregs suppressed T cell proliferation but did not enhance level of apoptosis.

RAG1−/− mice were infected with 500 PFU J2.2-V-1 and received 1×10⁶ JHMV-immune B6 splenocytes and 4×10⁵ CD4+Foxp3+ (filled bars) or 4×10⁵ CD4+Foxp3− (open bars) cells at day 4 p.i. (a,b) BrdU was administered to mice intraperitoneally as described in Materials and Methods at 10 day p.i. The percentage of brain (a) and CLN-derived (b) cells that incorporated BrdU incorporation after 16 hours in vivo labeling is shown. (c,d) Mice were sacrificed at day 10 p.i. and analyzed for percentage of brain (c) or CLN-derived (d) cells that expressed active caspase 3 and 7. *, P < 0.05; **, P < 0.01; N.S., not significant. Data are from two independent experiments with ≥ 6 mice/group.
We observed no significant differences in the levels of apoptosis of CD4 or CD8 T cells in the two groups of mice. In these experiments, activation of caspases 3 and 7 was analyzed at day 10 p.i. in the brain and CLN (Figure 8c and 8d, respectively). Therefore, we conclude that the differences in total T cell numbers are due to suppression of proliferation and not increased T cell apoptosis in RAG1−/− mice receiving Tregs, though we cannot rule out that differential recruitment to the CLN and brain may have also contributed to the differences in total T cell numbers.
Transferred Tregs reduced DC activation and decreased expression of pro-inflammatory cytokines and chemokines in the brains and CLN of recipients
The diminished T cell proliferation detected in the CLN and brain likely reflected the anti-inflammatory milieu mediated by the transferred Tregs. As another approach to determining whether the transferred Tregs generally inhibited the inflammatory response, we assessed DC activation by measuring surface levels of MHC class II antigen, CD86, CD80 and CD40. Levels of CD40, CD80 and MHC class II were lower in recipients of transferred Tregs (Figure 9a,b). Additionally, wemeasured the levels of several pro and anti-inflammatory chemokines and cytokines in the brain and CLN, using quantitative RT-PCR (qRT-PCR) and ELISA. mRNA and protein levels of IL-2, TNF and CCL2 were significantly diminished in the CLN whereas those of the anti-inflammatory molecules, IL-10 and IL-27 did not change in Treg recipients compared to those receiving CD4+Foxp3− T cells (Figure 9c,d). Levels of most cytokine and chemokine mRNAs (IL-2, IL-6, IL-12, TNF, CCL2 and IL-27) were diminished in the brains of recipients of Tregs although only IL-12 (RNA), IL-2 (protein) and CCL2 (RNA and protein) reached statistical significance. Therefore, the presence of Tregs decreased pro-inflammatory chemokine and cytokine levels in both the CLN and CNS, thus augmenting an anti-inflammatory milieu. In particular, differences in CCL2 in the brain may contribute to differences in numbers of infiltrating T cells and macrophages in infected mice, as reported previously (39, 40).
Figure 9. Transferred Tregs suppressed DC activation and production of pro-inflammatory cytokines and chemokines in brains and CLN of J2.2-V-1-infected RAG1−/− mice.

RAG1−/− mice were infected with 500 PFU J2.2-V-1 and received 1×10⁶ JHMV-immune B6 splenocytes and 4×10⁵ CD4+Foxp3+ (filled bars) or 4×10⁵ CD4+Foxp3− (open bars) cells at day 4 p.i. Mice were sacrificed at day 10 p.i. (a,b) CLN cells were examined for CD40, CD80, CD86 and MHC class II expression. DC gating strategy is shown in left hand panel. Middle and right hand panels show representative histograms of CD86 and CD40 staining (isotype control-filled; recipients of CD4+Foxp3+ cells-light line; recipients of CD4+Foxp3− cells-bold line). (c,d) Levels of the indicated cytokines and chemokines in the brain and CLN were measured by qRT-PCR or ELISA as described in Materials and Methods. *, P < 0.05; **, P < 0.01; N.S., not significant. Data are from 5-15 mice/group.
Discussion
Here, we show that adoptive transfer of Tregs into coronavirus-infected mice decreased clinical disease and myelin destruction. Transfer into wild-type B6 mice demonstrated that this effect occurred in immunocompetent mice but did not allow easy identification of the site of action. However, transfer of Tregs concomitant with virus-specific T cells to J2.2-V-1-infected RAG1−/− mice suggested that Tregs functioned in the draining lymph nodes, inhibiting T cell proliferation, DC activation and expression of pro-inflammatory cytokines and chemokines. We also detected diminished T cell proliferation and expression of pro-inflammatory mediators in the brain, but since we detected virtually no transferred Tregs in the brain, we conclude that their primary site of action is in the CLN. In our previous study, we transferred Tregs into mice with acute encephalitis induced by highly virulent JHMV (22). These cells enhanced survival, but as in J2.2-V-1-infected mice, few of the transferred cells were detected in the brain.
Support for a role in draining lymph nodes and not in the brain comes from a study of mice with experimental autoimmune encephalomyelitis. In these mice, large numbers of CNS antigen-specific Tregs were present in the inflamed brain, but their function was impaired by the elevated expression of pro-inflammatory molecules such as IL-6 and TNF (28). IL-6 in particular has been shown to counter Treg immunosuppression (41). Consistent with these results, a large proportion of CD4 T cells in the CNS of mice with JHMV-mediated acute encephalitis are Foxp3+ at early times after infection, but they appear to be largely ineffective in the inflamed environment that develops in the CNS (22). The implications of these studies are that even if Tregs were present in J2.2-V-1-infected brain, they would not function properly. Another cytokine, IL-12, facilitates proliferation and activation of effector T cells in the presence of Tregs, but like IL-6, levels were very low in the CLN of infected mice. The low IL-6 and IL-12 levels present in the infected CLN (Figure 9) might not be able to counter Treg-mediated immunosuppression.
Our conclusions are also consistent with previous studies demonstrating a key role for transferred Tregs in downregulating the inflammatory response in draining lymph nodes, even in the context of an ongoing inflammatory process. In HIV-infected humans and SIV-infected macaques, Tregs in lymph nodes inhibited CD8 T cell proliferation and activation (42, 43). The consequences of diminishing T cell activation appeared to be twofold: virus clearance was inhibited, but immune hyperactivation, which is a key factor in HIV and SIV disease, was diminished. Similarly, in animals chronically infected with Leishmania, Tregs functioned in the draining lymph nodes to diminish the immunopathologic consequences of the parasite-specific immune response, but also delayed pathogen clearance (44).
In NOD mice with the recent onset of diabetes, transferred Tregs reversed disease progression and increased the numbers of Tregs in the draining lymph nodes (45). Most of these Tregs were host-derived, suggesting that the transferred cells established an anti-inflammatory milieu that enhanced the accumulation or proliferation of endogenous Tregs. Our results show that host-derived Tregs are not essential for an anti-inflammatory state since it occurs in RAG1−/− recipients, which lack endogenous Tregs. Tregs functioned in the draining lymph nodes to suppress effector T cell proliferation, a well-described property of regulatory T cells (8). In contrast to some previous studies, Tregs did not induce apoptosis of effector T cells (38, 46). Our results are similar to a recent report showing that human Tregs were able to suppress T effector proliferation and cytokine production but did not cause apoptosis (47).
Our data suggest that effector T cells, even if previously primed, are still subject to regulation and suppression by Tregs in the context of an active viral infection. Of the 1 × 10⁶ splenocytes transferred to infected RAG1−/− recipients, approximately 1-2% of the CD4 T cells are epitope M133-specific and 2-10% of the CD8 T cells are S510-specific. Thus, the virus-specific cells must undergo extensive cell division to obtain the levels detected in the infected recipients. While T cells transferred into naïve RAG1−/− mice are known to undergo homeostatic proliferation, virus-specific CD4 and CD8 T cell populations preferentially expand in the infected animal. Consistent with this, when we performed an adoptive transfer of JHMV-immune splenocytes into an uninfected RAG1−/− mouse, virus-specific T cells did not preferentially expand and remained at low levels (data not shown). Thus, while Treg suppression of T cell homeostatic proliferation in the lymphopenic environment present in RAG1−/− recipients is well documented (38, 48), it is unlikely that they function in infected mice in this capacity.
Transferred Tregs preferentially diminished CD4 as opposed to CD8 T cell infiltration into the J2.2-V-1-infected B6 and RAG1−/− CNS. This preferential inhibition likely contributed to improved outcome since we previously showed that the virus-specific CD4 T cell response was partly pathogenic. Thus, infection of mice with a variant of neurovirulent JHMV in which the immunodominant M133 CD4 T cell epitope was genetically disrupted decreased mortality from 100% to 0%. Lethality reverted to 50% when a CD4 T cell epitope from Listeria monocytogenes was inserted into the genome (49), confirming the role of the CD4 T cell response in disease severity. Further, transfer of CD8 T cell-depleted JHMV-immune splenocytes to J2.2-V-1-infected RAG1−/− mice resulted in more severe disease than did transfer of undepleted or CD4 T cell-depleted populations (17).
How do Tregs function in J2.2-V-1-infected mice? IL-10 expressed by Tregs is probably not critical for diminishing inflammation because IL-10−/− Tregs function equally as well as IL-10+/+ Tregs in mediating enhanced survival in mice infected with neurovirulent JHMV (22). Our results are most consistent with a Treg inhibitory effect on DC function in the CLN. Treg expression of CTLA-4, TGF-β, LAG3 and CD39/CD73 have been implicated in Treg-mediated suppression of DC function (8-10), but determining the precise mode of action of Tregs in the CLN of J2.2-V-1-infected mice will require further investigation. Our results also suggest that modulating the balance of pro and anti-inflammatory factors, whether by Treg transfer or otherwise enhancing the anti-inflammatory milieu, could potentially contribute to improved outcomes in the setting of virus-induced demyelination.
Acknowledgments
We thank Dr. Steve Varga for critical review of the manuscript and the N.I.H. Tetramer Facility for providing MHC class I and II tetramers.
Footnotes
This work was supported in part by grants from the N.I.H. (NS36592) and National Multiple Sclerosis Society. K.T. was supported by an N.I.H. training grant (T32 AI007511-14).
- AT
- Adoptive transfer
- B6
- C57BL/6 mouse
- MHV
- Mouse hepatitis virus
- CLN
- Cervical Lymph Node
- Treg
- Regulatory T cell
- DC
- Dendritic cell
- MS
- Multiple sclerosis
- p.i.
- post infection
References
- 1.Hori S, Nomura T, Sakaguchi S. Control of regulatory T cell development by the transcription factor Foxp3. Science. 2003;299:1057–1061. [PubMed] [Google Scholar]
- 2.Feuerer M, Hill JA, Mathis D, Benoist C. Foxp3+ regulatory T cells: differentiation, specification, subphenotypes. Nat Immunol. 2009;10:689–695. doi: 10.1038/ni.1760. [DOI] [PubMed] [Google Scholar]
- 3.Shevach EM. From vanilla to 28 flavors: multiple varieties of T regulatory cells. Immunity. 2006;25:195–201. doi: 10.1016/j.immuni.2006.08.003. [DOI] [PubMed] [Google Scholar]
- 4.Li S, Gowans EJ, Chougnet C, Plebanski M, Dittmer U. Natural regulatory T cells and persistent viral infection. J Virol. 2008;82:21–30. doi: 10.1128/JVI.01768-07. [DOI] [PMC free article] [PubMed] [Google Scholar]
- 5.Robertson SJ, Messer RJ, Carmody AB, Hasenkrug KJ. In vitro suppression of CD8+ T cell function by Friend virus-induced regulatory T cells. J Immunol. 2006;176:3342–3349. doi: 10.4049/jimmunol.176.6.3342. [DOI] [PubMed] [Google Scholar]
- 6.Lund JM, Hsing L, Pham TT, Rudensky AY. Coordination of early protective immunity to viral infection by regulatory T cells. Science. 2008;320:1220–1224. doi: 10.1126/science.1155209. [DOI] [PMC free article] [PubMed] [Google Scholar]
- 7.Ruckwardt TJ, Bonaparte KL, Nason MC, Graham BS. Regulatory T cells promote early influx of CD8+ T cells in the lungs of respiratory syncytial virus-infected mice and diminish immunodominance disparities. J Virol. 2009;83:3019–3028. doi: 10.1128/JVI.00036-09. [DOI] [PMC free article] [PubMed] [Google Scholar]
- 8.Shevach EM. Mechanisms of foxp3+ T regulatory cell-mediated suppression. Immunity. 2009;30:636–645. doi: 10.1016/j.immuni.2009.04.010. [DOI] [PubMed] [Google Scholar]
- 9.Tang Q, Bluestone JA. The Foxp3+ regulatory T cell: a jack of all trades, master of regulation. Nat Immunol. 2008;9:239–244. doi: 10.1038/ni1572. [DOI] [PMC free article] [PubMed] [Google Scholar]
- 10.Vignali DA, Collison LW, Workman CJ. How regulatory T cells work. Nat Rev Immunol. 2008;8:523–532. doi: 10.1038/nri2343. [DOI] [PMC free article] [PubMed] [Google Scholar]
- 11.Bergmann CC, Lane TE, Stohlman SA. Coronavirus infection of the central nervous system: host-virus stand-off. Nat Rev Microbiol. 2006;4:121–132. doi: 10.1038/nrmicro1343. [DOI] [PMC free article] [PubMed] [Google Scholar]
- 12.Perlman S, Netland J. Coronaviruses post-SARS: update on replication and pathogenesis. Nat Rev Microbiol. 2009;7:439–450. doi: 10.1038/nrmicro2147. [DOI] [PMC free article] [PubMed] [Google Scholar]
- 13.Stohlman SA, Bergmann CC, Perlman S. Mouse hepatitis virus. In: Ahmed R, Chen I, editors. Persistent Viral Infections. John Wiley & Sons, Ltd.; New York: 1998. pp. 537–557. [Google Scholar]
- 14.Zhao J, Zhao J, Perlman S. De novo recruitment of antigen-experienced and naive T cells contributes to the long-term maintenance of antiviral T cell populations in the persistently infected central nervous system. J Immunol. 2009;183:5163–5170. doi: 10.4049/jimmunol.0902164. [DOI] [PMC free article] [PubMed] [Google Scholar]
- 15.Bergmann CC, Parra B, Hinton DR, Ramakrishna C, Dowdell KC, Stohlman SA. Perforin and gamma interferon-mediated control of coronavirus central nervous system infection by CD8 T cells in the absence of CD4 T cells. J Virol. 2004;78:1739–1750. doi: 10.1128/JVI.78.4.1739-1750.2004. [DOI] [PMC free article] [PubMed] [Google Scholar]
- 16.Wang F, Stohlman SA, Fleming JO. Demyelination induced by murine hepatitis virus JHM strain (MHV-4) is immunologically mediated. J. Neuroimmunol. 1990;30:31–41. doi: 10.1016/0165-5728(90)90050-W. [DOI] [PMC free article] [PubMed] [Google Scholar]
- 17.Wu GF, Dandekar AA, Pewe L, Perlman S. CD4 and CD8 T cells have redundant but not identical roles in virus-induced demyelination. J. Immunol. 2000;165:2278–2286. doi: 10.4049/jimmunol.165.4.2278. [DOI] [PubMed] [Google Scholar]
- 18.Pewe L, Haring J, Perlman S. CD4 T-cell-mediated demyelination is increased in the absence of gamma interferon in mice infected with mouse hepatitis virus. J Virol. 2002;76:7329–7333. doi: 10.1128/JVI.76.14.7329-7333.2002. [DOI] [PMC free article] [PubMed] [Google Scholar]
- 19.Pewe LL, Perlman S. CD8 T cell-mediated demyelination is IFN-γ dependent in mice infected with a neurotropic coronavirus. J. Immunol. 2002;168:1547–1551. doi: 10.4049/jimmunol.168.4.1547. [DOI] [PubMed] [Google Scholar]
- 20.Stohlman SA, Hinton DR. Viral induced demyelination. Brain Pathol. 2001;11:92–106. doi: 10.1111/j.1750-3639.2001.tb00384.x. [DOI] [PMC free article] [PubMed] [Google Scholar]
- 21.Templeton SP, Perlman S. Pathogenesis of acute and chronic central nervous system infection with variants of mouse hepatitis virus, strain JHM. Immunol Res. 2007;39:160–172. doi: 10.1007/s12026-007-0079-y. [DOI] [PMC free article] [PubMed] [Google Scholar]
- 22.Anghelina D, Zhao J, Trandem K, Perlman S. Role of regulatory T cells in coronavirus-induced acute encephalitis. Virology. 2009;385:358–367. doi: 10.1016/j.virol.2008.12.014. [DOI] [PMC free article] [PubMed] [Google Scholar]
- 23.Williams RK, Jiang G, Holmes KV. Receptor for mouse hepatitis virus is a member of the carcinoembryonic antigen family of glycoproteins. Proc. Natl. Acad. Sci., USA. 1991;88:5533–5536. doi: 10.1073/pnas.88.13.5533. [DOI] [PMC free article] [PubMed] [Google Scholar]
- 24.Olivares-Villagomez D, Wang Y, Lafaille JJ. Regulatory CD4(+) T cells expressing endogenous T cell receptor chains protect myelin basic protein-specific transgenic mice from spontaneous autoimmune encephalomyelitis. J Exp Med. 1998;188:1883–1894. doi: 10.1084/jem.188.10.1883. [DOI] [PMC free article] [PubMed] [Google Scholar]
- 25.Kohm AP, Carpentier PA, Anger HA, Miller SD. Cutting edge: CD4+CD25+ regulatory T cells suppress antigen-specific autoreactive immune responses and central nervous system inflammation during active experimental autoimmune encephalomyelitis. J Immunol. 2002;169:4712–4716. doi: 10.4049/jimmunol.169.9.4712. [DOI] [PubMed] [Google Scholar]
- 26.Huan J, Culbertson N, Spencer L, Bartholomew R, Burrows GG, Chou YK, Bourdette D, Ziegler SF, Offner H, Vandenbark AA. Decreased FOXP3 levels in multiple sclerosis patients. J Neurosci Res. 2005;81:45–52. doi: 10.1002/jnr.20522. [DOI] [PubMed] [Google Scholar]
- 27.Viglietta V, Baecher-Allan C, Weiner HL, Hafler DA. Loss of functional suppression by CD4+CD25+ regulatory T cells in patients with multiple sclerosis. J Exp Med. 2004;199:971–979. doi: 10.1084/jem.20031579. [DOI] [PMC free article] [PubMed] [Google Scholar]
- 28.Korn T, Reddy J, Gao W, Bettelli E, Awasthi A, Petersen TR, Backstrom BT, Sobel RA, Wucherpfennig KW, Strom TB, Oukka M, Kuchroo VK. Myelin-specific regulatory T cells accumulate in the CNS but fail to control autoimmune inflammation. Nat Med. 2007;13:423–431. doi: 10.1038/nm1564. [DOI] [PMC free article] [PubMed] [Google Scholar]
- 29.Stephens LA, Malpass KH, Anderton SM. Curing CNS autoimmune disease with myelin-reactive Foxp3+ Treg. Eur J Immunol. 2009;39:1108–1117. doi: 10.1002/eji.200839073. [DOI] [PubMed] [Google Scholar]
- 30.O’Connor R,A, Malpass KH, Anderton SM. The inflamed central nervous system drives the activation and rapid proliferation of foxp3+ regulatory T cells. J Immunol. 2007;179:958–966. doi: 10.4049/jimmunol.179.2.958. [DOI] [PubMed] [Google Scholar]
- 31.Perlman S, Schelper R, Bolger E, Ries D. Late onset, symptomatic, demyelinating encephalomyelitis in mice infected with MHV-JHM in the presence of maternal antibody. Microb Pathog. 1987;2:185–194. doi: 10.1016/0882-4010(87)90020-9. [DOI] [PMC free article] [PubMed] [Google Scholar]
- 32.Pewe L, Heard SB, Bergmann C, Dailey MO, Perlman S. Selection of CTL escape mutants in mice infected with a neurotropic coronavirus: quantitative estimate of TCR diversity in the infected central nervous system. J Immunol. 1999;163:6106–6113. [PubMed] [Google Scholar]
- 33.Kruse N, Pette M, Toyka K, Rieckmann P. Quantification of cytokine mRNA expression by RT PCR in samples of previously frozen blood. J Immunol Methods. 1997;210:195–203. doi: 10.1016/s0022-1759(97)00188-9. [DOI] [PubMed] [Google Scholar]
- 34.Templeton SP, Kim TS, O’Malley K, Perlman S. Maturation and localization of macrophages and microglia during infection with a neurotropic murine coronavirus. Brain Pathol. 2008;18:40–51. doi: 10.1111/j.1750-3639.2007.00098.x. [DOI] [PMC free article] [PubMed] [Google Scholar]
- 35.Xue S, Sun N, Van Rooijen N, Perlman S. Depletion of blood-borne macrophages does not reduce demyelination in mice infected with a neurotropic coronavirus. J Virol. 1999;73:6327–6334. doi: 10.1128/jvi.73.8.6327-6334.1999. [DOI] [PMC free article] [PubMed] [Google Scholar]
- 36.Wang FI, Hinton DR, Gilmore W, Trousdale MD, Fleming JO. Sequential infection of glial cells by the murine hepatitis virus JHM strain (MHV-4) leads to a characteristic distribution of demyelination. Lab Invest. 1992;66:744–754. [PubMed] [Google Scholar]
- 37.Wu GF, Perlman S. Macrophage infiltration, but not apoptosis, is correlated with immune-mediated demyelination following murine infection with a neurotropic coronavirus. J. Virol. 1999;73:8771–8780. doi: 10.1128/jvi.73.10.8771-8780.1999. [DOI] [PMC free article] [PubMed] [Google Scholar]
- 38.Shen S, Ding Y, Tadokoro CE, Olivares-Villagomez D, Camps-Ramirez M, Curotto de Lafaille MA, Lafaille JJ. Control of homeostatic proliferation by regulatory T cells. J Clin Invest. 2005;115:3517–3526. doi: 10.1172/JCI25463. [DOI] [PMC free article] [PubMed] [Google Scholar]
- 39.Kim TS, Perlman S. Viral expression of CCL2 is sufficient to induce demyelination in RAG1−/− mice infected with a neurotropic coronavirus. J Virol. 2005;79:7113–7120. doi: 10.1128/JVI.79.11.7113-7120.2005. [DOI] [PMC free article] [PubMed] [Google Scholar]
- 40.Chen BP, Kuziel WA, Lane TE. Lack of CCR2 results in increased mortality and impaired leukocyte activation and trafficking following infection of the central nervous system with a neurotropic coronavirus. J Immunol. 2001;167:4585–4592. doi: 10.4049/jimmunol.167.8.4585. [DOI] [PubMed] [Google Scholar]
- 41.Pasare C, Medzhitov R. Toll pathway-dependent blockade of CD4+CD25+ T cell-mediated suppression by dendritic cells. Science. 2003;299:1033–1036. doi: 10.1126/science.1078231. [DOI] [PubMed] [Google Scholar]
- 42.Estes JD, Li Q, Reynolds MR, Wietgrefe S, Duan L, Schacker T, Picker LJ, Watkins DI, Lifson JD, Reilly C, Carlis J, Haase AT. Premature induction of an immunosuppressive regulatory T cell response during acute simian immunodeficiency virus infection. J Infect Dis. 2006;193:703–712. doi: 10.1086/500368. [DOI] [PubMed] [Google Scholar]
- 43.Andersson J, Boasso A, Nilsson J, Zhang R, Shire NJ, Lindback S, Shearer GM, Chougnet CA. The prevalence of regulatory T cells in lymphoid tissue is correlated with viral load in HIV-infected patients. J Immunol. 2005;174:3143–3147. doi: 10.4049/jimmunol.174.6.3143. [DOI] [PubMed] [Google Scholar]
- 44.Suffia IJ, Reckling SK, Piccirillo CA, Goldszmid RS, Belkaid Y. Infected site-restricted Foxp3+ natural regulatory T cells are specific for microbial antigens. J Exp Med. 2006;203:777–788. doi: 10.1084/jem.20052056. [DOI] [PMC free article] [PubMed] [Google Scholar]
- 45.Tang Q, Henriksen KJ, Bi M, Finger EB, Szot G, Ye J, Masteller EL, McDevitt H, Bonyhadi M, Bluestone JA. In vitro-expanded antigen-specific regulatory T cells suppress autoimmune diabetes. J Exp Med. 2004;199:1455–1465. doi: 10.1084/jem.20040139. [DOI] [PMC free article] [PubMed] [Google Scholar]
- 46.Pandiyan P, Zheng L, Ishihara S, Reed J, Lenardo MJ. CD4+CD25+Foxp3+ regulatory T cells induce cytokine deprivation-mediated apoptosis of effector CD4+ T cells. Nat Immunol. 2007;8:1353–1362. doi: 10.1038/ni1536. [DOI] [PubMed] [Google Scholar]
- 47.Vercoulen Y, Wehrens EJ, van Teijlingen NH, de Jager W, Beekman JM, Prakken BJ. Human regulatory T cell suppressive function is independent of apoptosis induction in activated effector T cells. PLoS One. 2009;4:e7183. doi: 10.1371/journal.pone.0007183. [DOI] [PMC free article] [PubMed] [Google Scholar]
- 48.Izcue A, Coombes JL, Powrie F. Regulatory T cells suppress systemic and mucosal immune activation to control intestinal inflammation. Immunol Rev. 2006;212:256–271. doi: 10.1111/j.0105-2896.2006.00423.x. [DOI] [PubMed] [Google Scholar]
- 49.Anghelina D, Pewe L, Perlman S. Pathogenic role for virus-specific CD4 T cells in mice with coronavirus-induced acute encephalitis. Am J Pathol. 2006;169:209–222. doi: 10.2353/ajpath.2006.051308. [DOI] [PMC free article] [PubMed] [Google Scholar]