

Abstract
Sensory experience in early life shapes the mammalian brain. An impairment in the activity-dependent refinement of functional connections within developing visual cortex was identified here in a mouse model. Gene-targeted disruption of one isoform of glutamic acid decarboxylase prevented the competitive loss of responsiveness to an eye briefly deprived of vision, without affecting cooperative mechanisms of synapse modification in vitro. Selective, use-dependent enhancement of fast intracortical inhibitory transmission with benzodiazepines restored plasticity in vivo, rescuing the genetic defect. Specific networks of inhibitory interneurons intrinsic to visual cortex may detect perturbations in sensory input to drive experience-dependent plasticity during development.
After even a brief period of monocular occlusion in early life, input to visual cortex from the closed eye is functionally weakened, then anatomically reduced in size (1). How perturbed levels of neuronal activity are detected to produce changes in connectivity within cortex remains unknown. Inhibitory interactions between inputs may play a role (2), as supported by the profound effects on cortical activity of pharmacologically manipulating γ-aminobutyric acid (GABA) receptors during a period of monocular deprivation. GABAA agonists induce a robust reverse shift in favor of the deprived eye (3), whereas antagonists provide mixed results, disrupting plasticity in some cases but yielding no effect under other conditions sufficient to produce continuous epileptiform activity (4). Moreover, these gross drug treatments that shut down or hyperexcite the cortex offer little insight into the normal function of intrinsic networks of inhibitory interneurons during visual cortical plasticity.
Mouse models deficient in the enzymes that produce GABA provide an opportunity to address the role of endogenous inhibitory transmission in cortical plasticity. Distinct genes encode two isoforms of the GABA-synthesizing enzyme, glutamic acid decarboxylase (GAD). The larger 67-kD protein (GAD67) is localized to cell somata and dendrites, providing a constitutive concentration of GABA throughout the cell by a transporter release mechanism (5). In the absence of GAD67, mice die at birth with GABA concentrations less than 10% of those found in the brains of wild-type littermates (6). The 65-kD isoform (GAD65) is found primarily in the synaptic terminal (7), where it is anchored to vesicles and serves as a reservoir of inactive GAD that can be recruited when additional GABA synthesis is required (8). The smaller isoform of GAD may therefore be specialized to respond to rapid changes in synaptic demand during intense neuronal activity.
We hypothesized that a loss of the GAD65 isoform would selectively reduce fast, intrinsic inhibitory transmission. The deleterious pathology of completely blocking GABAergic synapses pharmacologically could thus be avoided. Indeed, mice carrying a targeted disruption of the GAD65 gene (GAD65 KO mice) survive and develop typical gross cortical morphology and normal adult GABA concentrations because the expression of GAD67 is unaltered (9). Biochemical analysis of various brain regions (Fig. 1A) revealed that unlike in the adult, GAD65 contributes significantly to total GABA concentrations during early post-natal development (10). Consistent with our results, GAD65 expression is elevated in wild-type (WT) animals younger than 3 weeks of age during periods of active synaptogenesis (11). To determine whether the stimulated release of GABA is in fact compromised by loss of the GAD65 protein, we used microdialysis to directly monitor GABA output from the binocular zone of visual cortex in vivo (12). Although the basal extracellular concentrations were stable and similar between mutant and wild-type mice, maximal GABA release in response to a brief high-potassium depolarization was significantly reduced in GAD65 KO mice (Fig. 1B).
Fig. 1.
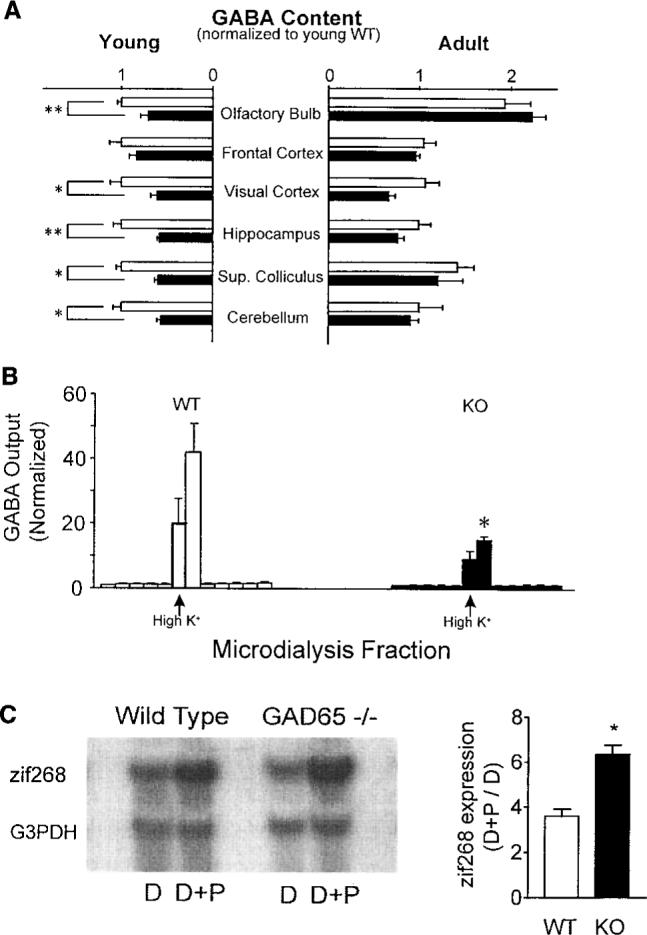
(A) GABA content in isolated homogenates of young (P18−19; eight WT and six GAD65 KO mice) and adult brains (>5 months old; six WT and four KO mice), normalized to young WT values by region. Open (WT) and solid (KO) bars represent means ± SEM (*P < 0.05, **P < 0.005; t test). (B) Maximal GABA output from WT and GAD65 KO binocular zone in response to brief depolarizing stimuli (100 mM KCl, arrow; three mice, each >P27; *P < 0.05, t test). Columns are individual 30-min dialysis fractions ± SEM normalized to mean before high K+ perfusion (basal GABA ± SD = 0.18 ± 0.02 pmol per fraction for WT, 0.22 ± 0.11 pmol per fraction for KO). (C) Expression of activity-dependent immediate-early gene zif268 in P28 visual cortex by 90 min of photostimulation (D+P) after 5 days of dark-rearing (D). Northern blots were normalized to housekeeping gene G3PDH (left panel). Sensitivity to visual stimulation in WT and KO mice is shown as (D+P)/D zif268 expression ratio (right panel, mean ± SEM, three mice each; *P < 0.01, t test).
A physiological consequence of GAD65 deficiency in the visual cortex was enhanced activation in response to visual stimulation. Neurons modulate the expression of certain immediate-early genes in response to sensory stimuli (13). GAD65 KO mice at the peak of the critical period for plasticity exhibited a supernormal sensitivity to visual stimulation after an initial period of dark-rearing (Fig. 1C), as assessed with the use of zif268 expression as an endogenous marker of neuronal activity (14). Extracellular single-unit recordings (15) from the binocular zone of visual cortex lacking GAD65 in vivo further revealed a tendency for prolonged discharge only as light-bar stimuli exited the cell's receptive field (Fig. 2A). However, this did not appear to affect the development of all other visual parameters tested, including spontaneous activity, habituation, retinotopic organization, orientation and direction selectivity, or receptive field size (Fig. 2, B and C).
Fig. 2.

(A) Prolonged discharge of single-unit activity after visual stimulation in extracellular recordings from GAD65 KO visual cortex. Upper panel: Raster plot of spike response to four sweeps each of computer-generated light-bar stimuli moving across the visual field (5 °/s) in opposite directions (90° and 270°). Trials were randomly interleaved with periods of no stimulus presentation (Spont.). Despite crisp spike onset, neuronal response continued beyond the outer edge of the presumptive receptive field (RF), as defined by stimuli moving in the opposite direction. Lower panel: Proportions of WT and KO cells exhibiting prolonged discharge to stimuli exiting their RF (n = 670 and 1112 cells, 28 and 45 mice, respectively; P < 0.0001, t test). (B) Retinotopic organization of WT (open squares) and GAD65 KO (solid diamonds) primary visual cortex. RF-center azimuths are plotted versus electrode position relative to vertical meridian. Inset: Correlation coefficients for three WT and four KO regressions (P = 0.2, t test). (C) RF size (left panel, 82 WT and 79 KO cells; P = 0.1, t test) and proportion of cells exhibiting preference for light-bar stimuli of particular orientation (right panel, n = 670 and 1112 cells, 28 WT and 45 KO mice, respectively; P = 0.3, t test).
The effects of monocular deprivation result from the competitive interaction between left and right eye inputs that first converge at the level of the primary visual cortex (1). The distribution of ocular dominance in the binocular zone of GAD65 KO mice was identical to that of wild-type mice (Fig. 3, A and B, left panels). The response to a 4-day period of monocular vision beginning between postnatal day 25 (P25) and P27 was, however, strikingly different. Wild-type cells shifted their responsiveness in favor of the open eye, as expected (Fig. 3A). Mice lacking GAD65 showed no change in eye preference after deprivation, and cells continued to respond better to contralateral eye input (Fig. 3B).
Fig. 3.
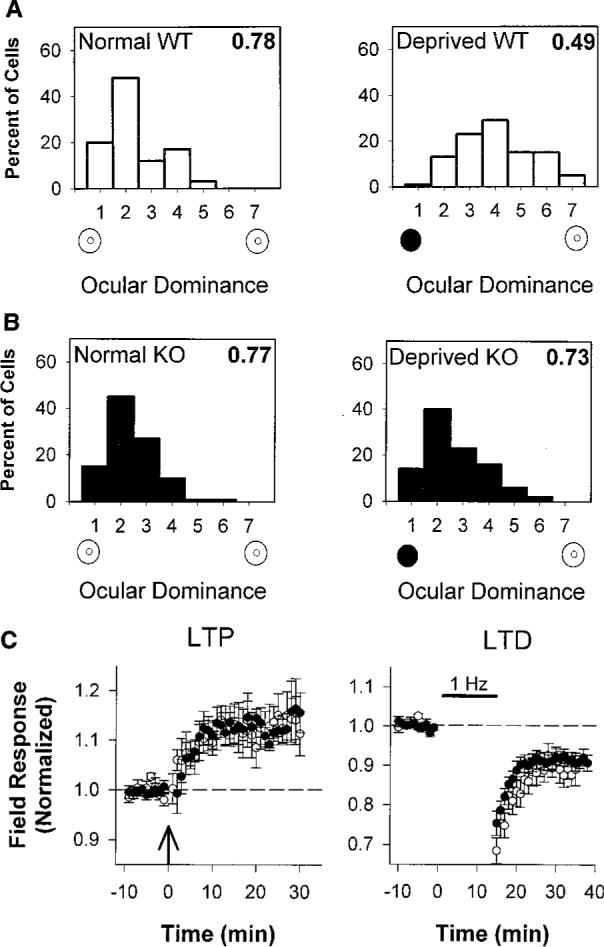
(A) Ocular dominance scores for WT mice were normally skewed in favor of the contralateral eye (left panel, 66 cells, three mice). Four days of monocular eyelid suture (solid circle) during the critical period shifted ocular dominance toward the open, ipsilateral eye (open circle), yielding a balanced distribution (right panel, 132 cells, six mice; P < 0.0001, χ2 test). Plasticity in rodents is less pronounced than in other mammals (24). (B) Ocular dominance distribution of nondeprived GAD65 KO mice is similar to WT (left panel, 99 cells, five mice; P = 0.2, χ2 test). Four days of monocular vision yielded no shift in favor of the open eye (right panel, 108 cells, five mice; P = 0.4 vs. normal KO and P < 0.0001 vs. deprived WT, χ2 test). As an indicator of the relative response to the two eyes, the CBI (16), shown in the upper right corner of each distribution, takes values of 0 and 1 for complete ipsilateral or contralateral eye dominance, respectively. (C) LTP and LTD in WT (open circles) and KO (solid circles) visual cortical slices after theta-burst (left panel) or low-frequency (1 Hz, right panel) stimulation, respectively [8 slices, seven mice from each group (LTP) and 7 slices, six WT and seven KO mice (LTD); P = 0.2 for both comparisons at 20 min, t test].
To determine whether GAD65 KO mice carried a general defect in activity-dependent plasticity, we prepared coronal slices of visual cortex and assayed long-term depression (LTD) and potentiation (LTP) in layer 2/3 of the binocular zone (16). Both wild-type and mutant synaptic responses were persistently potentiated or depressed for periods of up to 1 hour after theta-burst or low-frequency stimulation, respectively (Fig. 3C). These simple correlation-based LTP-LTD paradigms (17) thus failed to predict the immunity to sensory disruption in the intact GAD65 KO mice. Other forms of synapse modification in vitro may better correlate with competitive plasticity in vivo.
The cortical plasticity defect in vivo could have been due to a developmental alteration of the cortical circuit or its plasticity machinery, caused by the lack of GAD65 earlier in development. Alternatively, the absence of plasticity might be an acute consequence of the reduction of cortical inhibition during the critical period. We thus attempted to rescue the plasticity defect in vivo by briefly enhancing inhibition in mutant animals. The postsynaptic impact of reduced GABA release could be compensated with benzodiazepine agonists. These drugs increase the open probability and channel conductance of GABAA receptors selectively in a use-dependent manner, as they are inert in the absence of synaptic GABA release (18). Moreover, benzodiazepine binding sites are associated with intrinsic cortical elements rather than with thalamocortical axons or other subcortical inputs (19).
To identify the precise locus where rapid GABAergic transmission is required for plasticity in vivo, we administered diazepam locally into one hemisphere of the brains of the mutant mice during a period of monocular eyelid suture. The localization of diazepam to the infused visual cortex was biochemically confirmed (20), whereas it remained virtually undetectable in the adjacent temporal cortex, frontal regions, or opposite hemisphere (Fig. 4A, left). Monocular deprivation produced a complete ocular dominance shift in the infused mutant visual cortex (Fig. 4A, right), whereas no rescue of plasticity was observed by administering vehicle solutions in the same side or diazepam into the opposite hemisphere (Fig. 4B). Global diazepam treatment by intraventricular injection during a concurrent 4-day monocular deprivation also restored plasticity to GAD65 KO mice comparable to that of the wild-type mice [contralateral bias index (CBI) = 0.47 ± 0.03 versus 0.43 ± 0.03; 103 and 109 cells, 5 KO and 6 WT animals, respectively; P = 0.4, t test] (15). Taken together, fast inhibitory transmission via GABAA-mediated circuitry intrinsic to visual cortex is both necessary and sufficient to detect an imbalance in activity between competing inputs from the two eyes, and had not been irreparably damaged by GAD65 deletion.
Fig. 4.
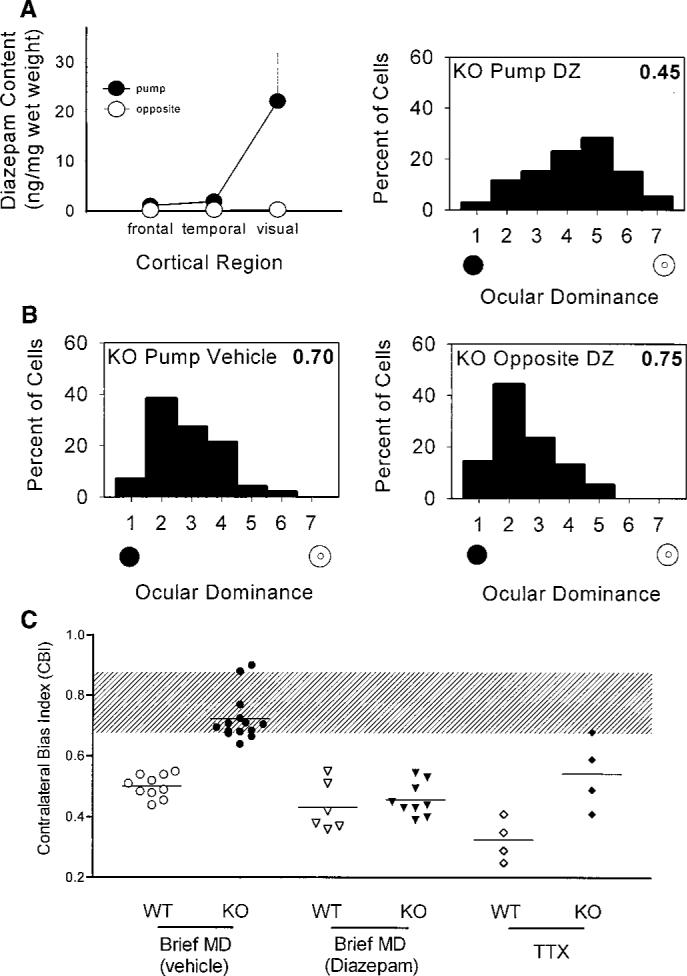
(A) Local diazepam treatment of visual cortex restores plasticity to GAD65 KO mice in vivo. Left panel: Directed infusion restricted diazepam from regions beyond the visual cortex ipsilateral to the cannula (solid circles), as well as throughout the opposite hemisphere (open circles, mean ± SEM, three mice). Right panel: Ocular dominance shifted fully in the KO binocular zone exposed to diazepam concurrent with a brief period of monocular deprivation during the critical period (114 cells, four mice; P < 0.0001, χ2 test vs. nondeprived KO; compare with Fig. 3B). (B) Neither vehicle treatment (left panel, 99 cells, four mice; P < 0.0001, χ2 test vs. diazepam KO above) nor diazepam infusion into the hemisphere opposite the recording site (right panel, 77 cells, three mice; P < 0.0001, χ2 test vs. diazepam KO above) restored the effect of monocular deprivation to GAD65 KO mice. (C) Monocular T TX injections for 4 days during the critical period produced significantly less plasticity in KO than in WT mice (P < 0.05, t test). Untreated and vehicle-treated monocularly deprived (MD) mice are grouped together, as are ventricle- and cortex-infused diazepam-treated animals. Shaded region indicates the range of nondeprived CBIs for both WT and KO mice. Each symbol represents one animal.
If intracortical inhibition determines the threshold for detecting competition, then the residual GABA found in visual cortex lacking GAD65 (Fig. 1) should allow limited plasticity with an extreme imbalance of input. We maximized the contrast between excitatory input from the two eyes by completely silencing the retinal activity of one eye with tetrodotoxin (TTX) injections for 4 days during the critical period (16). A significantly stronger ocular dominance shift was observed with TTX than with monocular eyelid suture in wild-type mice (mean CBI = 0.33 ± 0.04 versus 0.49 ± 0.02; 4 and 10 mice, respectively; P < 0.001, t test). This drastic imbalance in input activity produced detectable changes in only some GAD65 KO mice [mean CBI = 0.54 ± 0.06; 4 mice (21)], significantly weaker than in wild-type animals (P < 0.05, t test) and more variable than in deprived mutants receiving diazepam (Fig. 4C).
Local cortical circuits may then instruct the reorganization of both intra- and thalamocortical connections that are known to accompany monocular deprivation (1). A delicately balanced recruitment of excitation and inhibition detects the disparity between competing sensory inputs and drives experience-dependent changes in visual cortex. Complete restoration of plasticity in GAD65 KO mice was achieved by use-dependent potentiation of GABAA responses that produced only a modest, albeit significant, reduction of undamped recurrent excitation (54 ± 7% versus 74 ± 5% of cells exhibiting prolonged discharge, 18 diazepam-treated and 45 untreated mice; P < 0.03, t test). Molecular cues [such as neurotrophins (22)] must be exquisitely tuned to spatiotemporal patterns of activity for subtle modulation of stimulated GABA release to have such profound effects on plasticity. Notably, the diffuse activation of GABAA receptors with muscimol to silence cortical activity reverses plasticity (3), whereas the selective enhancement of intrinsic inhibitory transmission with diazepam sharpens it even in wild-type animals (Fig. 4C). Competitive refinement of visual cortex thus requires a threshold level of GABAergic transmission, making it fundamentally different from LTP or LTD models that are impeded by inhibition (23) and consistent with recent evidence dissociating in vivo from in vitro plasticity (24).
The many cortical interneuron subtypes operate and mature in a lamina-specific fashion (25) while responding differentially to monocular deprivation, neuromodulators, and input from other GABAergic cells (26). Only a specific subset of this extremely elaborated network may sculpt cortical activity to define the connections that will undergo refinement. GAD65 localizes preferentially to GABAergic terminals targeted to dendrites rather than to cell somata (8, 27). Moreover, fast (GABAA) or slow (GABAB) synaptic inhibition may originate from morphologically distinct classes of interneuron (28). Diazepam rescue of plasticity in GAD65 mutants focuses attention on GABAA connections with appropriate subunit composition for benzodiazepine binding (20). We have identified an animal model in which plasticity of the intact visual cortex is robustly disrupted. Our findings provide a tool for dissecting the unique local circuit properties that drive experience-dependent plasticity.
References and Notes
- 1.Wiesel TN, Hubel DH. J. Neurophysiol. 1963;26:1003. doi: 10.1152/jn.1963.26.6.1003. [DOI] [PubMed] [Google Scholar]; Olson CR, Freeman RD. ibid. 1975;38:26. doi: 10.1152/jn.1975.38.1.26. [DOI] [PubMed] [Google Scholar]; Shatz CJ, Stryker MP, Physiol J. 1978;281:267. doi: 10.1113/jphysiol.1978.sp012421. [DOI] [PMC free article] [PubMed] [Google Scholar]; Antonini A, Stryker MP. Science. 1993;260:1819. doi: 10.1126/science.8511592. [DOI] [PubMed] [Google Scholar]; Shatz CJ. Neuron. 1990;5:745. doi: 10.1016/0896-6273(90)90333-b. [DOI] [PubMed] [Google Scholar]
- 2.Kratz KE, Spear PD, Smith DC. J. Neurophysiol. 1976;39:501. doi: 10.1152/jn.1976.39.3.501. [DOI] [PubMed] [Google Scholar]; Duffy FH, Snodgrass SR, Burchfiel JR, Conway JL. Nature. 1976;260:256. doi: 10.1038/260256a0. [DOI] [PubMed] [Google Scholar]; Blakemore C, Hawken MJ. J. Physiol. (London) 1982;327:463. doi: 10.1113/jphysiol.1982.sp014243. [DOI] [PMC free article] [PubMed] [Google Scholar]; Sillito AM, Kemp JA, Blakemore C. Nature. 1981;291:318. doi: 10.1038/291318a0. [DOI] [PubMed] [Google Scholar]; Mower GD, Christen WG. Dev. Brain Res. 1989;45:211. doi: 10.1016/0165-3806(89)90040-0. [DOI] [PubMed] [Google Scholar]
- 3.Reiter HO, Stryker MP. Proc. Natl. Acad. Sci. U.S.A. 1988;85:3623. doi: 10.1073/pnas.85.10.3623. [DOI] [PMC free article] [PubMed] [Google Scholar]; Hata Y, Stryker MP. Science. 1994;265:1732. doi: 10.1126/science.8085163. [DOI] [PubMed] [Google Scholar]
- 4.Ramoa AS, Paradiso MA, Freeman RD. Exp. Brain Res. 1988;73:285. doi: 10.1007/BF00248220. [DOI] [PubMed] [Google Scholar]; Videen TO, Daw NW, Collins RC. Brain Res. 1986;371:1. doi: 10.1016/0006-8993(86)90803-6. [DOI] [PubMed] [Google Scholar]
- 5.Erlander MG, Tillakaratne NJK, Feldblum S, Patel N, Tobin AJ. Neuron. 1991;7:91. doi: 10.1016/0896-6273(91)90077-d. [DOI] [PubMed] [Google Scholar]; Feldblum S, Erlander MG, Tobin AJ. J. Neurosci. Res. 1993;34:689. doi: 10.1002/jnr.490340612. [DOI] [PubMed] [Google Scholar]; Kaufman DL, Houser CR, Tobin AJ. J. Neurochem. 1991;56:720. doi: 10.1111/j.1471-4159.1991.tb08211.x. [DOI] [PMC free article] [PubMed] [Google Scholar]
- 6.Asada H, et al. Proc. Natl. Acad. Sci. U.S.A. 1997;94:6496. doi: 10.1073/pnas.94.12.6496. [DOI] [PMC free article] [PubMed] [Google Scholar]; Condie BG, Bain G, Gottlieb DI, Capecchi MR. ibid. :11451. doi: 10.1073/pnas.94.21.11451. [DOI] [PMC free article] [PubMed] [Google Scholar]
- 7.Guo Y, Kaplan IV, Cooper NGF, Mower GD. Dev. Brain Res. 1997;103:127. doi: 10.1016/s0165-3806(97)81789-0. [DOI] [PubMed] [Google Scholar]; Fukuda T, Aika Y, Heizmann CW, Kosaka T. J. Comp. Neurol. 1998;395:177. doi: 10.1002/(sici)1096-9861(19980601)395:2<177::aid-cne3>3.0.co;2-#. [DOI] [PubMed] [Google Scholar]
- 8.Reetz A, et al. EMBO J. 1991;10:1275. doi: 10.1002/j.1460-2075.1991.tb08069.x. [DOI] [PMC free article] [PubMed] [Google Scholar]; Martin DL, Martin SB, Wu SJ, Espina N. J. Neurosci. 1991;11:2725. doi: 10.1523/JNEUROSCI.11-09-02725.1991. [DOI] [PMC free article] [PubMed] [Google Scholar]
- 9.Asada H, et al. Biochem. Biophys. Res. Commun. 1996;229:891. doi: 10.1006/bbrc.1996.1898. [DOI] [PubMed] [Google Scholar]; Kash SF, et al. Proc. Natl. Acad. Sci. U.S.A. 1997;94:14060. doi: 10.1073/pnas.94.25.14060. [DOI] [PMC free article] [PubMed] [Google Scholar]
- 10.Mataga N, Imamura K, Watanabe Y. Brain Res. 1991;551:61. doi: 10.1016/0006-8993(91)90914-h. Mice carrying a functional disruption of GAD65 were generated by insertion of a neomycin-resistance cassette into exon 1 of the gene on the C57BL/6 background, as described (9). Homogenates of various brain regions prepared from mice at different ages were analyzed for GABA content using high-performance liquid chromatography (HPLC; Eicom) with fluorescence detection (excitation, 340 nm; emission, 440 nm; L-1000, Hitachi) after ophthaldialdehyde (OPA) reagent derivatization by a computer-controlled autoinjector with column switching (CMA 200). Amino acids were separated on a Cosmosil 5C18 reversed-phase column (36°C; Nacalai Tesque, Japan). The mobile phase was 50 mM sodium acetate buffer with 25% acetonitrile (pH 5.9) [DOI] [PubMed] [Google Scholar]
- 11.Greif KF, Erlander MG, Tillakaratne NJK, Tobin AJ. Neurochem. Res. 1991;16:235. doi: 10.1007/BF00966086. [DOI] [PubMed] [Google Scholar]; Greif KF, et al. Dev. Biol. 1992;153:158. doi: 10.1016/0012-1606(92)90100-u. [DOI] [PubMed] [Google Scholar]
- 12.or extracellular GABA measurements in vivo, mice (>P27) were mounted on a stereotactic frame, and a microdialysis probe (membrane length 1 mm; CMA 11, CMA/Microdialysis AB, Sweden) was implanted into the binocular region of visual cortex. Artificial cerebrospinal fluid (ACSF) was perfused (1.0 μl/min) and samples were taken every 30 min for GABA analysis (10) using a microfraction collector (CMA 140). ACSF contained 119 mM NaCl, 2.5 mM KCl, 1.3 mM MgSO4, 1.0 mM NaH2PO4, 26.2 mM NaHCO3, 2.5 mM CaCl2, and 11 mM glucose. After equilibration (60 min), five or six basal values were collected, then ACSF containing 100 mM KCl was perfused for 30 min, followed by five or six recovery samples. Dead volume from probe output to fraction collector was 8.4 μl (∼8 min)
- 13.Kaczmarek L, Chaudhuri A. Brain Res. Rev. 1997;23:237. doi: 10.1016/s0165-0173(97)00005-2. [DOI] [PubMed] [Google Scholar]; Worley PF, et al. Proc. Natl. Acad. Sci. U.S.A. 1991;88:5106. [Google Scholar]
- 14.Mataga N, et al. Neurosci. Lett. 1996;218:149. doi: 10.1016/s0304-3940(96)13139-6. WT and KO mice (six animals each) were reared in total darkness for 5 days at the peak of the critical period (P23−28). The mice in the dark-reared group were killed immediately in the dark room, and the remainder were exposed to light from a photostimulator (1 Hz, 20 J, 90 min; NEC). Northern (RNA) blot analysis for zif268 expression in the binocular zone was performed as described. quantified by densitometer (Molecular Dynamics), and normalized to the housekeeping gene G3PDH. [DOI] [PubMed] [Google Scholar]
- 15.Gordon JA, Stryker MP. J. Neurosci. 1996;16:3274. doi: 10.1523/JNEUROSCI.16-10-03274.1996. Mice were prepared blind to genotype for electrophysiological recording in vivo under Nembutal (50 mg/kg, Abbot)/chlorprothixene (0.2 mg, Sigma) anesthesia using standard techniques (24) For each animal, five to eight cells (>75 μm apart) were recorded in each of four to six vertical penetrations spaced evenly (>200 μm intervals) across the mediolateral extent of primary visual cortex to map the monocular and binocular zones and avoid sampling bias. Receptive fields of isolated single units were plotted on a tangent screen with a hand-held projection lamp or computer-generated stimuli. Cells were assigned ocular dominance scores according to the seven-point classification scheme of Hubel and Wiesel (1). A weighted average of the bias toward one eye or the other, the CBI, was calculated for each binocular zone according to the formula CBI = [(n1 − n7) + (2/3)(n2 − n6) + (1/3)(n3 − n5) + N]/2N, where N is the total number of cells and nx is the number of cells with an ocular dominance score equal to x. For monocular deprivation experiments, eyelid margins were trimmed and sutured under halothane anesthesia at the peak of the critical period (for 4 days beginning at P25−27). In other cases, repeated intraocular injections (<350 nl) of TTX (3 mg/ml, Sankyo) or citrate vehicle (0.5%, Sigma) solution were made into one eye. TTX efficacy was confirmed by pupil dilation over a 4-day period. All recordings were contralateral to the deprived eye. [DOI] [PMC free article] [PubMed] [Google Scholar]
- 16.Coronal slices (400 mm) through the binocular zone were prepared blind to genotype during the critical period for monocular deprivation effects (P24−33) and maintained at 33°C in oxygenated ACSF (95% O2/5% CO2; pH 7.4). Changes in the magnitude of extracellular field potential peak amplitude were recorded with a 1 M NaCl electrode (1 to 3 megohms) inserted into layer 2/3 in response to theta-burst or low-frequency (1 Hz) stimulation of layer 4, as described (24). Both size (half-maximal amplitude, >1 mV) and shape (half-width, <5 ms) of extracellular field potentials did not differ between genotypes and were routinely confirmed to be synaptic by glutamate receptor antagonists applied to the bath at the end of each experiment
- 17.Rauschecker JP. Physiol. Rev. 1991;71:587. doi: 10.1152/physrev.1991.71.2.587. [DOI] [PubMed] [Google Scholar]; Tsumoto T. Prog. Neurobiol. 1992;209:209. doi: 10.1016/0301-0082(92)90011-3. [DOI] [PubMed] [Google Scholar]; Kirkwood A, Rioult MG, Bear MF. Nature. 1996;381:526. doi: 10.1038/381526a0. [DOI] [PubMed] [Google Scholar]; Singer W. Science. 1995;270:758. doi: 10.1126/science.270.5237.758. [DOI] [PubMed] [Google Scholar]; Katz LC, Shatz CJ. ibid. 1996;274:1133. doi: 10.1126/science.274.5290.1133. [DOI] [PubMed] [Google Scholar]
- 18.Study RE, Barker JL. Proc. Natl. Acad. Sci. U.S.A. 1981;78:7180. doi: 10.1073/pnas.78.11.7180. [DOI] [PMC free article] [PubMed] [Google Scholar]; Tallman JF, Gallagher DW. Annu. Rev. Neurosci. 1984;8:21. doi: 10.1146/annurev.ne.08.030185.000321. [DOI] [PubMed] [Google Scholar]; MacDonald RL, Olsen RW. ibid. 1994;17:569. doi: 10.1146/annurev.ne.17.030194.003033. [DOI] [PubMed] [Google Scholar]; Rogers CJ, Twyman RE, MacDonald RL. J. Physiol. (London) 1994;475:69. doi: 10.1113/jphysiol.1994.sp020050. [DOI] [PMC free article] [PubMed] [Google Scholar]; Eghbali M, Curmi JP, Birnir B, Gage PW. Nature. 1997;388:71. doi: 10.1038/40404. [DOI] [PubMed] [Google Scholar]
- 19.Shaw C, Aoki C, Wilkinson M, Prusky G, Cynader M. Dev. Brain Res. 1987;37:67. doi: 10.1016/0165-3806(87)90229-x. [DOI] [PubMed] [Google Scholar]; Xiang Z, Huguenard JR, Prince DA. J. Physiol. (London) 1998;506:715. doi: 10.1111/j.1469-7793.1998.715bv.x. [DOI] [PMC free article] [PubMed] [Google Scholar]; Sigel E, Buhr A. Trends Pharmacol. Sci. 1997;18:425. doi: 10.1016/s0165-6147(97)01118-8. [DOI] [PubMed] [Google Scholar]; Costa E. Annu. Rev. Pharmacol. Toxicol. 1998;38:321. doi: 10.1146/annurev.pharmtox.38.1.321. [DOI] [PubMed] [Google Scholar]
- 20.Berrueta LA, Gallo B, Vicente F. J. Pharm. Biomed. Anal. 1992;10:109. doi: 10.1016/0731-7085(92)80019-j. In rescue experiments, either diazepam (2 mg/ml, Wako) or vehicle (50% propylene glycol, Wako) solution was injected daily into the ventricles (1.5 μl each side) beginning 1 or 2 days before and concurrent with 4 days of monocular deprivation. A >100-fold saturating dose of diazepam was determined by recording GABAA responses in visual cortical slices (16), then infused to ensure adequate drug diffusion in vivo. Local rescue was achieved with low-flow osmotic minipumps (0.5 μl/hour; Alzet 1007, Alza) containing drug or vehicle solution connected to cannulae (30 gauge) that were stereotactically implanted into one hemisphere under sterile surgical conditions 2 days before eyelid suture. Control experiments demonstrated that continuous infusion of TTX or dye solutions from osmotic minipumps could be restricted to ipsilateral visual cortex without disturbing the gross morphology of the binocular zone at least 1.5 mm away from the cannula tip. Drug was infused continuously for 4.5 hours at a high rate (3 μl/hour) to determine the spread of diazepam. In agreement with its known rapid breakdown in vivo. diazepam was not detectable after 1 week of pumping at low rates. A diazepam detection assay was developed using reversed-phase HPLC (UV detection at 240 nm) after organic extraction: Brain tissue (∼20 mg) was sonicated with ethyl acetate (400 μl) and centrifuged (8000g, 15 min), the supernatant extracted on a mechanical shaker (1 M tris-HCl, pH 9.0, 20 min), and the organic layer evaporated under a gentle N2 stream. The residue was reconstituted in ethyl acetate (100 μl) and back-extracted with 6 N HCl (40 μl); the aqueous phase was adjusted to neutral (3 M tris buffer, pH 11.6) and injected onto an HPLC apparatus. The mobile phase was 50 mM sodium phosphate buffer (pH 6.4) with 38% acetonitrile and 0.1% triethylamine. [DOI] [PubMed] [Google Scholar]
- 21.Similarly weak and variable plasticity was observed in GAD65 KO versus WT mice that had experienced deprivations spanning the entire critical period (P17−36), despite the longer temporal integration and potential additional contribution of anatomical changes to the functional disconnection of deprived eye input (1). CBI = 0.54 ± 0.04 versus 0.41 ± 0.02; six KO and four WT mice, respectively (P > 0.05, t test)
- 22.Zafra F, Castren E, Thoenen H, Lindholm D. Proc. Natl. Acad. Sci. U.S.A. 1991;88:10037. doi: 10.1073/pnas.88.22.10037. [DOI] [PMC free article] [PubMed] [Google Scholar]; Thoenen H. Science. 1995;270:593. doi: 10.1126/science.270.5236.593. [DOI] [PubMed] [Google Scholar]; McAllister AK, Lo DC, Katz LC. Neuron. 1996;17:1057. doi: 10.1016/s0896-6273(00)80239-1. [DOI] [PubMed] [Google Scholar]; Bonhoeffer T. Curr. Opin. Neurobiol. 1996;6:119. doi: 10.1016/s0959-4388(96)80017-1. [DOI] [PubMed] [Google Scholar]; Sala R, et al. Eur. J. Neurosci. 1998;10:2185. doi: 10.1046/j.1460-9568.1998.00227.x. [DOI] [PubMed] [Google Scholar]; Rutherford LC, Nelson SB, Turrigiano GG. Neuron. 1998;21:521. doi: 10.1016/s0896-6273(00)80563-2. [DOI] [PubMed] [Google Scholar]
- 23.Artola A, Singer W. Nature. 1987;330:649. doi: 10.1038/330649a0. [DOI] [PubMed] [Google Scholar]; Bear MF, Kirkwood A. Curr. Opin. Neurobiol. 1993;3:197. doi: 10.1016/0959-4388(93)90210-p. [DOI] [PubMed] [Google Scholar]; Dudek SM, Friedlander MJ. Neuron. 1996;16:1097. doi: 10.1016/s0896-6273(00)80136-1. [DOI] [PubMed] [Google Scholar]; Miller KD. ibid. 1996;17:371. doi: 10.1016/s0896-6273(00)80169-5. [DOI] [PubMed] [Google Scholar]
- 24.Hensch TK, Stryker MP. Science. 1996;272:554. doi: 10.1126/science.272.5261.554. [DOI] [PubMed] [Google Scholar]; Hensch TK, et al. J. Neurosci. 1998;18:2108. doi: 10.1523/JNEUROSCI.18-06-02108.1998. [DOI] [PMC free article] [PubMed] [Google Scholar]
- 25.DeFelipe J. Cereb. Cortex. 1993;3:273. doi: 10.1093/cercor/3.4.273. [DOI] [PubMed] [Google Scholar]; Gonchar Y, Burkhalter A. ibid. 1997;7:347. doi: 10.1093/cercor/7.4.347. [DOI] [PubMed] [Google Scholar]; Kang Y, Kaneko T, Ohishi H, Endo K, Araki T. J. Neurophysiol. 1994;71:280. doi: 10.1152/jn.1994.71.1.280. [DOI] [PubMed] [Google Scholar]; Van Brederode JFM, Spain WJ. ibid. 1995;74:1149. doi: 10.1152/jn.1995.74.3.1149. [DOI] [PubMed] [Google Scholar]; Luhmann HJ, Prince DA. ibid. 1991;65:247. doi: 10.1152/jn.1991.65.2.247. [DOI] [PubMed] [Google Scholar]; Komatsu Y. Dev. Brain Res. 1983;8:136. [Google Scholar]
- 26.Carder RK, Leclerc SS, Hendry SHC. Cereb. Cortex. 1996;6:271. doi: 10.1093/cercor/6.2.271. [DOI] [PubMed] [Google Scholar]; Kawaguchi Y. J. Neurophysiol. 1997;78:1743. doi: 10.1152/jn.1997.78.3.1743. [DOI] [PubMed] [Google Scholar]; Parra D, Gulyas AI, Miles R. Neuron. 1998;20:483. doi: 10.1016/s0896-6273(00)80479-1. [DOI] [PubMed] [Google Scholar]; Kawaguchi Y, Shindou T. J. Neurosci. 1998;18:6963. doi: 10.1523/JNEUROSCI.18-17-06963.1998. [DOI] [PMC free article] [PubMed] [Google Scholar]; Xiang Z, Huguenard JR, Prince DA. Science. 1998;281:985. doi: 10.1126/science.281.5379.985. [DOI] [PubMed] [Google Scholar]; Tamas G, Somogyi P, Buhl E. J. Neurosci. 1998;18:4255. doi: 10.1523/JNEUROSCI.18-11-04255.1998. [DOI] [PMC free article] [PubMed] [Google Scholar]
- 27.Gulyas A, Miles R, Hajos N, Freund TF. Eur. J. Neurosci. 1993;5:1729. doi: 10.1111/j.1460-9568.1993.tb00240.x. [DOI] [PubMed] [Google Scholar]; Buhl E, Halasy K, Somogyi P. Nature. 1994;368:823. doi: 10.1038/368823a0. [DOI] [PubMed] [Google Scholar]; Soltesz I, Smetters DK, Mody I. Neuron. 1995;14:1273. doi: 10.1016/0896-6273(95)90274-0. [DOI] [PubMed] [Google Scholar]; Miles R, et al. ibid. 1996;16:815. [Google Scholar]; Tamas G, Buhl EH, Somogyi P. J. Physiol. (London) 1997;500:715. doi: 10.1113/jphysiol.1997.sp022054. [DOI] [PMC free article] [PubMed] [Google Scholar]
- 28.Kawaguchi Y, Kubota Y. Cereb. Cortex. 1997;7:476. doi: 10.1093/cercor/7.6.476. [DOI] [PubMed] [Google Scholar]; Benardo LS. J. Physiol. (London) 1994;476:203. doi: 10.1113/jphysiol.1994.sp020124. [DOI] [PMC free article] [PubMed] [Google Scholar]; Kawaguchi Y. Exp. Brain Res. 1992;88:33. doi: 10.1007/BF02259126. [DOI] [PubMed] [Google Scholar]; Sugita S, Johnson SW, North RA. Neurosci. Lett. 1992;134:207. doi: 10.1016/0304-3940(92)90518-c. [DOI] [PubMed] [Google Scholar]; Segal M. Brain Res. 1990;511:163. doi: 10.1016/0006-8993(90)90236-5. [DOI] [PubMed] [Google Scholar]; Thomson AM, West DC. Soc. Neurosci. Abstr. 1997;23:379.7. [Google Scholar]
- 29.We thank S. Fujishima and K. Hartman for excellent technical assistance