

Abstract
Background
Although the clinical attributes of severe asthma in children have been well described, the differentiating features of the lower airway inflammatory response.
Objectives
We sought to discriminate severe from moderate asthma in children by applying linear discriminant analysis, a supervised method of high-dimensional data reduction, to cytokines and chemokines measured in the bronchoalveolar lavage (BAL) fluid and alveolar macrophage (AM) lysate.
Methods
BAL fluid was available from 53 asthmatic children (severe asthma, n = 31) undergoing bronchoscopy for clinical indications and 30 non-smoking adults. 23 cytokines and chemokines were measured using bead-based multiplex assays. Linear discriminant analyses of the BAL fluid and AM analytes were performed to develop predictive models of severe asthma in children.
Results
Although univariate analysis of single analytes did not differentiate severe from moderate asthma in children, linear discriminant analyses allowed for near complete separation of the moderate and severe asthmatic groups. Significant correlations were also noted between several of the AM and BAL analytes measured. In the BAL fluid, IL-13 and IL-6 differentiated asthmatics from controls, whereas GRO (CXCL1), RANTES (CCL5), IL-12, IFNγ, and IL-10 best characterized severe versus moderate asthma in children. In the AM lysate, IL-6 was the strongest discriminator of all the groups.
Conclusions
Severe asthma in children is characterized by a distinct airway molecular phenotype that does not have a clear Th1 or Th2 pattern. Improved classification of children with severe asthma may assist with the development of targeted therapeutics for this group of children who are difficult to treat.
Keywords: Asthma, Macrophage, Children, Cytokine, Chemokine, Inflammation
INTRODUCTION
Severe or “difficult-to-treat” asthma in children is a complicated disorder characterized by ongoing symptoms and persistent airway inflammation and oxidant stress despite corticosteroid treatment.1–4 Although severe asthma is likely a heterogeneous disorder,5,6 affected children share many similar clinical features, including gas trapping, bronchial hyperresponsiveness, and aeroallergen sensitization.1,2 However, the molecular and cellular patterns of inflammation in children with severe asthma are less uniform. Whereas some investigators have found increased eosinophils and Th2-derived cytokines in the airways of children with severe asthma,2,7 others have noted non-eosinophilic patterns of airway inflammation with increased neutrophils and biomarkers of neutrophil activation.8,9 Given the heterogeneity of the inflammatory response in children with severe asthma,10,11 additional methods to distinguish severe from moderate asthma are needed.
Airway macrophages (AMs) are secretory cells that play a vital role in the regulation of airway inflammation and the immune response. Although AMs have traditionally received little attention in the field of asthma,12 there are increasing reports of AM dysfunction in patients with severe asthma characterized by ongoing AM activation13 and abnormal secretion of inflammatory mediators14,15 despite corticosteroid treatment. We have further demonstrated impaired AM phagocytosis and increased AM apoptosis in children with severe versus moderate asthma following a microbial stimulus.16 Together, these data suggest that AM dysfunction may be a an important regulator of the ongoing airway inflammation associated with severe asthma. To test this hypothesis, we applied a supervised classification method to the patterns of cytokine and chemokine expression measured in the bronchoalveolar lavage (BAL) fluid and AMs of children with severe asthma, children with moderate asthma, and healthy controls. Using linear discriminant analysis, predictive models of severe asthma were generated. Our findings provide the first preliminary evidence of the molecular phenotype of severe asthma in children, which is associated with AM dysfunction.
MATERIAL AND METHODS
Sample
A convenience sample of asthmatic children 5–17 years of age undergoing bronchoscopy for clinical indications was obtained. All children met criteria for persistent asthma17 and had a history of at least a 12% change in the forced expiratory volume in one second (FEV1) after bronchodilator administration.18 Severe asthma was diagnosed according to criteria developed by the Severe Asthma Research Program,1,5 which were adapted from the American Thoracic Society’s Report (Online Repository, Table E1).19 Thresholds for high-dose inhaled corticosteroids (ICS) were defined as ≥440 mcg of fluticasone equivalent per day for children less than 12 and ≥880 mcg for children 12–17 years of age.17 The pharmacy records of all participants were reviewed and children with fewer than four ICS or oral corticosteroid refills in the previous 6 months were excluded. Other exclusion criteria included immunodeficiency, recent pneumonia, chronic aspiration syndromes, birth prior to 35 weeks gestation, or a positive BAL culture. Informed consent and assent to share the BAL fluid between the clinical and research laboratories was obtained.
Children with severe asthma underwent flexible bronchoscopy with BAL as indicated for persistent asthma symptoms despite corticosteroid treatment.20 Children with moderate asthma underwent bronchoscopy for suspected foreign body aspiration (n = 3), noisy breathing and suspected upper airway obstruction (n = 3), recurrent pneumonia (n = 5), suspected aspiration (n = 5), evaluation of chest mass/suspected endobronchial lesion (n = 2), and suspected congenital anomalies (n = 4). Participants were clinically stable. To enhance classification, non-smoking, healthy adult volunteers were also recruited. Bronchoscopy with BAL was performed in these subjects for research purposes after informed consent.
Procedures
Spirometry was performed with a portable spirometer (KoKo® Legend, Ferraris, Louisville, CO) 21 and interpreted with population reference standards.22 FENO was collected with a reservoir bag after and analyzed offline by chemiluminescence (Sievers NOA™ 280-I, Ionic Instruments, Boulder, CO).23 Smoking status was verified in adults using a urinary cassette test (Accutest®, Jant Pharmacal, Encino, CA) with a cotinine cut-off of 200 ng/mL.
Pediatric bronchoscopy was performed under general anesthesia using a laryngeal mask airway and flexible bronchoscope (Olympus BF-3C160 or BF-P160, Olympus America Inc., Melville, NY). BAL fluid was collected from the right middle lobe with three 1 mL/kg (50 mL maximum) saline lavages. For adults, conscious sedation was administered and a flexible bronchoscope (Olympus BF-1T20D) was passed trans-nasally into the right middle lobe. Three 50 mL saline aliquots were instilled. For children, the BAL fluid was pooled and divided between the research and clinical laboratories. The samples submitted to the clinical laboratories were subjected to standard culture and sensitivity testing.
BAL was centrifuged at 1200 rpm for 7 minutes at 4° C within 1 hour of collection. The supernatant was divided into 250 μl aliquots and frozen with protease inhibitors at −80°C prior to analysis. Total cell counts were performed with a hemocytometer and cellular differentials were determined from 300 consecutive cells after Wright staining. Cell pellets with <90% AM purity were excluded from further analysis. The AM pellets were frozen at −80°C with protease inhibitors. The protein content of the AM cell lysate was determined using a Coomassie (Bradford) protein assay (Pierce Biotechnology, Rockford, IL) with absorbance of 595 nm and a lower detection limit of 1 μg/mL.
Concentrations of the cytokines IL-1β, IL-2, IL-4, IL-5, IL-6, IL-7, IL-8, IL-10, IL-12p70, IL-13, IFNγ, GM-CSF, and TNFα were determined by using a bead-based mutiplex cytokine assay (HSCYTO-60SK, Millipore, Billerica, MA). The chemokines growth-related oncogene (GRO) [CXCL1], IL-8 [CXCL8], human interferon-inducible protein 10 (IP-10) [CXCL10], monocyte chemoattractant protein(MCP)-1 [CCL2], macrophage inflammatory protein (MIP)-1α [CCL3], MIP-1β [CCL4], regulated upon activation, normal T-cell expressed, and secreted (RANTES) [CCL5], MCP-3 [CCL7], eotaxin (CCL11), macrophage-derived chemokine (MDC) [CCL22], and fractalkine [CX3CL1] were quantified using a similar bead-based mutiplex kit (MPXHCYTO-60K, Millipore). These analytes were selected for their biological relevance to asthma and their associations with AM activation (Online repository Table E2). For the assays, duplicate samples and serial dilutions of the cytokine standards were added to 96 well plates and incubated overnight. Data were analyzed using the BioRad Bio-Plex System (Bio-Rad Laboratories, Hercules, CA) with gates of 4335 and 10,000. Sample concentrations were determined using a 5-point logistic curve fitting algorithm (Bio-Plex Manager 3.0 Software, BioRad Laboratories). The sensitivity and prevision of each assay is listed in the online repository (Table E3).
Statistical analysis
Data analysis was performed using SPSS® software (Version 15, SPSS Inc., Chicago, IL). Wilks’ lambda tests were used to test the equality of group means for each individual cytokine and chemokine. Due to the large number of comparisons, the threshold of significance was adjusted using a Bonferonni correction (for BAL analytes, α = 0.002; for AM analytes, α = 0.005). Variables that differed significantly between groups were further analyzed by ANOVA with Tukey’s post-hoc tests using a two-tailed α of 0.05.
Linear discriminant analysis was performed using the Fisher method,24 which is relatively robust against departures from normality.25 Linear discriminant analysis is similar to logistic regression and is useful for building a predictive model of group membership based on observed characteristics. The procedure yields a set of discriminant functions based on the linear combinations of variables that provide the best discrimination between groups. These functions can be plotted to visualize the proximity of that subject to others in the same group.
Linear discriminant analysis was used to generate two predictive models of severe asthma. The first model was generated from the linear combination of all 23 cytokines and chemokines measured in the raw BAL fluid without correction for the protein content or dilution of the BAL fluid. Because 12 of the 23 cytokines and chemokines measured were undetectable in the AM lysate, the second model was generated from the linear combination of only those 11 analytes expressed by the AMs, which included IL-6, TNFα, GRO (CXCL1), IL-8 (CXCL8), IP-10 (CXCL10), MCP-1 (CCL2), MIP-1α (CCL3), MIP-1β (CCL4), RANTES (CCL5), MDC (CCL22), and fractalkine (CX3CL1). To account for differences in total AM cell counts, the AM cytokine and chemokine concentrations were adjusted for the protein content of the cell lysate and expressed as pg/mg of protein. Cross-validation of the models was performed by randomly selecting subjects by a random number generator and repeating the analyses. To further determine the strongest discriminators of severe asthma, stepwise linear discriminat analysis was used with an F-value entry probability of 0.05 and removal probability of 0.10. Additional statistical details are provided in the online supplement.
RESULTS
Sixty children with asthma (severe asthma, n = 35) and 30 healthy adult controls participated in this study. However, seven children (severe asthma, n = 4) infected with Streptococcus pneumoniae or Haemophilus influenzae were excluded from data analysis (Table E4). The resulting sample included 30 controls, 22 moderate asthmatics, and 31 severe asthmatics. Children with moderate asthma had no evidence of endobronchial lesions or chronic aspiration. Children with severe asthma were more likely to be of African American descent and had lower pulmonary function despite treatment with higher doses of ICS (Table I).
Table I.
Features of the sample. Data represent the mean ± SD or the frequency (%).
| Adult Control (n = 30) | Moderate asthma (n = 22) | Severe asthma (n = 31) | |
|---|---|---|---|
| Age (years) | 38 ± 10 | 10 ± 4a | 11 ± 8a |
| Male | 9 (30) | 11 (50) | 17 (55) |
| Caucasian | 17 (56) | 20 (91)a | 10 (32)a,b |
| African-American | 13 (43) | 2 (9)a | 21 (68)a,b |
| ICS dose (fluticasone equivalents/day) | 0 | 332 ± 235a | 904 ± 244a,b |
| Asthma medications | |||
| Budesonide | 0 | 4 (18)a | 8 (26)a |
| Fluticasone | 0 | 3 (14)a | 1 (3) |
| Fluticasone/salmeterol | 0 | 11 (50)a | 21 (68)a |
| Montelukast | 0 | 13 (59)a | 30 (97)a,b |
| Prednisone | 0 | 0 | 15 (48)a,b |
| Asthma medical history | |||
| Emergency room visit (previous year) | 0 | 4 (18)a,b | 28 (90) |
| Hospitalization (ever) | 0 | 3 (14)a | 26 (84)a,b |
| Intensive Care Unit admission (ever) | 0 | 0 | 14 (45)a,b |
| Intubation (ever) | 0 | 0 | 6 (19)a,b |
| Pulmonary function | |||
| FVC (% predicted) | 94 ± 15 | 99 ± 16 | 86 ± 19b |
| FEV1 (% predicted) | 97 ± 16 | 97 ± 18 | 74 ± 21a,b |
| FEV1: FVC | 0.86 ± 0.08 | 0.87 ± 0.09 | 0.75 ± 0.14a,b |
| FEF25–75 (% predicted) | 115 ± 33 | 95 ± 36 | 57 ± 31a,b |
| FENO (offline, ppb) | 5 ± 3 | 12 ± 10a | 13 ± 10a |
| BAL cellular differential (%) | |||
| Macrophages/monocytes | 90.2 ± 4.4 | 90.7 ± 5.3 | 88.1 ± 5.8 |
| Neutrophils | 2.6 ± 2.0 | 5.0 ± 3.3a | 5.1 ± 3.8a |
| Eosinophils | 0.5 ± 0.5 | 0.5 ± 0.7 | 1.9 ± 3.2a,b |
| Lymphocytes | 4.9 ± 1.8 | 3.8 ± 2.9 | 4.7 ± 3.1 |
p < 0.05 versus controls;
p < 0.05 versus moderate asthmatics.
The BAL procedure was well tolerated in all participants. The BAL return volume, expressed as the percentage of saline recovered, was similar between controls and moderate asthmatics but tended to be lower in children with severe asthma (control vs. moderate vs. severe asthma: 48% vs. 48% vs. 39%; p = 0.051). However, there were no differences in the BAL fluid protein content between children with moderate and severe asthma (197 vs. 204 μg/mL). Total cell counts were decreased in both groups of asthmatics as compared to controls (7.98 vs. 3.73 vs. 3.30 ×10⁶ cells; p < 0.001) and were accompanied by a shift in the percentage of neutrophils and eosinophils (Table I).
BAL cytokines and chemokines
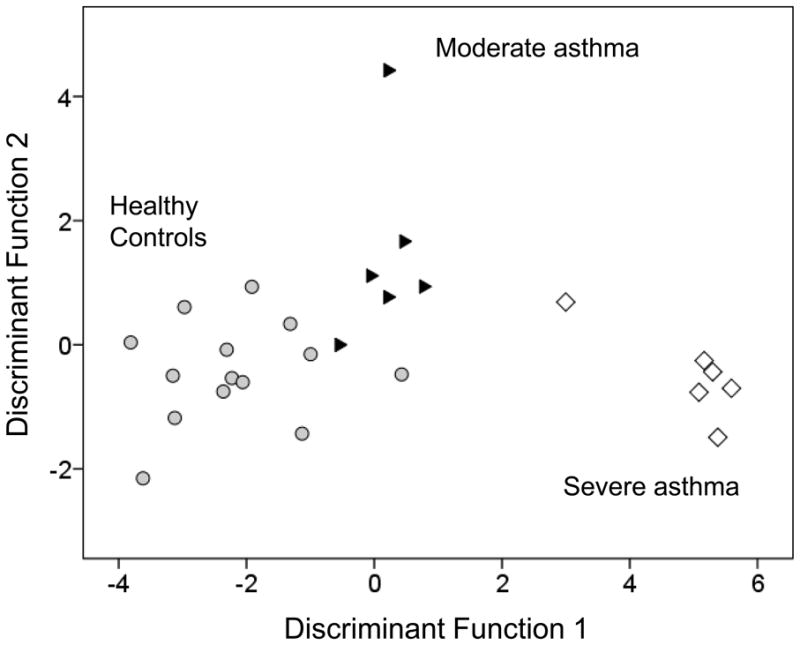
The concentrations of the cytokines and chemokines measured in the raw BAL fluid are shown in Tables II and III. Of the cytokines, only IL-6 and IL-13 differed between asthmatics and controls after correction for multiple comparisons. However, these cytokines were not significantly different between moderate and severe asthmatics. Similarly, whereas GRO (CXCL1), IL-8 (CXCL8), IP-10 (CXCL10), MIP-1β (CCL4), RANTES (CCL5), MCP-3 (CCL7), MDC (CCL22), and fractalkine (CX3CL1) were elevated in asthmatics versus controls, no differences were seen between the asthmatic groups. However, when linear discriminant analysis was performed, the model resulted in good separation of each of the three groups (Figure 1), with correct identification of 100% of the controls, 86% of the moderate asthmatics, and 91% of the children with severe asthma (Online repository Tables E5–E8). Similar separation was observed with the validation model, with an accurate prediction rate of 83.3% (Online repository Tables E7, E8). To further highlight the differences between the moderate and severe asthma groups, discriminant analysis was repeated excluding the controls. This resulting model was also statistically significant (Wilks’ λ = 0.327, χ2 = 34.682, p = 0.046) and provided correct classification of 96% of the children with moderate asthma and 82% of the children with severe asthma (Online repository Figure E1).
Table II.
Cytokine concentrations (pg/mL) in the BAL fluid. Data represent the mean ± SD, with minimum and maximum concentrations shown in parentheses.
| Adult control (n = 30) | Moderate asthma (n = 22) | Severe asthma (n = 31) | Wilks’ lambda1 | p-value2 | |
|---|---|---|---|---|---|
| IL-1β | 0 (0–0.01) | 0.07 ± 0.07a (0–0.23) | 0.06 ± 0.07a (0–0.36) | 0.742 | < 0.001* |
| IL-2 | 0.05 ± 0.08 (0–0.37) | 0.07 ± 0.05 (0–0.21) | 0.08 ± 0.11 (0–0.62) | 0.975 | 0.386 |
| IL-4 | 0.53 ± 0.73 (0–2.76) | 0.65 ± 0.84 (0–2.40) | 0.55 ± 0.74 (0–2.08) | 0.950 | 0.798 |
| IL-5 | 0.06 ± 0.16 (0–0.75) | 0.29 ± 0.56 (0–2.03) | 0.39 ± 1.03 (0–4.53) | 0.947 | 0.225 |
| IL-6 | 0.59 ± 0.48 (0.18–2.11) | 5.60 ± 3.73a (1.23–17.09) | 8.27 ± 11.65a (0.93–56.15) | 0.744 | 0.001* |
| IL-7 | 0.76 ± 1.69 (0–8.52) | 1.24 ± 1.30 (0.03–6.55) | 0.94 ± 0.98 (0.01–4.53) | 0.983 | 0.459 |
| IL-10 | 0.01 ± 0.03 (0–0.15) | 0.81 ± 1.86 (0–8.19) | 0.69 ± 1.46 (0–7.33) | 0.934 | 0.082 |
| IL-12 (p70) | 0.04 ± 0.06 (0–0.19) | 0.10 ± 0.11 (0–0.39) | 0.14 ± 0.18 (0–0.81) | 0.893 | 0.030 |
| IL-13 | 0.02 ± 0.12 (0–0.55) | 0.62 ± 0.52a (0–2.32) | 1.04 ± 1.40a (0–5.96) | 0.690 | < 0.001* |
| IFNγ | 0.03 ± 0.13 (0–0.60) | 0.26 ± 0.38 (0–1.41) | 0.14 ± 0.21 (0–0.91) | 0.876 | 0.008 |
| GM-CSF | 0.21 ± 0.21 (0–0.75) | 0.34 ± 0.29 (0–1.00) | 0.22 ± 0.25 (0–1.32) | 0.929 | 0.119 |
| TNFα | 0.19 ± 0.17 (0.04–0.74) | 0.51 ± 0.91 (0.04–4.44) | 1.47 ± 5.04 (0.06–25.71) | 0.953 | 0.259 |
Smaller values indicate better discrimination between groups
To adjust for multiple comparisons, significance was defined as α ≤ 0.002
Indicates significant differences between groups after Bonferroni correction.
p < 0.01 vs. adult control
Table III.
Chemokine concentrations (pg/mL) in the BAL fluid. Data represent the mean ± SD, with minimum and maximum concentrations shown in parentheses.
| Adult control (n = 30) | Moderate asthma (n = 22) | Severe asthma (n = 31) | Wilks’ lambda1 | p-value2 | |
|---|---|---|---|---|---|
| GRO (CXCL1) | 455 ± 391 (126–1596) | 3054 ± 1971a (166–10,000) | 2657 ± 1615a (111–6363) | 0.600 | < 0.001* |
| IL-8 (CXCL8) | 2.8 ± 2.9 (0.7–11.7) | 28.3 ± 26.6a (4.0–104) | 45.2 ± 49.1a (6.1–245) | 0.780 | < 0.001* |
| IP-10 (CXCL10) | 248 ± 284 (16–1294) | 762 ± 637a (114–2674) | 1302 ± 2145a (46–10,000) | 0.902 | < 0.001* |
| MCP-1 (CCL2) | 27.6 ± 19.5 (8.3–82.5) | 43.5 ± 34.2 (5.9–1494) | 177 ± 603 (3.52–2934) | 0.961 | 0.090 |
| MIP-1α (CCL-3) | 1.2 ± 1.2 (0–2.9) | 5.3 ± 8.8 (0–37.8) | 57.9 ± 268 (0–1288) | 0.970 | 0.076 |
| MIP-1β (CCL-4) | 3.0 ± 3.2 (0–15.0) | 20.8 ± 23.6a (1.6–106) | 19.1 ± 32.3a (0–161) | 0.881 | < 0.001* |
| RANTES (CCL5) | 25.6 ± 49.1 (0.04–199) | 108 ± 78.2a (15.1–266) | 201 ± 235a (7.6–1145) | 0.776 | < 0.001* |
| MCP-3 (CCL7) | 0 (0) | 8.7 ± 7.8a (0–27.9) | 12.2 ± 15.3a (0–73.5) | 0.771 | < 0.001* |
| Eotaxin (CCL11) | 0.1 ± 0.4 (0–1.5) | 0.8 ± 2.9 (0–13.4) | 6.8 ± 29.9 (0–144) | 0.967 | 0.175 |
| MDC (CCL22) | 34.3 ± 24.2 (0–85.9) | 57.4 ± 26.5a (16.6–106) | 90.8 ± 98.2a (6.1–357) | 0.885 | 0.002* |
| Fractalkine (CX3CL1) | 60.7 ± 26.8 (20.7–132) | 142 ± 88.1a (0–358) | 141 ± 79.4a (0–312) | 0.744 | < 0.001* |
Smaller values indicate better discrimination between groups
To adjust for multiple comparisons, significance was defined as α ≤ 0.002
Indicates significant differences between groups after Bonferroni correction.
p < 0.01 vs. adult control
Figure 1.

Scatterplot of the discriminant functions generated from 23 BAL fluid cytokines and chemokines. Each data point represents a single subject. The plot depicts clustering and clear separation of children with severe asthma (white diamonds) from children with moderate asthma (black triangles) and healthy controls (gray circles).
To determine which cytokines and chemokines in the BAL fluid best discriminated controls, moderate asthmatics and severe asthmatics, linear discriminant analysis was repeated using a stepwise approach. With this method, GRO (CXCL1), IL-13, IL-6, RANTES (CCL5), IL-12, IL-10 and IFNγ were identified as the most important predictors to include in the model (Online repository Table E9). These 7 markers explained 81.7% of the variance (χ2 = 94.785, p < 0.001) in the first discriminant function (which separated asthmatics from controls) and 18.3% of the remaining variance (χ2 = 24.124, p < 0.001) in the second discriminant function (which separated severe from moderate asthmatics). Whereas IL-13 and IL-6 provided the strongest separation of asthmatics from controls in the stepwise analysis, GRO (CXCL1), RANTES (CCL5), IL-12, IFNγ, and IL-10 best differentiated severe from moderate asthma in children (Online repository Table E10). When the stepwise analysis was repeated excluding the healthy controls, only RANTES (CCL5) was identified as the strongest differentiating factor between moderate and severe asthmatics (Wilk’s λ = 0.891, χ2 = 4.573, p = 0.032).
AM cytokines and chemokines
To determine whether AM activation might contribute to airway inflammation in severe asthma, these same cytokines and chemokines were measured in AM lysates from a subset of the original sample (control: n = 14; moderate asthma: n = 6; severe asthma, n = 6). Concentrations of these analytes are shown in Table IV. IL-1β, IL-2, IL-4, IL-5, IL-7, IL-10, IL-12p70, IL-13, IFNγ, GM-CSF, eotaxin (CCL11), and MCP-3 (CCL7) were undetectable. IL-6 and IL-8 were again elevated in the AMs from moderate and severe asthmatic children, but no significant differences were observed between the asthmatic groups. The concentrations of IL-6 and IL-8 measured in the AMs were highly correlated with the concentrations measured in the BAL fluid (IL-6: r = 0.815, p < 0.001; IL-8: r = 0.817, p < 0.001). Significant correlations between AM and BAL chemokine expression were also observed for GRO (CXCL1, r = 0.630, p = 0.003), IP-10 (CXCL10, r = 0.704; p = 0.001), RANTES (CCL5, r = 0.784, p < 0.001), and MDC (CCL22, r = 0.542, p = 0.014).
Table IV.
Cytokine and chemokine concentrations (pg/mg protein) in the BAL macrophages. Data represent the mean ± SD, with minimum and maximum concentrations shown in parentheses.
| Adult control (n = 14) | Moderate asthma (n = 6) | Severe asthma (n = 6) | Wilks’ lambda1 | p-value2 | |
|---|---|---|---|---|---|
| IL-6 | 0.4 ± 0.6 (0–1.8) | 1.1 ± 0.5a (0.5–1.7) | 1.7 ± 1.1a (0.2–2.9) | 0.623 | 0.002* |
| TNF-α | 0.9 ± 0.6 (0.2–2.7) | 0.5 ± 0.4 (0.2–1.1) | 1.1 ± 1.5 (0.1–4.1) | 0.931 | 0.332 |
| GRO (CXCL1) | 824 ± 923 (61.2–3777) | 1218.8 ± 798 (381–2329) | 1480 ± 1095 (354–2894) | 0.911 | 0.200 |
| IL-8 (CXCL8) | 29.8 ± 50.4 (2.7–200) | 58.1 ± 53.4a (25.9–164) | 199 ± 190a (21.8–536) | 0.655 | < 0.001* |
| IP-10 (CXCL10) | 120 ± 117 (0–401) | 232 ± 314 (19.2–858) | 1202 ± 1985 (7.6–5192) | 0.799 | 0.236 |
| MCP-1 (CCL2) | 60.4 ± 46.2 (7.4–176) | 33.4 ± 21.3 (8.8–72.9) | 76.2 ± 58.9 (4.4–150) | 0.893 | 0.578 |
| MIP-1α (CCL3) | 37.2 ± 32.3 (6.5–125) | 31.4 ± 13.1 (7.6–43.9) | 104 ± 116 (0–320) | 0.789 | 0.809 |
| MIP-1β (CCL4) | 34.1 ± 30.5 (8.1–30.5) | 47.7 ± 10.5 (38.0–63.0) | 118 ± 123 (0–303) | 0.747 | 0.471 |
| RANTES (CCL5) | 180 ± 123 (54.6–417) | 352 ± 327 (23.1–901.4) | 218 ± 309 (5.3–793) | 0.907 | 0.253 |
| MDC (CCL22) | 17.2 ± 11.7 (7.0–45.1) | 23.8 ± 4.7 (15.7–28.9) | 45.4 ± 48.24 (14.4 ± 142) | 0.802 | 0.031 |
| Fractalkin (CX3CL1) | 156 ± 75.9 (73.6–319) | 165 ± 12.2 (153–183) | 165 ± 135 (77.4–438) | 0.997 | 0.728 |
Smaller values indicate better discrimination between groups
To adjust for multiple comparisons, significance was defined as α ≤ 0.005
Indicates significant differences between groups after Bonferroni correction.
p < 0.01 vs. adult control
Linear discriminant analysis was performed by entering the 11 cytokines and chemokines detected in the AM lysate into the model. The resulting model again provided separation of the groups (Figure 2), with correct identification of 93% of the controls, 83% of the moderate asthmatics, and 100% of the severe asthmatics. The validation model further resulted in correct classification of 100% of the subjects in each group, although the sample size was small (Online repository, Tables E11-E14). IL-6 was identified as the single differentiator of all the groups using stepwise methods (F = 6.952, p = 0.004 and explained 100% of the variance through one discriminant function (Wilks’ λ = 0.623, χ2 = 10.875, p = 0.004).
Figure 2.
Scatterplot of the discriminant functions generated from 11 AM lysate cytokines and chemokines. Each data point represents a single subject. The plot depicts clustering and clear separation of children with severe asthma (white diamonds) from children with moderate asthma (black triangles) and healthy controls (gray circles).
DISCUSSION
To our knowledge, this is the first study to use high-dimensional data reduction techniques on BAL and AM inflammatory markers in children with severe asthma. Using the supervised method of linear discriminant analysis, we provide the first preliminary evidence of the molecular phenotype of severe asthma in children. Whereas cytokine and chemokine concentrations in the BAL and AM cell lysate did not differ between children with moderate and severe asthma, the linear combination of these biomarkers resulted in clear separation of the two asthmatic groups. Thus we conclude that severe asthma in children is associated with unique patterns of airway inflammation which persist despite corticosteroid treatment.
AMs are abundant in the airways and are important regulators of the innate immune response. These vital AM functions are compromised in patients with severe asthma. We and others have previously demonstrated a two-fold reduction in AM phagocytosis14,16 accompanied by increased AM apoptosis.14 While it might appear that AM function is suppressed in patients with severe asthma, these same patients are characterized by paradoxical AM activation. Compared to controls, AMs from asthmatics have increased basal spontaneous generation of superoxide anion,26,27 an increased ratio of pro-inflammatory to anti-inflammatory cytokines,15,28,29 and increased inflammatory gene expression evidenced by increased histone acetyl-transferases and decreased histone deacetylases.30 Whereas corticosteroids suppress LPS-induced AM inflammation in mild-to-moderate asthmatics,28 this same effect is not observed in patients with severe asthma.15,29 This unopposed secretion of inflammatory mediators, combined with impaired AM phagocytosis of apoptotic toxic granulocytes, may ultimately contribute to the airway inflammation we observed in the BAL fluid of children with severe asthma. Alternatively, the inflammatory products released by other cell types such as airway epithelial cells may induce AM inflammation and dysfunction in patients with severe asthma.
Although the models generated by this study result in relatively discrete clustering of children with severe asthma, they do not address the issue of multiple phenotypes that may exist within this group of children. Whereas children with severe asthma share similar clinical features (e.g., airflow obstruction and increased bronchial hyper-reactivity despite corticosteroid treatment), their airway cellular profiles may differ considerably.7–9 Indeed, both a neutrophilic phenotype and an eosinophilic phenotype have been reported in similar samples of children with severe asthma.2,7–9 The results from this study do not provide clear evidence to support of one pattern of airway inflammation over the other. Although the neutrophil chemoattractants GRO (CXCL1) and IL-8 (CXCL8) were highly expressed in children with severe asthma, we also observed high concentrations of the Th1 cytokine IFNγ as well as the Th2 cytokine IL-13, which is associated with eosinophilia and airway remodeling.31 Other chemoattractants and leukocyte activation products such as IL-6, IP-10 (CXCL10), MIP-1β (CCL4), RANTES (CCL5), MCP-3 (CCL7), MDC (CCL22), and fractalkine (CX3CL1) were also elevated. Whereas IL-13 and IL-6 differentiated asthmatics from controls using stepwise methods, GRO (CXCL1), RANTES (CCL5), IL-12, IFNγ, and IL-10 differentiated severe from moderate asthma in children. These data confirm that severe asthma in children is not simply a Th2-mediated disease with relative loss of Th1-mediated cytokine production. Furthermore, given that both neutrophils and eosinophils were elevated in this sample of children with severe asthma, the patterns of cellular inflammation are also complex and likely do not involve one cell type independent of others.
This study had a number of limitations. First, although the AM was the primary cell of interest, our findings may also reflect activation of other airway cells, including epithelial cells. Indeed, other cell types aside from AMs are equally relevant in the pathogenesis of severe asthma and warrant further study. Second, because bronchoscopy cannot be ethically performed in healthy asymptomatic children, our sample was restricted to children with moderate and severe asthma undergoing bronchoscopy with BAL for clinical indications. This likely biased the sample toward children with more severe disease. Third, the lack of a healthy pediatric control group does raise the question whether age is a confounding factor in our results. Fourth, because the ATS criteria for severe asthma are based primarily on high-dose corticosteroid treatment,19 our moderate asthma group may have included children who were undertreated. However, the fact that pulmonary function in this group of patients was similar to that of healthy controls discredits this notion. Furthermore, the relatively discrete grouping of moderate and severe asthmatics by our linear discriminant analyses suggests that moderate and severe asthma are indeed phenotypically distinct.
The pathophysiology of severe asthma is complex and not completely understood. The defining feature of severe asthma is the need for high doses of corticosteroids to achieve an acceptable level of asthma control.19 Because corticosteroids are the cornerstone for the diagnosis of severe asthma, we cannot exclude the possibility corticosteroids influenced our results. Although we did not strictly measure corticosteroid adherence with digital dosing meters or systemic cortisol concentrations, we did attempt to monitor asthma prescription refills. Therefore, to our knowledge, all of the children included in this study were compliant with their prescribed asthma medications. Given the immunosuppressive properties of corticosteroids, it is possible that our AM findings were influenced by these medications. However, the fact that BAL inflammatory cytokines and chemokines were also elevated is interesting and may reflect altered corticosteroid sensitivity in children with severe asthma.
In summary, we have demonstrated a unique molecular phenotype of severe asthma characterized by increased BAL inflammation and biomarkers of AM activation. Whereas single biomarkers for severe asthma such as airway eosinophils and exhaled nitric oxide have limited discriminatory ability,32 this study provides further support for the use of multiple discriminators for distinguishing severe from moderate asthma in children. The supervised method of linear discriminant analysis used here provides a possible means for classifying severe asthma in children based on the patterns of BAL and AM cytokine and chemokine expression. However, further testing of our models in an independent study population is necessary to determine the validity of our findings. We hope these findings and future ones will permit better understanding of the severe asthma phenotype in children. While these data likely will not aid clinical diagnosis, they might convey a risk for exacerbations or response to clinical treatment. As we and others pursue the relevance of these results, other high-dimensional methods of data analysis in children with severe asthma are warranted. Ultimately, high-dimensional methods may be needed to develop targeted interventions for children with severe asthma who are otherwise very difficult to treat.
Supplementary Material
Acknowledgments
This study was supported by NIH/NINR KO1 NR010548, NIH/NCRR K12 RR017643, and NIH/NHLBI SARP RO1 HL69170.
The authors would like to thank Eric Hunter and Denise Whitlock for their assistance with subject recruitment and Meredith Brown for her assistance with sample preparation and laboratory analyses.
ABBREVIATIONS
- AM
Airway macrophage
- BAL
Bronchoalveolar lavage
- FENO
Fraction of exhaled nitric oxide
- FEF25–75
Forced expiratory flow
- FEV1
Forced expiratory volume in one second
- FVC
Forced vital capacity
- GRO
Growth-related oncogene
- ICS
Inhaled corticosteroid
- IL
Interleukin
- IP-10
Human interferon-inducible protein 10
- MCP
Monocyte chemoattractant protein
- MDC
Macrophage-derived chemokine
- MIP
Macrophage inflammatory protein
- TNFα
Tumor necrosis factor alpha
- RANTES
Regulated upon activation, normal T-cell expressed, and secreted
Footnotes
The Severe Asthma Research Program is a multicenter asthma research group funded by the National Heart Lung Blood Institute (NHLBI) and consists of the following contributors (* = Steering Committee members): Brigham and Women’s Hospital, Boston, MA: Elliot Israel*, Bruce D. Levy, Gautham Marigowda; Cleveland Clinic, Cleveland, OH: Serpil C. Erzurum*, Raed A. Dweik, Suzy A. A. Comhair, Abigail R. Lara, Sumita Khatri, Marcelle Baaklini, Daniel Laskowski, Jacqueline Sharp; Emory University, Atlanta, GA: W. Gerald Teague*, Anne M. Fitzpatrick; Imperial College School of Medicine, London, UK: Kian F. Chung*, Mark Hew, Sally Meah; National Jewish Medical and Research Center, Denver, CO: Sally E. Wenzel*,; University of Pittsburgh, Pittsburgh, PA: William J. Calhoun*,; Bill T. Ameredes; University of Virginia, Charlottesville, VA: Benjamin Gaston*,; University of Wisconsin, Madison, WI: William W. Busse*, Nizar Jarjour, Cheri Swenson; Wake Forest University, Winston-Salem, NC: Eugene R. Bleecker*, Deborah Meyers, Wendy Moore, Stephen Peters, Annette Hastie, Gregory Hawkins; Washington University in St. Louis, St. Louis, MO: Mario Castro*, Leonard Bacharier, Iftikhar Hussain, Jaime Tarsi; Data Coordinating Center, Denver, CO: Douglas Curran-Everett*; NHLBI, Bethesda, MD: Patricia Noel.
CLINICAL IMPLICATIONS
Children with severe asthma are characterized by unique patterns of airway inflammation which may account for ongoing symptoms despite corticosteroid treatment.
This manuscript has an on-line data repository.
Publisher's Disclaimer: This is a PDF file of an unedited manuscript that has been accepted for publication. As a service to our customers we are providing this early version of the manuscript. The manuscript will undergo copyediting, typesetting, and review of the resulting proof before it is published in its final citable form. Please note that during the production process errors may be discovered which could affect the content, and all legal disclaimers that apply to the journal pertain.
References
- 1.Fitzpatrick AM, Gaston BM, Erzurum SC, Teague WG. Features of severe asthma in children: Atopy and increased exhaled nitric oxide. J Allergy Clin Immunol. 2006;118:1218–1225. doi: 10.1016/j.jaci.2006.08.019. [DOI] [PMC free article] [PubMed] [Google Scholar]
- 2.Chipps BE, Szefler SJ, Simons FE, Haselkorn T, Mink DR, Deniz Y, Lee JH TENOR Study Group. Demographic and clinical characteristics of children and adolescents with severe or difficult-to-treat asthma. J Allergy Clin Immunol. 2007;119:1156–1163. doi: 10.1016/j.jaci.2006.12.668. [DOI] [PubMed] [Google Scholar]
- 3.Payne DNR, Adcock IM, Wilson NM, Oates T, Scallan M, Bush A. Relationship between exhaled nitric oxide and mucosal eosinophilic inflammation in children with difficult asthma, after treatment with oral prednisolone. Am J Respir Crit Care Med. 2001;164:1376–1381. doi: 10.1164/ajrccm.164.8.2101145. [DOI] [PubMed] [Google Scholar]
- 4.Fitzpatrick AM, Teague WG, Holguin F, Yeh M, Brown LAS. Airway glutathione homeostasis is altered in children with severe asthma: evidence for oxidant stress. J Allergy Clin Immunol. 2009;123:146–152. doi: 10.1016/j.jaci.2008.10.047. [DOI] [PMC free article] [PubMed] [Google Scholar]
- 5.Moore WC, Bleecker ER, Curran-Everett D, Erzurum SC, Ameredes BT, Bacharier L, Calhoun WJ, Castro M, Chung KF, Clark MP, Dweik RA, Fitzpatrick AM, Gaston B, Hew M, Hussain I, Jarjour NN, Israel E, Levy BD, Murphy JR, Peters SP, Teague WG, Meyers DA, Busse WW, Wenzel SE. Characterization of the severe asthma phenotype by the National Heart, Lung and Blood Institute’s Severe Asthma Research Program. J Allergy Clin Immunol. 2007;119:405–413. doi: 10.1016/j.jaci.2006.11.639. [DOI] [PMC free article] [PubMed] [Google Scholar]
- 6.Miranda C, Busacker A, Balzar S, Trudeau J, Wenzel SE. Distinguising severe asthma phenotypes: role of age at onset and eosinophilic inflammation. J Allergy Clin Immunol. 2004;113:101–108. doi: 10.1016/j.jaci.2003.10.041. [DOI] [PubMed] [Google Scholar]
- 7.de Blic J, Tillie-Leblond I, Tonnel AB, Jaubert F, Scheinmann P, Gosset P. Difficult asthma in children: an analysis of airway inflammation. J Allergy Clin Immunol. 2004;113:94–100. doi: 10.1016/j.jaci.2003.10.045. [DOI] [PubMed] [Google Scholar]
- 8.Hauk P, Krawiec M, Murphy, Boguniewicz J, Schiltz A, Goleva E, Liu AH, Leung DYM. Neutrophilic airway inflammation and association with bacterial lipopolysaccharide in children with asthma and wheezing. Pediatr Pulmonol. 2008;43:916–923. doi: 10.1002/ppul.20880. [DOI] [PubMed] [Google Scholar]
- 9.Lex C, Payne DNR, Zacharasiewicz A, Li AM, Wilson NM, Hansel, Bush A. Sputum induction in children with difficult asthma: safety, feasibility, and inflammatory cell pattern. Pediatr Pulmonol. 2005;39:318–324. doi: 10.1002/ppul.20159. [DOI] [PubMed] [Google Scholar]
- 10.Gibson PG, Norzila MZ, Fakes K. Pattern of airway inflammation and its determinants in children with acute severe asthma. Pediatr Pulmonol. 1999;28:261–270. doi: 10.1002/(sici)1099-0496(199910)28:4<261::aid-ppul5>3.0.co;2-i. [DOI] [PubMed] [Google Scholar]
- 11.Norzila MZ, Fakes K, Henry RL, Simpson J, Gibson PG. Interleukin-8 secretion and neutrophil recruitment accompanies induced sputum eosinophil activation in children with acute asthma. Am J Respir Crit Care Med. 2000;161:769–774. doi: 10.1164/ajrccm.161.3.9809071. [DOI] [PubMed] [Google Scholar]
- 12.Peters-Golden M. The alveolar macrophage: the forgotten cell in asthma. Am J Respir Cell Mol Biol. 2004;31:3–7. doi: 10.1165/rcmb.f279. [DOI] [PubMed] [Google Scholar]
- 13.Goleva E, Hauk PJ, Hall CF, Liu AH, Riches DWH, Martin RJ, Leung DYM. Corticosteroid-resistant asthma is associated with classical microbial activation of airway macrophages. J Allergy Clin Immunol. 2008;122:550–559. doi: 10.1016/j.jaci.2008.07.007. [DOI] [PMC free article] [PubMed] [Google Scholar]
- 14.Huynh MN, Malcolm KC, Kotaru C, Tilstra JA, Westcott JY, Fadok VA, Wenzel SE. Defective apoptotic cell phagocytosis attenuates prostaglandin E2 and 15-hydroxyeicosatetraenoic acid in severe asthma alveolar macrophages. Am J Respir Crit Care Med. 2005;172:972–979. doi: 10.1164/rccm.200501-035OC. [DOI] [PubMed] [Google Scholar]
- 15.Bhavsar P, Hew M, Khorasani N, Torrego A, Barnes PJ, Adcock I, Chung KF. Relative corticosteroid insensitivity in severe asthma compared with non-severe asthma. Thorax. 2008;63:784–790. doi: 10.1136/thx.2007.090027. [DOI] [PubMed] [Google Scholar]
- 16.Fitzpatrick AM, Holguin F, Teague WG, Brown LAS. Alveolar macrophage phagocytosis is impaired in children with poorly controlled asthma. J Allergy Clin Immunol. 2008;121:1372–1378. doi: 10.1016/j.jaci.2008.03.008. [DOI] [PMC free article] [PubMed] [Google Scholar]
- 17.National Heart, Lung and Blood Institute, National Asthma Education and Prevention Program. The NAEPP Expert Panel Report: Guidelines for the Diagnosis and Management of Asthma – Update on Selected Topics 2002 Publication no. 02-5075. Bethesda, MD: National Institutes of Health; 2002. [Google Scholar]
- 18.American Thoracic Society. Lung function testing: selection of reference values and interpretive strategies. Am Rev Respir Dis. 1991;144:1202. doi: 10.1164/ajrccm/144.5.1202. [DOI] [PubMed] [Google Scholar]
- 19.American Thoracic Society. Proceedings of the American Thoracic Society Workshop on Refractory Asthma: current understanding, recommendations, and unanswered questions. Am J Respir Crit Care Med. 2000;162:2341–51. doi: 10.1164/ajrccm.162.6.ats9-00. [DOI] [PubMed] [Google Scholar]
- 20.Payne D, McKenzie SA, Stacey S, Misra D, Haxby E, Bush A. Safety and ethics of bronchoscopy and endobronchial biopsy in difficult asthma. Arch Dis Child. 2001;84:423–426. doi: 10.1136/adc.84.5.423. [DOI] [PMC free article] [PubMed] [Google Scholar]
- 21.Miller MR, Hankinson J, Brusasco V, Burgos F, Casaburi R, Coates A, Crapo R, Enright P, van der Grinten CP, Gustafsson P, Jensen R, Johnson DC, MacIntyre N, McKay R, Navajas D, Pedersen OF, Pellegrino R, Viegi G, Wanger J ATS/ERS Task Force. Standardisation of spirometry. Eur Respir J. 2005;26:319–338. doi: 10.1183/09031936.05.00034805. [DOI] [PubMed] [Google Scholar]
- 22.Hankinson JL, Odencrantz JR, Fedan KB. Spirometric reference values from a sample of the general U.S. population. Am J Respir Crit Care Med. 1999;159:179–87. doi: 10.1164/ajrccm.159.1.9712108. [DOI] [PubMed] [Google Scholar]
- 23.American Thoracic Society and the European Respiratory Society. ATS/ERS recommendations for standardized procedures for the online and offline measurement of exhaled lower respiratory nitric oxide and nasal nitric oxide, 2005. Am J Respir Crit Care Med. 2005;171:912–30. doi: 10.1164/rccm.200406-710ST. [DOI] [PubMed] [Google Scholar]
- 24.Fisher RA. The use of multiple measurements in taxonomic problems. Annals Eugenics. 1936;7:179–188. [Google Scholar]
- 25.Hand DJ. Discrimination and classification. NY: Wiley; 1981. [Google Scholar]
- 26.Calhoun WJ, Reed HE, Moest DR, Stevens CA. Enhanced superoxide production by alveolar macrophages and air-space cells, airway inflammation, and alveolar macrophage density changes after segmental antigen bronchoprovocation in allergic subjects. Am Rev Respir Dis. 1992;145:317–325. doi: 10.1164/ajrccm/145.2_Pt_1.317. [DOI] [PubMed] [Google Scholar]
- 27.Jarjour NN, Calhoun WJ. Enhanced production of oxygen radicals in asthma. J Lab Clin Med. 1994;123:131–136. [PubMed] [Google Scholar]
- 28.John H, Lim S, Seybold J, Jose P, Robichaud A, O’Connor B, Barnes PJ, Chung KF. Inhaled corticosteroids increase interleukin-10 but reduce macrophage inflammatory protein-1α, granulocyte-macrophage colony-stimulating factor, and interferon-γ release from alveolar macrophages in asthma. Am J Respir Crit Care Med. 1998;157:256–262. doi: 10.1164/ajrccm.157.1.9703079. [DOI] [PubMed] [Google Scholar]
- 29.Hew M, Bhavsar P, Torrego A, Meah S, Khorasani N, Barnes PJ, Adcock I, Chung KF. Relative corticosteroid insensitivity of peripheral blood mononuclear cells in severe asthma. Am J Respir Crit Care Med. 2006;174:134–141. doi: 10.1164/rccm.200512-1930OC. [DOI] [PMC free article] [PubMed] [Google Scholar]
- 30.Cosio B, Mann B, Ito K, Jazrawi E, Barnes PJ, Chung KF, Adcock IM. Histone acetylase anddeacetylase activity in alveolar macrophages and blood monocytes in asthma. Am J Respir Crit Care Med. 2004;170:141–147. doi: 10.1164/rccm.200305-659OC. [DOI] [PubMed] [Google Scholar]
- 31.Fulkerson PC, Fischetti CA, Rothenberg ME. Eosinophils and CCR3 regulate interleukin-13 transgene-induced pulmonary remodeling. Am J Pathol. 2006;169:2117–2126. doi: 10.2353/ajpath.2006.060617. [DOI] [PMC free article] [PubMed] [Google Scholar]
- 32.Lex C, Ferreira F, Zacharasiewicz A, Nicholson AG, Haslam PL, Wilson NM, Hansel TT, Payne DN, Bush A. Airway eosinophilia in children with severe asthma: predictive value of non-invasive tests. Am J Respir Crit Care Med. 2006;174:1286–1291. doi: 10.1164/rccm.200603-352OC. [DOI] [PubMed] [Google Scholar]
Associated Data
This section collects any data citations, data availability statements, or supplementary materials included in this article.