Abstract
A diagnostic assay using immunomagnetic separation was developed to capture Mycobacterium avium subsp. paratuberculosis (MAP) from bovine feces by means of IgY derived from chicken eggs. The antibody was coupled directly onto the surface of MagaCell cellulose/iron oxide beads or indirectly by being mixed with MagaBeads and a rabbit IgG linker against chicken antigen. Optimization parameters for the immunocapture included incubation time, temperature, volume, and type of immunocapture beads. Analytical sensitivity and specificity were determined by extracting DNA from the captured bacteria and amplifying it by polymerase chain reaction (PCR). The 2 bead preparations had the same analytical sensitivity, and the detection level of MAP cells in spiked bovine feces was 2 × 10⁴ cells/g. No PCR inhibition was observed with DNA from the organisms captured with use of the MagaCell-IgY beads.
Résumé
Une épreuve diagnostique utilisant la séparation immuno-magnétique a été développée afin de capturer Mycobacterium avium ssp. paratuberculosis (MAP) à partir de fèces bovines au moyen d’IgY provenant d’œufs de poule. Les anticorps ont été couplés directement sur la surface de billes MagaCell composées de cellullose/oxyde de fer ou indirectement en étant mélangées avec des MagaBeads et des IgG de lapin dirigés contre les antigènes de poulet. L’optimisation des paramètres pour l’immunocapture incluait le temps d’incubation, la température, le volume et le type de billes. La sensibilité analytique et la spécificité ont été déterminées par extraction de l’ADN des bactéries capturées et en l’amplifiant par réaction d’amplification en chaîne par la polymérase (PCR). Les 2 préparations de billes avaient la même sensibilité analytique, et le degré de détection des cellules de MAP dans des échantillons inoculés intentionnellement était de 2 × 10⁴ cellules/g de fèces bovines. Aucune inhibition du PCR n’a été observée avec l’ADN des microorganismes capturés en utilisant les billes MagaCell-IgY.
(Traduit par Docteur Serge Messier)
Introduction
Paratuberculosis, or Johne’s disease, was first reported by Johne and Frothingham in 1895 (1). It is a contagious, progressive, chronic digestive disorder of both wild and domestic ruminants caused by Mycobacterium avium subsp. paratuberculosis (MAP) (2–9). Fecal culture is still considered the “gold standard” for detecting MAP, but this method depends on the bacterial load in the specimen and the stage of the disease, and results may not be available for 16 to 20 wk. Enzyme-linked immunosorbent assay (ELISA) has commonly been used in the diagnostic laboratory, but its sensitivity has been reported as 87% in clinical cases, 75% in subclinical cases with heavy fecal shedding, and 15% in subclinical cases with light fecal shedding (10). Consequently, ELISA is suitable only for detecting herd-level status. In a mixed herd of subclinically infected and noninfected cattle, the herd-level sensitivity of ELISA and fecal culture is about 45% (11) and 45% to 55% (12), respectively. The sensitivity of both methods in cattle has also been reported to be around 35% (13).
Molecular testing gives a rapid diagnosis of Johne’s disease; several polymerase chain reaction (PCR) assays have been developed (14–19). However, inhibitory factors in bovine fecal specimens coextract with the target DNA and interfere with the assay. To circumvent this problem, we have developed an immunocapture [or immunoseparation (IMS)] assay using IgY to capture the organisms in the fecal sample prior to DNA extraction and PCR. The objective of this study was to optimize the conditions required for liquid- and solid-phase IgY-immunocapture of MAP in the presence and absence of fecal material.
Materials and methods
Preparations of IgY
The IgY was purified from chicken egg yolks as previously described (20). Purified IgY with an ELISA titer greater than 1/5000 was pooled and used for the following experiments. MagaBeads (Cortex BioChem, San Leandro, California, USA) of rabbit IgG against chicken antigen were mixed with IgY in a ratio of 1 mg of beads to 1.5 μg of IgY and incubated at room temperature for 30 min, as recommended by the manufacturer; this preparation was designated Beads A. In addition, purified IgY was coupled to magnetizable cellulose/iron oxide beads (Cortex BioChem) in a ratio of 18 mg of IgY to 1 g of beads, for a concentration of 3 × 10⁸ beads/mL. This preparation was designated MagaCell-IgY.
Sensitivity determination for PCR assay without immunocapture
The concentrations of 3 field and 2 reference strains of MAP [11992, EA4146, 2945, American Type Culture Collection (ATCC) 12258, and ATCC 19698] were adjusted to 2 × 10⁷ cells/mL. Dilutions of this standardized cell suspension were made from 10−3 to 10−7 in 12 mM Tris-HCl (pH 7.4), and 200 μL of each dilution was extracted with the MagaZorb DNA isolation kit (Cortex BioChem) according to the manufacturer’s instructions. The DNA was eluted in 200 μL of 12 mM Tris-HCl, and 10 μL was used as a template for PCR. Titration of each MAP strain was performed in triplicate.
Sensitivity determination for PCR assay with Beads A immunocapture
A field strain and a reference strain of MAP (EA4146 and ATCC 19698) were selected on the basis of differences in their restriction fragment length polymorphism (20), thereby allowing comparison of binding affinity. Aliquots (1 mL) of each strain, consisting of 2 × 10⁴ cells in 12 mM Tris-HCl and 6% sodium dodecyl sulfate (SDS), were shaken on an Eberbach model 6000 shaker (Eberbach Labtools, Ann Arbor, Michigan, USA) at low speed for 30 min. A duplicate aliquot of cells was processed without SDS for comparison. The cells were pelleted by centrifugation at 13 000 × g, washed with 1 mL of 12 mM Tris-HCl (pH 7.4), and resuspended in 1 mL of the same buffer. A 200-μL aliquot of the resuspended cells was centrifuged at 13 000 × g for 3 min, and the cell pellet was resuspended in 990 μL of phosphate-buffered saline (PBS), pH 7.4. After the addition of 10 μL of Beads A, the tubes were incubated at 37°C for 1.5 h. After incubation, the cell/bead suspension was placed on an MPC-S unit (Invitrogen, Burlington, Ontario) for 5 min, after which the supernatant was discarded. The beads were resuspended in 1 mL of 12 mM Tris-HCl and returned to the MPC-S unit for 5 min, after which the supernatant was again discarded. This wash step was repeated 4 more times. The captured bacteria were released from the beads when the pellet was resuspended in 200 μL of 0.1% SDS at room temperature (RT) for 15 min. The reaction tubes were placed in the MPC-S unit for 15 min to remove the beads. Next, DNA was extracted from the supernatant by means of the MagaZorb DNA isolation kit, according to the manufacturer’s instructions. Similarly, DNA was extracted without immunocapture from 200 μL of the MAP cells treated or not treated with 0.6% SDS. All DNA was diluted from 10−1 to 10−7 in 12 mM Tris-HCl (pH 7.2), and 10 μL of the 10−3 to 10−7 dilutions was used as the template for the PCR assay.
Optimization of Beads A for the immunocapture assay
Aliquots of 10, 20, 30, or 40 μL of Beads A suspension were added to 1.5-mL microcentrifuge tubes containing 4000 MAP cells (EA4146 or ATCC 19698) in a total volume of 1 mL of PBS. The mixture was held at 37°C for 1.5 h, then washed 5 times, and DNA was extracted as described above. For the PCR assay 10 μL of undiluted and of 1:10 and 1:100 dilutions of template DNA was used.
To determine the optimal incubation time and temperature required for the immunocapture assay, 4000 MAP cells of each strain in 1 mL of PBS were captured with 40 μL of Beads A, and the suspensions were mixed with a MyLab Rotamix SLRM1 (MJS BioLynx, Brockville, Ontario) at 37°C and RT for 15, 30, or 60 min. The Beads A mixture was washed and the DNA extracted as previously described.
Limit of detection using the immunocapture assay and bovine feces spiked with MAP
Bovine feces were provided by Agri-Food Laboratories Branch, Alberta Agriculture and Rural Development, Edmonton, Alberta. All samples had tested negative for MAP by culture and had been stored at −80°C. The MAP strains used for spiking were the same field and reference strains as used for the PCR sensitivity determination without immunocapture. Aliquots of frozen feces (1 g) were thawed overnight at 4°C and mixed with 1 mL of the MAP strains containing 2 × 10³, 2 × 10⁴, or 2 × 10⁵ cells. An unspiked fecal sample was included as a negative control. Each sample was added to a conical centrifuge tube containing 24 mL of 0.6% (w/v) SDS in water. Each suspension was mixed by vortex for 1 min and then placed for 30 min on a horizontal shaker (Eberbach model 6000) set at low speed. After the tubes had stood for 30 min at RT to allow the particulate matter to settle, 20 mL of the supernatant was removed and centrifuged in a Beckman centrifuge G120 (Beckman Coulter, Brea, California, USA) at 2380 × g for 30 min. The supernatant was discarded and 24 mL of sterile, purified water added to the pellet. After being mixed by vortex for 1 min, the suspension was centrifuged at 2380 × g for 30 min. The cell pellet was washed once more in the same way and resuspended in 1 mL of PBS (pH 7.4). All suspensions were then stored at 4°C.
For the immunocapture, 200 μL of each prepared spiked suspension was centrifuged, the pellet was resuspended in 160 μL of PBS, and then 40 μL of Beads A was added. After incubation with gentle mixing at RT for 15 min, the cell/bead suspension was placed on the MPC-S unit for 5 min, after which the supernatant was discarded. The beads were resuspended in 1 mL of PBS and returned to the MPC-S unit for 5 min, after which the supernatant was again discarded. This washing process was repeated 4 more times. The captured bacteria were released from the beads when the pellet was resuspended in 200 μL of 0.1% SDS in PBS at RT for 15 min. The reaction tubes were placed in the MPC-S unit for 3 min to remove the beads. DNA was extracted from the entire 200 μL of supernatant with use of the MagaZorb DNA isolation kit according to the manufacturer’s instructions. The same immunocapture and DNA extraction protocols described for Beads A were used to test the MagaCell-IgY beads. To optimize the assay, 4 replicate sets of spiked fecal samples containing 2 × 10³, 2 × 10⁴, and 2 × 10⁵ MAP cells per gram of feces were run with 5, 10, 15, or 20 μL of MagaCell-IgY beads instead of the 40-μL volume used for Beads A. All other steps were replicated as described above.
Detection of amplicons
The PCR was performed with primers that produce an amplicon 298 base pairs (bp) long that targets the insertion element IS900 of MAP (21). Amplification conditions were those described previously (20). Briefly, the PCR master mix consisted of 1X PCR buffer, 2.0 mM magnesium chloride, 150 μM of dNTPs, 1.0 μM of each primer, 1 unit of Taq polymerase and 2 μL of template in a total volume of 50 μL. All reagents were purchased from Invitrogen. The PCR cycling parameters were as follows: 95°C for 5 min; [95°C for 15 s, 55°C for 15 s, and 72°C for 15s] for 25 cycles; [95°C for 15 s, 65°C for 30 s, and 72°C for 15 s] for 25 cycles; and a final extension at 72°C for 7 min. The PCR product was subjected to 1% agarose gel electrophoresis, and the bands were visualized after staining with 0.5% ethidium bromide. An internal control that gave an amplified product of 992 bp was included in each PCR tube to monitor for inhibitors (20). A 1-kb marker was used for size verification.
Results
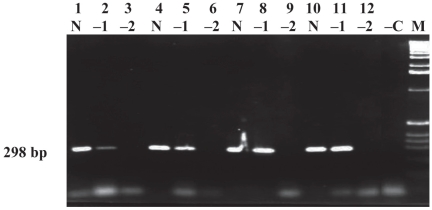
The PCR titration of DNA from the 3 field and 2 reference strains of MAP gave identical end-point results in triplicate titrations with each of the strains (data not shown). The PCR analytical sensitivity was detected at a cell dilution of 10−6, or 20 cells/mL, which is equivalent to ≤ 1 cell per PCR assay. No difference was observed in the end-point PCR detection level between the presence or absence of 0.6% SDS without immunocapture of MAP ATCC 19698 (Table I). The sensitivity of immunocapture using 10 μL of Beads A was determined by capturing 4000 cells of 2 MAP strains, EA4146 and ATCC 19698. With SDS treatment followed by immunocapture, the PCR end-point detection was at the dilution of 10−5. There was a log difference between the treated and untreated cells, as shown for MAP ATCC 19698 in Table I; identical results were observed with strain EA4146 (data not shown). The PCR end-point titrations with various dilutions of DNA extracted from 4000 cells of MAP ATCC 19698 captured with different amounts of Beads A are illustrated in Figure 1. Again the results were identical to those obtained using MAP EA4146 (data not shown). The intensity of the PCR band increased as the volume of Beads A increased from 10 to 30 μL (lanes 2, 5, and 8), but there was no difference in intensity between volumes of 30 and 40 μL (lanes 8 and 11).
Table I.
End-point titration results for Mycobacterium avium subsp. paratuberculosis (MAP) cells in polymerase chain reaction with or without treatment with sodium dodecyl sulfate (SDS) and subsequent immunocapture
| Dilution of MAP cells | Without immunocapture |
With immunocapture |
||
|---|---|---|---|---|
| With SDS | Without SDS | With SDS | Without SDS | |
| 10−3 | + | + | + | + |
| 10−4 | + | + | + | + |
| 10−5 | + | + | + | − |
| 10−6 | + | + | − | − |
| 10−7 | − | − | − | − |
Figure 1.
Determination of Beads A volume required for immunocapture of American Type Culture Collection (ATCC) strain 19698 of Mycobacterium avium subsp. paratuberculosis (MAP). For each Beads A volume used, DNA was run undiluted (N) and at dilutions of 1:10 (−1) and 1:100 (−2). The bead volumes were as follows: lanes 1 to 3, 10 μL; lanes 4 to 6, 20 μL; lanes 7 to 9, 30 μL; lanes 10 to 12, 40 μL. Lane −C — negative water control; lane M — 1-kb molecular weight marker; bp — base pairs.
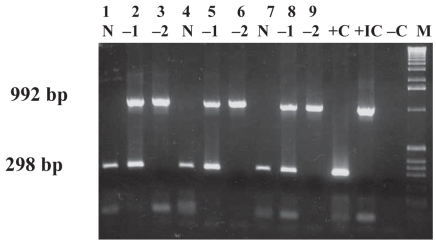
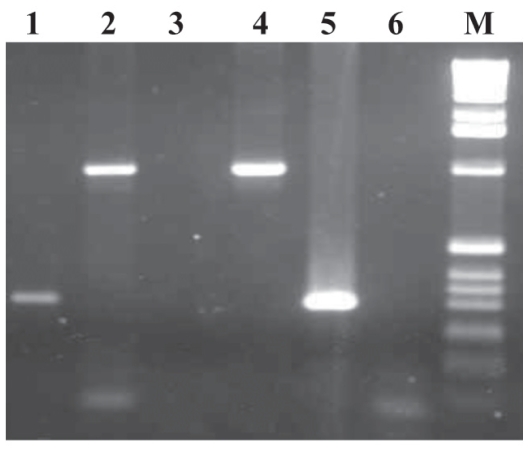
PCR titration results showed that incubation times of 15, 30, or 60 min make no difference to immunocapture efficiency at RT with the use of 4000 cells of MAP ATCC 19698 (Figure 2A) or MAP EA4146 (data not shown). In addition, results were duplicated when the incubation temperature was 37°C (data not shown). Figure 2B demonstrates that 40 μL of Beads A at RT for 15 min was sufficient to capture MAP ATCC 19698 at a concentration of 2 × 10⁴ cells per gram of bovine feces; results were identical for spiking with MAP field strains 11992, EA4146, and 2945 and ATCC 12258 (data not shown). Inhibition was observed when undiluted DNA from spiked and unspiked fecal samples captured with Beads A was used as the template for PCR. When 1:10 dilutions of DNA from the spiked and negative samples were used as the template, the internal control (IC) was not amplified, although the MAP gene was amplified in the spiked sample. At a 1:100 dilution of DNA, the IC was amplified in both cases but the MAP gene was not amplified.
Figure 2A.
Polymerase chain reaction (PCR) results with different concentrations of DNA extracted from ATCC 19698 MAP cells immunocaptured by 40 μL of Beads A incubated at room temperature (RT) for different times; DNA was run undiluted (N) and at dilutions of 1:10 (−1) and 1:100 (−2). The incubation times were as follows: lanes 1 to 3, 15 min; lanes 4 to 6, 30 min; lanes 7 to 9, 60 min. Lane +C — positive-control DNA (ATCC 19698); lane +IC — positive internal-control DNA; lane −C — negative water control; lane M — 1-kb molecular weight marker.
Figure 2B.
Results of PCR with the use of 40 μL of Beads A to immunocapture MAP ATCC 19698 spiked in bovine feces (2 × 10⁴ cells/g) incubated at RT for 15 min. Lanes 1 and 2 — DNA diluted 1:10 and 1:100; lanes 3 and 4 — negative-control bovine feces with DNA diluted 1:10 and 1:100; lane 5 — positive-control DNA (ATCC 19698); lane 6 — negative water control; lane M — 1-kb molecular weight marker.
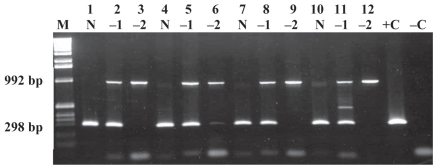
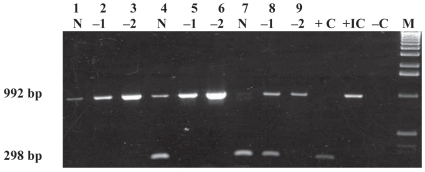
Figure 3 illustrates that there was an insignificant difference in the PCR detection level with the use of 10 μL of MagaCell-IgY beads as opposed to 5, 15, or 20 μL. Again, amplification of the IC was absent or weak with undiluted DNA but was amplified when DNA was diluted 1:10 or 1:100. The limit of detection for the capture assay was 2 × 10⁴ cells/g of bovine feces with the use of 10 μL of MagaCell-IgY beads (Figure 4) or 40 μL of Beads A. This limit of detection was the same when MAP field strains 11992, EA4146, 2945 and ATCC 12258 were used (data not shown).
Figure 3.
Determination of MagaCell-IgY beads volume required for immunocapture of MAP ATCC 19698 spiked in bovine feces (2 × 10⁴ cells/g) and incubated at RT for 15 min. For each MagaCell-IgY beads volume used, DNA was run undiluted (N) and at dilutions of 1:10 (−1) and 1:100 (−2). The bead volumes were as follows: lanes 1 to 3, 5 μL; lanes 4 to 6, 10 μL; lanes 7 to 9, 15 μL; lanes 10 to 12, 20 μL. Lane M — 1-kb molecular weight marker; lane +C — positive-control DNA (ATCC 19698); lane −C — negative water control.
Figure 4.
Results of PCR with the use of 10 μL of MagaCell-IgY beads to immunocapture MAP strain ATCC 19698 spiked in bovine feces at concentrations of 2 × 10³ cells/g (lanes 1 to 3), 2 × 10⁴ cells/g (lanes 4 to 6), and 2 × 10⁵ cells/g (lanes 7 to 9). End-point titration was performed with extracted DNA run undiluted (N) and at dilutions of 1:10 (−1) and 1:100 (−2). Lane +C — positive-control DNA (ATCC 19698); lane +IC — positive internal-control DNA; lane −C — negative water control; lane M — 1-kb molecular weight marker.
Discussion
Different reports have been published on the use of IgG purified from rabbits for immunocapture assays of MAP (22–25), but this is the first study to show the utility of IgY prepared from chicken eggs for this purpose. The detection of pathogens by IMS has been used in conjunction with culture enrichment to increase cell number before immunocapture and, consequently, increase assay sensitivity (26,27). Owing to the slow growth of MAP organisms, this approach is inadequate for timely diagnosis. None the less, IMS can be used to immobilize and concentrate the number of organisms in a sample and enable their removal from the sample matrix so that, theoretically, the sensitivity of an assay can be improved. Although the ability to detect 1 MAP cell per reaction tube by PCR amplification afforded excellent sensitivity in this study, there is a problem with inhibition of the PCR when fecal samples are tested. Simple dilution of the template DNA does reduce the effect of these inhibitors, but it also reduces the amount of MAP DNA available for amplification as well as the sensitivity of the assay. The detection level of IMS-PCR increased to 200 cells per reaction tube in the presence of bovine feces. Decreased sensitivity of IMS-PCR for MAP cells in spiked sheep feces as compared with direct PCR on the same fecal sample was reported by Mason et al (25). This decrease is most likely due to the presence of free DNA from degraded MAP cells that is amplified by direct PCR but is not captured during IMS.
Bovine feces are a very heterogeneous and complex medium. Another reason for a decrease in the sensitivity of IMS-PCR with this type of suspension is the presence of nonspecific material that causes steric interference with the binding of the MAP cells to the antibody or actually traps the beads so they are lost during the wash steps. These effects were minimized in this study by increasing the volume of Beads A from 10 to 40 μL when applying IMS to MAP cells in the presence of bovine feces. If one assumes that the majority of MAP cells binding to the IgY must be intact so the integrity of the binding site is maintained for the antibody–antigen reaction to occur during IMS, the sensitivity of the IMS-PCR assay likely represents detection of intact organisms only. Intact microorganisms cannot be differentiated from free DNA fragments in a fecal sample by means of direct PCR assays, which is important if the shedder status of an animal is being determined for purposes of risk management. Our data corroborate the finding of Mason et al (25) of an IMS-PCR sensitivity of 104 MAP cells per gram of spiked feces with PCR primers directed to the IS900 sequence.
Bead-coating methods were also evaluated in this investigation. Whether the coating was done directly (as with the MagaCell-IgY beads) or indirectly via an antibody linker (as with Beads A), the immunocapture capability of the IMS was the same, as illustrated by the PCR end-point titrations. In the study by Mason et al (25), the antibody to MAP was directly coated onto the immunomagnetic beads by means of tosyl chemistry or indirectly coated via an antibody linker. That study also showed no difference in the capture capability of the 2 types of beads. However, in our investigation we observed PCR inhibition if MAP cells spiked in bovine feces were captured by Beads A. The 0.6% SDS shaking step of the National Veterinary Services Laboratory standardized protocol for MAP culture was incorporated into our study. This detergent may disrupt the aggregation of MAP cells from the fecal material and help to free them for subsequent binding to the beads. The SDS treatment may have little or no effect on the release of intracellular MAP cells. Freezing and thawing of fecal samples will lyse macrophages and free the MAP cells for subsequent binding to the beads. Other detergents, such as Tween, have been used and most likely serve the same purpose (25).
The IgY used in this study to coat the immunocapture beads was a purified polyclonal antibody raised against a pool of 4 heat-inactivated MAP strains (20). Polyclonal antibodies are not as highly specific as monoclonal antibodies because they are directed to a number of bacterial surface antigens rather than a single surface antigen. Thus, the antibody may recognize other MAP strains that were not included in the original pool. However, cross-reactivity with M. avium has been observed and was eliminated after adsorption with M. avium cells (20). Grant et al (24) recommended a higher dilution of the IgG used to coat the beads to circumvent the problem of cross-reactivity with other mycobacterial strains.
Although a simple technique, IMS is labor-intensive, especially when a large number of specimens are to be processed in the absence of automation for the washing steps. Beads may be lost during the sequential washing steps when the supernatant is being aspirated. Another potential drawback is that nonspecific material can bind to the beads and also be attracted to the magnet. Consequently, it is difficult to wash the beads and remove all of the nonspecific material. We did not observe any sliding of the beads with aspiration of the supernatant, as observed by Grant et al (28). The washing steps were time-consuming and labor-intensive and required special attention and care to avoid aspirating the beads along with the supernatant.
This study demonstrated the use of IMS capture assay for detecting MAP in bovine feces. The IgY purified from chickens was used to coat the beads directly or indirectly via an antibody linker. For IMS plus conventional PCR with gel-based detection, the reporting time for 10 samples was less than 8 h. The detection level for cells in spiked bovine feces was 200 cells per PCR assay after capture with MagaCell-IgY beads. The inhibitory problem for the PCR was overcome, as illustrated by positive amplification of the internal control. However, future work is required to improve the sensitivity of the assay before implementation as a routine diagnostic tool for the detection of MAP in the diseased animals.
Acknowledgment
This study was financially supported by the Canada Alberta Beef Industry Development Fund.
References
- 1.Cocito C, Gilot P, Coene M, de Kesel M, Poupart P, Vannuffel P. Paratuberculosis. Clin Microbiol Rev. 1994;7:328–345. doi: 10.1128/cmr.7.3.328. [DOI] [PMC free article] [PubMed] [Google Scholar]
- 2.Chiodini RJ, Van Kruiningen HJ, Merkal RS. Ruminant paratuberculosis (Johne’s disease): The current status and future prospects. Cornell Vet. 1984;74:218–262. [PubMed] [Google Scholar]
- 3.Riemann H, Zaman MR, Ruppanner R, et al. Paratuberculosis in cattle and free-living exotic deer. J Am Vet Med Assoc. 1979;174:841–843. [PubMed] [Google Scholar]
- 4.Beard PM, Daniels MJ, Henderson D. Evidence of paratuberculosis in fox (Vulpes vuples) and stoat (Mustela erminea) Vet Rec. 1999;145:612–613. [Google Scholar]
- 5.Greig A, Stevenson K, Perez V, Pirie AA, Grant JM, Sharp JM. Paratuberculosis in wild rabbits (Oryctolagus cuniculus) Vet Rec. 1997;140:141–143. doi: 10.1136/vr.140.6.141. [DOI] [PubMed] [Google Scholar]
- 6.Lenghaus C, Badman RT, Gillick JC. Johne’s disease in goats. Aust Vet J. 1977;53:460. doi: 10.1111/j.1751-0813.1977.tb05511.x. [DOI] [PubMed] [Google Scholar]
- 7.Seaman JT, Gardner IA, Dent CH. Johne’s disease in sheep. Aust Vet J. 1981;57:102–103. doi: 10.1111/j.1751-0813.1981.tb00465.x. [DOI] [PubMed] [Google Scholar]
- 8.Seaman JT, Thompson DR. Johne’s disease in sheep. Aust Vet J. 1984;61:227–229. doi: 10.1111/j.1751-0813.1984.tb05995.x. [DOI] [PubMed] [Google Scholar]
- 9.Ridge SE, Harkin JT, Badman RT, Mellor AM, Larsen JW. Johne’s disease in alpacas (Lama pacos) in Australia. Aust Vet J. 1995;72:150–153. doi: 10.1111/j.1751-0813.1995.tb15040.x. [DOI] [PubMed] [Google Scholar]
- 10.Sweeney RW, Whitlock RH, Buckley CL, Spencer PA. Evaluation of a commercial enzyme-linked immunosorbent assay for the diagnosis of paratuberculosis in dairy cattle. J Vet Diagn Invest. 1995;7:488–493. doi: 10.1177/104063879500700411. [DOI] [PubMed] [Google Scholar]
- 11.Collins MT, Sockett DC. Accuracy and economics of the USDA-licensed enzyme-linked immunosorbent assay for bovine para-tuberculosis. J Am Vet Med Assoc. 1993;203:1456–1463. [PubMed] [Google Scholar]
- 12.Sockett DC, Conrad TA, Thomas CB, Collins MT. Evaluation of four serological tests for bovine paratuberculosis. J Clin Microbiol. 1992;30:1134–1139. doi: 10.1128/jcm.30.5.1134-1139.1992. [DOI] [PMC free article] [PubMed] [Google Scholar]
- 13.Whitlock RH, Wells SJ, Sweeney RW. ELISA and fecal culture: Sensitivity and specificity of each method. In: Manning EJB, Collins MT, editors. Proceedings of the Sixth International Colloquium on Paratuberculosis; Melbourne, Australia. 1999 Feb 14–18; Madison, Wisconsin: International Association for Paratuberculosis; 1999. pp. 353–362. [Google Scholar]
- 14.Bauerfeind R, Benazzi S, Weiss R, Schliesser T, Willems H, Baljer G. Molecular characterization of Mycobacterium paratuberculosis isolates from sheep, goats, and cattle by hybridization with a DNA probe to insertion element IS900. J Clin Microbiol. 1996;34:1617–1621. doi: 10.1128/jcm.34.7.1617-1621.1996. [DOI] [PMC free article] [PubMed] [Google Scholar]
- 15.Collins DM, Hilbink F, West DM, Hosie BD, Cooke MM, de Lisle GW. Investigation of Mycobacterium paratuberculosis in sheep by faecal culture, DNA characterisation and the polymerase chain reaction. Vet Rec. 1993;133:599–600. [PubMed] [Google Scholar]
- 16.Dell’Isola B, Poyart C, Goulet O, et al. Detection of Mycobacterium paratuberculosis by polymerase chain reaction in children with Crohn’s disease. J Infect Dis. 1994;169:449–451. doi: 10.1093/infdis/169.2.449. [DOI] [PubMed] [Google Scholar]
- 17.Secott TE, Ohme AM, Barton KS, Wu CC, Rommel FA. Mycobacterium paratuberculosis detection in bovine feces is improved by coupling agar culture enrichment to an IS900-specific polymerase chain reaction assay. J Vet Diagn Invest. 1999;11:441–447. doi: 10.1177/104063879901100509. [DOI] [PubMed] [Google Scholar]
- 18.Van der Giessen JW, Eger A, Haagsma J, Haring RM, Gaastra W, van der Zeijst BA. Amplification of 16S rRNA sequences to detect Mycobacterium paratuberculosis. J Med Microbiol. 1992;36:255–263. doi: 10.1099/00222615-36-4-255. [DOI] [PubMed] [Google Scholar]
- 19.Vary PH, Andersen PR, Green E, Hermon-Taylor J, McFadden JJ. Use of highly specific DNA probes and the polymerase chain reaction to detect Mycobacterium paratuberculosis in Johne’s disease. J Clin Microbiol. 1990;28:933–937. doi: 10.1128/jcm.28.5.933-937.1990. [DOI] [PMC free article] [PubMed] [Google Scholar]
- 20.Chui LW, King R, Chow EYW, Sim J. Immunological response to Mycobacterium avium subsp. paratuberculosis in chickens. Can J Vet Res. 2004;68:302–308. [PMC free article] [PubMed] [Google Scholar]
- 21.Hermon-Taylor J, Bull TJ, Sheridan JM, Cheng J, Stellakis ML, Sumar N. Causation of Crohn’s disease by Mycobacterium avium subspecies paratuberculosis. Can J Gastroenterol. 2000;14:521–539. doi: 10.1155/2000/798305. [DOI] [PubMed] [Google Scholar]
- 22.Dj⊘nne B. Paratuberculosis in goats — a special focus on the Nordic countries. Acta Vet Scand. 2003;44:257–259. [PubMed] [Google Scholar]
- 23.Dj⊘nne B, Jensen MR, Grant IR, Holstad G. Detection by immunomagnetic PCR of Mycobacterium avium subsp. paratuberculosis in milk from dairy goats in Norway. Vet Microbiol. 2003;92:135–143. doi: 10.1016/s0378-1135(02)00355-3. [DOI] [PubMed] [Google Scholar]
- 24.Grant IR, Ball HJ, Rowe MT. Isolation of Mycobacterium paratuberculosis from milk by immunomagnetic separation. Appl Environ Microbiol. 1998;64:3153–3158. doi: 10.1128/aem.64.9.3153-3158.1998. [DOI] [PMC free article] [PubMed] [Google Scholar]
- 25.Mason O, Marsh IB, Whittington RJ. Comparison of immunomagnetic bead separation–polymerase chain reaction and faecal culture for the detection of Mycobacterium avium subsp paratuberculosis in sheep faeces. Aust Vet J. 2001;79:497–500. doi: 10.1111/j.1751-0813.2001.tb13024.x. [DOI] [PubMed] [Google Scholar]
- 26.Ellingson JE, Anderson JL, Carlson SA, Sharma VK. Twelve hour real-time PCR technique for the sensitive and specific detection of Salmonella in raw and ready-to-eat meat products. Mol Cell Probes. 2004;18:51–57. doi: 10.1016/j.mcp.2003.09.007. [DOI] [PubMed] [Google Scholar]
- 27.Holland JL, Louie L, Simor AE, Louie M. PCR detection of Escherichia coli O157:H7 directly from stools: Evaluation of commercial extraction methods for purifying fecal DNA. J Clin Microbiol. 2000;38:4108–4113. doi: 10.1128/jcm.38.11.4108-4113.2000. [DOI] [PMC free article] [PubMed] [Google Scholar]
- 28.Grant IR, Pope CM, O’Riordan LM, Ball HJ, Rowe MT. Improved detection of Mycobacterium avium subsp. paratuberculosis in milk by immunomagnetic PCR. Vet Microbiol. 2000;77:369–378. doi: 10.1016/s0378-1135(00)00322-9. [DOI] [PubMed] [Google Scholar]


