Abstract
Patient-specific biomechanical modeling of atherosclerotic arteries has the potential to aid clinicians in characterizing lesions and determining optimal treatment plans. To attain high levels of accuracy, recent models use medical imaging data to determine plaque component boundaries in three dimensions, and fluid–structure interaction is used to capture mechanical loading of the diseased vessel. As the plaque components and vessel wall are often highly complex in shape, constructing a suitable structured computational mesh is very challenging and can require a great deal of time. Models based on unstructured computational meshes require relatively less time to construct and are capable of accurately representing plaque components in three dimensions. These models unfortunately require additional computational resources and computing time for accurate and meaningful results. A two-stage modeling strategy based on unstructured computational meshes is proposed to achieve a reasonable balance between meshing difficulty and computational resource and time demand. In this method, a coarsegrained simulation of the full arterial domain is used to guide and constrain a fine-scale simulation of a smaller region of interest within the full domain. Results for a patient-specific carotid bifurcation model demonstrate that the two-stage approach can afford a large savings in both time for mesh generation and time and resources needed for computation. The effects of solid and fluid domain truncation were explored, and were shown to minimally affect accuracy of the stress fields predicted with the two-stage approach.
Keywords: Atherosclerosis, Vulnerable plaque, Mechanical analysis and characterization, Carotid, Patient-specific, FSI
1 Introduction
The initiation and progression of atherosclerosis are determined by a complex interplay of several mechanical and biochemical factors (Richardson 2002; Stoll and Bendszus 2006; Forrester 2007). The influence of these complex factors determines where any particular atherosclerotic lesion lies on the complicated characterization between homeostatic stability and vulnerability to rupture. Much work has gone into characterizing the features of stable and vulnerable plaques, and trying to understand the determinants of the degree of vulnerability. Ex vivo studies and post-mortem observations have helped to discern the structural and biochemical factors making a plaque likely to rupture. Structurally, a thin fibrous cap overlying a large necrotic lipid core filled with foam cells, cholesterol clefts and cellular debris is thought to be indicative of plaque vulnerability. Calcifications within the diseased vessel wall, or even protruding into the lumen, are also thought to play some role in vulnerability to rupture or erosion, although they may stabilize certain lesions depending on size, location within the lesion, and vascular territory (Huang et al. 2001; Bluestein et al. 2008). Inflammatory activity and the infiltration of macrophages into a lesion are also suspected to significantly influence vulnerability (Virmani et al. 2002, 2006; Lafont 2003). Unfortunately, a method to predict rupture or assign a “rupture potential” using non-invasive techniques remains elusive. While a complete picture of vulnerability to rupture must take into account the cellular structure of the plaque, its natural history, inflammatory status, and other features that are difficult to ascertain, rupture potential is also influenced by the dynamic balance between mechanical stresses and material strengths. In this respect, finite element studies have been conducted to examine the mechanics of an atherosclerotic vessel under load.
The typical atherosclerotic artery is heterogeneous in composition and irregular in structure, resulting in a state of stress under physiologic load that is highly variable in all three dimensions (Tang et al. 2004a,b). In spite of this, the literature contains relatively few three-dimensional studies of diseased vessels with resolved plaque structures. Many groups have developed 2D models based on axial slices through the ideal or patient-specific vessel (Cheng et al. 1993; Huang et al. 2001; Chau et al. 2004; Versluis et al. 2006; Li et al. 2007). Few groups utilize 3D models capable of exploring the effects of extended distributions of lipid cores and calcifications, as well as highly tortuous geometries. While much has been learned from the 2D and 3D models in which only the solid tissues are considered, there are cases when such a solid-only approach does not accurately capture the mechanical environment. Fluid–structure interaction (FSI) models have been used in recent years to explore the mechanical factors that may dispose a vessel segment to atherosclerosis development, and to accurately model the complex loading experienced in a stenotic vessel under pulsatile flow conditions (Tang et al. 2004a,b, 2005, 2008; Kock et al. 2008).
As noted by Tang and colleagues (Tang et al. 2004a,b), for certain diseased vessels, the added realism and accuracy obtained using a 3D FSI model is important in properly determining the stresses and strains within the plaque components. It is commonly cited in the literature that these sophisticated models might be used to derive an understanding of plaque progression and vulnerability, should a sufficient number of patients be studied (Kaazempur-Mofrad et al. 2004; Li et al. 2007; Kock et al. 2008; Tang et al. 2008). Ultimately it is hoped that biomechanical simulations based on patient-specific data will serve as a reliable and robust clinical tool in the characterization of lesions and choice of treatment plan.
Currently, patient-specific 3D FSI simulations suffer from two major bottlenecks in terms of the time required to get from medical images to mechanical stress and strain predictions. The first challenge is the generation of a suitable computational mesh that can accurately represent the components of the diseased artery and can provide meaningful numerical results. The second challenge relates to the time and computational resources required to solve realistic finite element models on a patient-specific basis. The two challenges are inter-related, and reduction of one generally means an increase in the other. For example, calculation time and computer resource requirements can be greatly reduced if a structured computational mesh of brick elements is used to represent the diseased vessel. Such a mesh can be very difficult to construct, however, and the mesh generation process could take days or weeks if even possible. Alternatively, an unstructured computational mesh can be generated rather quickly for complex geometries, often in a matter of hours. Such an advantage comes with the drawback that the model’s element and equation count will rise sharply as greater accuracy in stress predictions is desired.
Accurate stress field predictions are often required only over a portion of the full domain. For instance, a study may be interested in the strain field very near the apex of the carotid bifurcation, or the stress field at the distal shoulder of a plaque lesion. Alternatively, a coarsely meshed model of an extended segment of artery may indicate a region that is a candidate for further, more accurate study. In these cases, it is helpful to use a coarse grained solution over the entire domain to guide the detailed modeling of the region of interest. Such a strategy can achieve realistic and accurate loading in a detailed model otherwise too small for meaningful FSI analysis. Additionally, this strategy can provide realistic boundary conditions for the detailed model, which become increasingly essential as the region of interest becomes more limited in extent.
In this paper, we present a new strategy for efficiently building and accurately computing highly realistic models of atherosclerotic carotid bifurcations based on patient-specific imaging data. This strategy addresses the challenges of both a lengthy structured mesh generation process and of the heightened computational time and resources inherent to the use of an unstructured grid capable of accurate stress predictions. This is achieved by using a two-stage approach, in which the fluid and solid dynamics of the full arterial domain are solved in a first stage on a coarse computational mesh. The solutions from the full domain are subsequently used as boundary conditions on a refined-mesh model in a second stage, where stresses may be accurately computed within a sub-domain of interest. Computational time requirements of the new approach will be compared to the time requirement of a more traditional, one-stage model. Effects of domain truncation on the fluid and solid solutions will be investigated by comparing the results of two-stage models to those of full domain models.
2 Methods
Our approach uses a two-stage model in which the dynamics of the system are solved in a time-dependent 3D FSI simulation with coarse resolution. The coarse solution is mapped to a finer mesh at specified “truncation” planes, and the stresses are then accurately solved for over a smaller domain. For the finite element models shown, surfaces are represented by IGES entities made in Rapidform (Rapidform, Inc. Sunnyvale, CA), meshes are built in Hypermesh (Altair Engineering, Troy, MI), and finite element equation systems are solved using ADINA (ADINA R&D, Watertown, MA).
2.1 Image processing
To achieve patient-specific modeling of the atherosclerotic carotid bifurcation, we use a level-set algorithm available in ITK-SNAP (Yushkevich et al. 2006) to form lipid pool and lumen boundaries from CT-Angiography data re-sampled to 0.245 mm × 0.245 mm × 0.3125 mm. Because perivascular tissue often has an image intensity similar to that of the vessel wall, a manual segmentation of the fibrous tissue (including healthy vessel wall and fibrous plaque) outer boundary was made so that the lumen and lipid pools were always bordered by at least 2 voxels of fibrous tissue, and the outer boundary appeared smooth in any projection. The smoothness requirement is consistent with the appearance of the outer vessel wall upon exposure during carotid endarterectomy. To construct a fibrous plaque/healthy wall tissue interface, a constant 0.5 mm inward offset surface was generated from the vessel wall outer surface. The fibrous plaque was assumed to extend longitudinally such that all lipid pools were fully contained within fibrous plaque, healthy CCA wall thickness was less than 1.0 mm, and healthy ICA wall thickness did not exceed 0.5 mm. The range of Hounsfield units corresponding to lipid pool, contrast-enhanced blood, and fibrous tissue are based on data from de Weert et al. (2006, 2008), and from local vessel features and are listed in Table 1.
Table 1.
Hounsfield unit ranges used for segmentation
| Material | Hounsfield unit range |
|---|---|
| Fibrous tissue (vessel wall, fibrous plaque) | 65–170 |
| Lipid pool | 65 and below |
| Contrast enhanced circulating blood | 170–400 |
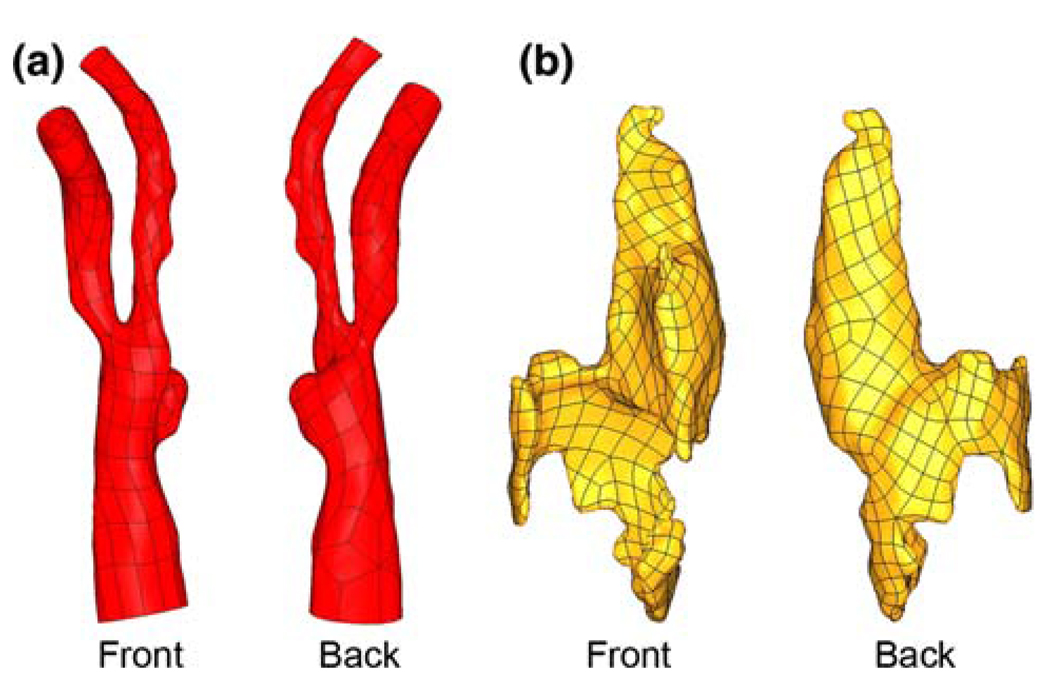
The level-set approach was chosen to prevent modeling bias, as the fibrous plaque thickness between the lumen and lipid pool, the feature of utmost importance to plaque stresses, is determined solely from the semi-automated segmentation. The level set approach is also preferred due to the extreme time requirement and relative inflexibility of directly constructing structured computational meshes from pixel data, and the inability of lofting methods to accurately represent highly curved, tortuous, or bifurcating geometries. The segmented bounding surfaces for each material were exported from ITK-SNAP in .stl format for additional processing. An example of the geometries achievable is shown in Fig. 1.
Fig. 1.
Image-based geometries. a Lumen surface of diseased carotid bifurcation. b Large, complex lipid pool surface. Lumen and lipid surfaces are not shown at the same scale
2.2 Geometry preparation
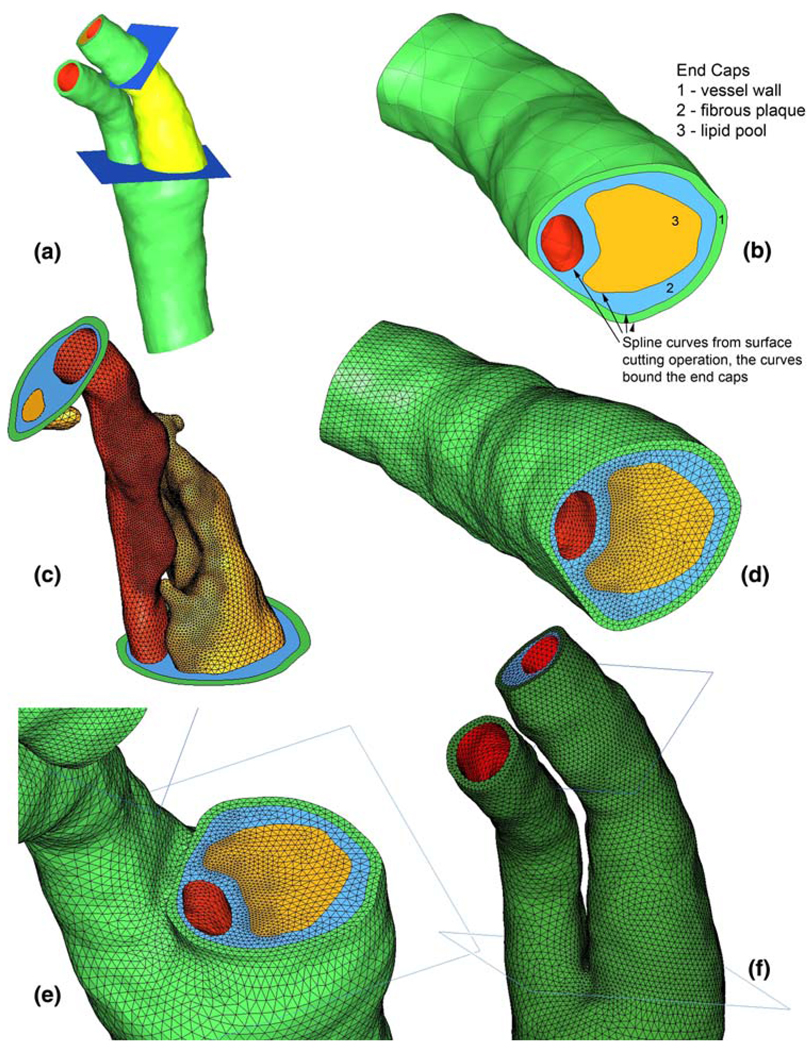
Because the two-stage technique relies on the passage of nodal solution data from the coarse-mesh model to the finemesh model, it is desirable to have a robust and easy way to address the location of data passage. To this end, we construct a set of truncation planes bounding the region of interest (Fig. 2a). It is at these planes where coarse mesh solutions are used as boundary conditions in the truncated, fine-mesh model.
Fig. 2.
a IGES surfaces for diseased carotid bifurcation and truncation planes (region of interest rendered in bright yellow-green). b Bottom aspect of region of interest after cutting of surfaces with truncation planes, end caps made from spline curves. c Surface meshing for fine-mesh model. d End cap meshes generated due to forced division of spline curves. e Coarse mesh shown at bottom truncation plane. f Full coarse mesh shown at level of bifurcation and above (for all figures, green vessel wall, blue fibrous plaque, yellow lipid, red lumen surface)
For cases in which the region of interest is unknown, multiple planes may be placed to bound several distinct regions. Before mesh generation, the truncation planes are used to cut the bounding surfaces of each plaque component and of the vessel lumen and wall. This generates a series of spline curves that bound the now-cut surfaces. The spline curves are used to create a set of conforming “end caps” that close the plaque component bounding surfaces at the truncation planes (Fig. 2b). In this way, the plaque component bounding surfaces above and below the truncation plane, and the end cap between them meet at a single, shared spline curve such that the geometries are “air-tight”.
2.3 Mesh generation: fine model
In the event that there are only two truncation planes, the plaque component surfaces between the planes are copied so that two different surface meshes can be made, one for the coarse model and one for the fine-mesh model. Because of the shared curves at the truncation planes, creating surface meshes for each plaque component in the region of interest is sufficient input to create the surface mesh on the end caps. We first create surface meshes that will be used in the fine-mesh model (Fig. 2c). A mesh is made on each plaque component surface and also for the luminal and outer wall surfaces, thus also defining the edge divisions for each end cap surface mesh.
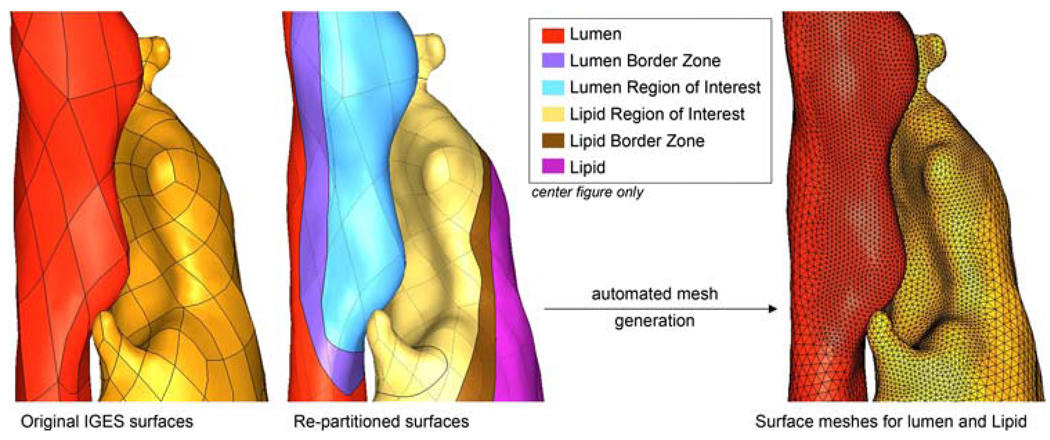
As shown in Fig.1, the IGES representation of each bounding surface consists of a set of quadrilateral “patches” with shared edges. If the surfaces are not modified, automatic mesh generators will use these patches to seed the mesh, ensuring that finite element nodes are placed at each vertex and along each edge. It is preferable to force the mesh generator to place nodes at locations that support an ideal mesh density distribution. For instance, in plaque mechanics the stress field within the thickness of the fibrous plaque overlying a lipid pool is of primary interest. As compared to regions that are of no particular interest, the fibrous plaque overlying the lipid pool should be discretized using a larger number of elements to give more accurate stress predictions. To achieve this, the patches of each IGES surface were merged into one entity that was then partitioned according to our desired mesh density scheme. Partitioning of the unabridged surface was achieved by defining curves that were used in a trimming operation on the surface. With respect to the fibrous plaque layer, the lumen and lipid surfaces defining the fibrous cap thickness were repartitioned, as well as the surrounding fibrous plaque/healthy wall interface. As the partitioned surfaces are used for mesh generation, border zone partitions were defined surrounding each region of interest so that mesh density would be smoothly varying across the surfaces and distorted elements would be avoided. The repartitioning of IGES surfaces and formation of border zones for the lumen and lipid surface defining the fibrous plaque thickness are shown in Fig. 3.
Fig. 3.
Re-partitioning of IGES surfaces to accommodate user-defined mesh density distribution
After generation of the end cap meshes, volume meshes can be made using the appropriate sets of surface meshes that enclose the volume as input (Fig. 2d). For instance, to make the fibrous plaque volume mesh in the subdomain of interest, the surface meshes for the fibrous plaque end caps, fibrous plaque/healthy wall interface, lumen, and lipid pool were used as input. By using the appropriate set of surface meshes, and constraining them to remain unchanged, volume meshes naturally conform between plaque components at the plaque component boundaries (Fig. 2e).
2.4 Mesh generation: coarse model
Once the surface meshes are defined on the end caps, the shared spline curves enforce a conforming discretization for each bounding surface of the entire domain. Surface meshes can be made on the remaining plaque component surfaces using an element density just fine enough to accurately resolve surface geometry and calculate displacements (Fig. 2f). Our experience has shown that between 150,000 and 250,000 ten-node tetrahedra can give converged displacement results over a segment of a diseased carotid bifurcation large enough for FSI analysis. The size of the domain to be modeled, and thus also the element count, depends largely on the curvature of the bifurcation branches, as this will determine where reasonable boundaries can be made on the fluid domain.
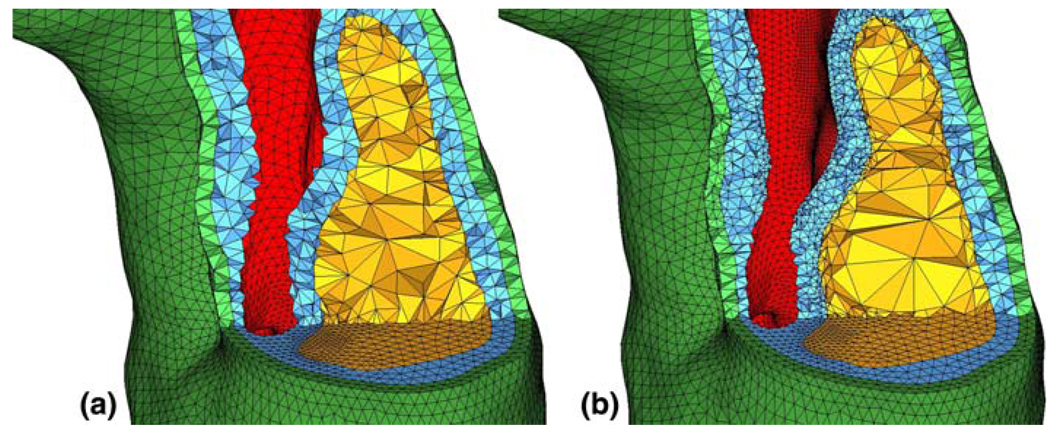
The surfaces defining the vessel lumen are cut in the same way as for the plaque components, and end caps are also created. As a result, the fluid domain for the entire vessel comprises sub-domains either within or outside of the region of interest. Examples of mesh conformity at the lower truncation plane from Fig. 2 are shown in Fig. 4.
Fig. 4.
Cuts through the mesh display a mesh conformity at the bottom truncation plane in the coarse model and b mesh conformity between coarse model and fine model (note the greatly increased element count in the fibrous plaque layer (blue) between the lipid pool (yellow) and the flow lumen (red)
2.5 Solution strategy
With all volume meshes constructed, the time dependent 3D FSI simulation is run on the coarse solid grid and the full fluid grid. Because of material and geometric non-linearity and a still-high solid element count, the CFD solution times in an iterative FSI coupling scheme are much smaller than that of the solid, so an accurate fluid mesh of a few hundred thousand linear tetrahedra may be used.
The relevant equations of motion for the incompressible Newtonian fluid and solid domains are:
| (1) |
| (2) |
and
| (3) |
where ρf and ρs are the fluid and solid density, p is the fluid pressure, and µ is the dynamic Newtonian fluid viscosity. u̇f, u̇M, and u̇s are the fluid velocity, fluid mesh velocity in the ALE formulation, and solid displacement vector, respectively. τ is the Cauchy stress tensor, and fB is the body force vector. On the shared fluid–structure interface, the displacement, velocity, and accelerations of the fluid (and fluid mesh) and solid are forced to be identical, enforcing a no-slip/ no-penetration condition on the flow field. The fluid velocity is specified on a portion of the non-FSI boundary, and the normal traction is specified on the remaining fluid boundary. The solid domain is constrained such that rigid body motion is not permitted.
The arterial solids are typically represented in the literature as nonlinear, hyperelastic materials, with or without the inclusion of anisotropy or fiber structures (Holzapfel et al. 2000). In this work, each material was described using the Demiray-type strain energy density function
| (4) |
whereI1 is the first invariant of the right Cauchy-Green tensor, and D1 and D2 are material parameters specific to each tissue, listed in Table 2.
Table 2.
Material parameters for vessel wall, fibrous plaque, and lipid
| Material | D1 (Pa) | D2 |
|---|---|---|
| Vessel wall | 2644.7 | 8.365 |
| Fibrous plaque | 5105.3 | 13 |
| Lipid | 50 | 5 |
The mesh discretization, element formulation, boundary conditions, and equations of motion are used to assemble the finite element equation systems for both the fluid and solid domains. The systems of nonlinear equations are solved by Newton–Raphson iteration in a staggered way such that the two domains are strongly coupled.
After solution of the coarse grid FSI model, nodal displacements for the solid at the truncation planes may be saved during post-processing. The fluid velocities and nodal pressures are saved at the inlet and outlet of the region of interest, respectively. Using in-house post-processing tools developed in MatLab (The MathWorks, Natick, MA), the nodal results are passed from the coarse model nodes to the fine model nodes to be used as the sole boundary conditions in the fine-mesh simulation. This can be done in a time dependent fashion, or to solve a steady-state problem. The use of the coarse model’s nodal displacements at the truncation planes allows the fine-mesh model to be of quite limited extent without introducing artificial restrictions on motion at the truncation surfaces. Assumptions of in-plane motion on the end planes of a truncated model, common in the literature, can lead to stress fields that are significantly tainted by the unrealistic boundary conditions. In our experience with stenotic arteries, picking the coarse model cardiac phase at which plaque stresses are highest and running a subsequent steady-state simulation on the fine mesh model is sufficient to resolve the fluid pressure field to a good approximation. So as to not over-constrain the problem or apply incompatible boundary conditions, displacements were not applied to nodes on the FSI interface, where loading conditions may not be exactly the same as in the full-domain simulation.
2.6 Computational time reduction test
Using a direct solver with physical memory can greatly enhance the speed of a simulation, especially if multiple processors are utilized. Unfortunately, the memory requirement for such solvers quickly becomes severe with increasing model size and iterative solvers or out-of-core solutions are then necessary. The benefit of using the two-stage technique is that both the coarse mesh over the full domain and the truncated fine mesh can be built to take full advantage of all the physical memory available, allowing use of a direct solver for each stage.
To benchmark the reduction in computation time possible using the two-stage approach, a series of four simulations were run. The first three simulations are used to calculate the stress distribution in the region of interest at the point in the cardiac cycle at which stresses are highest. First, a steady-state simulation is used to achieve end-diastolic conditions of pressure and flow in the coarse mesh model of the carotid bifurcation. Displacements may also be assigned to the inlet and outlets during this stage to approximate an in-vivo axial stretch condition, although this was not done here. Second, a transient simulation is run on the same computational mesh to solve for the flow dynamics and displacements at the truncation planes through the cardiac cycle. The third, steady-state, simulation uses the nodal solutions of the second simulation at the truncation planes to solve for the stress distribution in the region of interest. The fourth simulation uses the exact same loading and boundary conditions as the first simulation, but is run on a computational mesh consisting of the coarse mesh outside the region of interest, and the fine-mesh within the region of interest. Such a locally refined mesh would be used in a single-stage approach. The mesh size of the fourth model resulted in a large number of equations that could not be solved using direct, in-core methods. For the fourth model, ADINA’s efficient 3D-Iterative solver was used for the solid system of equations. Models 3 and 4 employ 11-node tetrahedra in the region of interest, while models 1 and 2 use only 10-node tetrahedra. Element count, finite element equation count, and run times were collected for each simulation for comparison.
2.7 Accuracy of two-stage approach
2.7.1 Testing effects of solid domain truncation
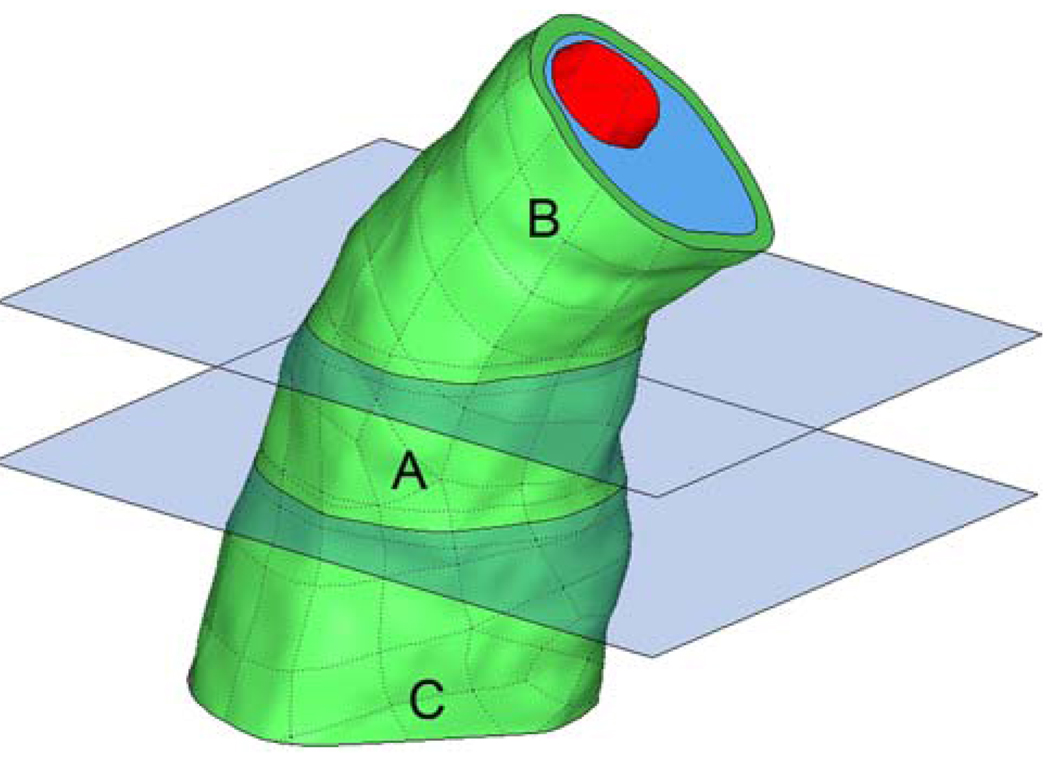
An essential component of our two-stage scheme is the use of a coarse-mesh model that accurately solves for the solid displacements at the truncation planes. If this is satisfied, then applying these displacements as boundary conditions in the fine-mesh model will not lead to appreciable stress artifacts at the truncation planes. If the loading remains the same for the coarse and fine-mesh models, the stresses calculated with the two-stage approach should be nearly equivalent to those that would be calculated if the entire domain were finely meshed. To test this, a further region of interest was specified within the truncated model as shown in Fig. 5.
Fig. 5.
Region of interest from Fig. 3 (a, b, and c), with further region of interest (a) specified
A solid-only stress analysis, with a lumen pressure of 100 mmHg, was made on region A in Fig. 5 using both the two-stage approach and also by employing a stress-resolving mesh over regions A, B, and C. The same analyses could have been made using the full arterial bifurcation, but this was avoided to keep computation time low.
2.7.2 Testing effects of fluid domain truncation
Avoidance of stress artifacts near the truncation planes, and proper loading of the region of interest is also dependent on the loading conditions remaining the same between the full-domain simulation and the truncated model. This has largely to do with selecting truncation planes on which flow solutions would make reasonable flow boundary conditions. In our example of a stenotic artery, flow is unidirectional near the stenotic throat and so the lower truncation plane was placed there. The upper truncation plane was placed to bound the region of interest and avoid an intersection with any appreciable secondary flow. To test whether or not the loading would remain the same in the fine-mesh model, the pressure field solution from the full-domain model was saved in the region of interest for nodal pressure comparison with the pressure field solution of the truncated model.
3 Results
3.1 Computational time
Using a rough element count of 200,000 10- or 11-node solid tetrahedra and 300,000 4-node fluid tetrahedra, the entire FSI model can be solved using in-core direct sparse solvers on a multi-core workstation with around 12 GB of memory. Example run-times are shown in Table 3.
Table 3.
List of simulation run times for two-stage approach and full-domain, fine-mesh model
| Model | Element count | Equation # | Run time (h) |
|---|---|---|---|
| 1. Full domain, coarse mesh, steady state solution at end-diastole, ten load steps |
Solid: 216,076 | Solid: 984,241 | 15 |
| Fluid: 300,215 | Fluid: 230,996 | ||
| FSI: 57,950 | |||
| 2. Full domain, coarse mesh, transient solution with 26 cardiac phases |
Solid: 216,076 | Solid: 984,241 | 27 |
| Fluid: 300,215 | Fluid: 230,996 | ||
| FSI: 57,950 | |||
| 3. Truncated model, fine mesh, steady state solution at peak stress state |
Solid: 187,086 | Solid: 1,213,644 |
9 |
| Fluid: 30,887 | Fluid: 26,212 | ||
| FSI: 6,553 | |||
| 4. Full domain model capable of resolving stresses in region of interest. Steady-state solution at end-diastole, ten load steps |
Solid: 343,227 | Solid: 2,180,749 | 125a |
| Fluid: 300,215 | Fluid: 230,996 | ||
| FSI: 57,950 |
CFD boundary conditions, material description, and meshes were the same for models 1, 2, and 4. Solids were nonlinear, hyperelastic and nearly incompressible
Run time for model 4 is estimated from solution time for load steps 1–5, in comparison to same load steps for model 1
As shown in Table 3, the run-time savings can be quite large using the two-stage strategy. We were able to accurately solve for the dynamics of the full vessel, and resolve peak stresses in the region of interest in less than half the time it takes to reach end-diastolic conditions in the full-domain, stress-resolving mesh. Although these results are for a single model, similar trends have been observed for other models of similar size and complexity.
3.2 Effects of solid domain truncation on first principal stress
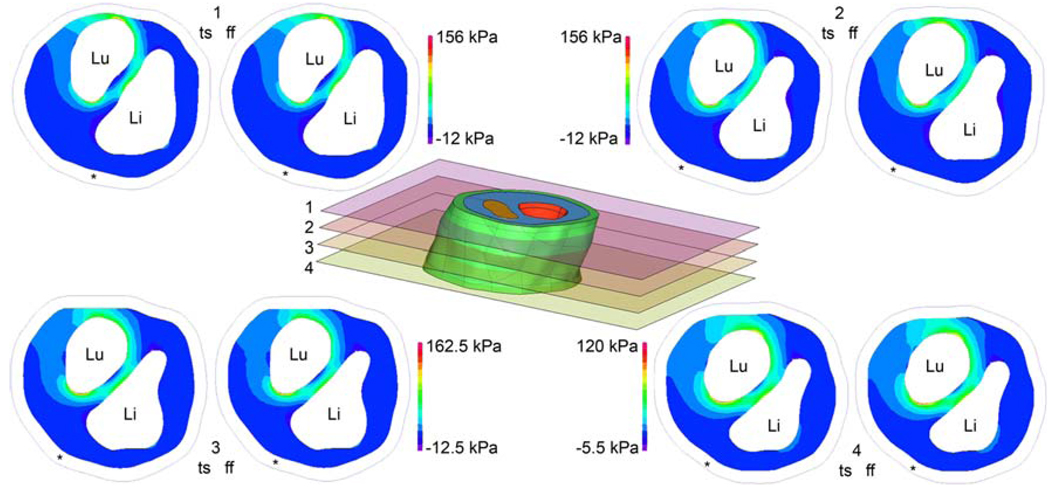
Figure 6 shows the first principal stress calculated at four cut planes in region A of Fig. 5. Stresses were calculated using both the two-stage (ts) approach and also using the full-domain, fine-mesh (ff) model. Because the stresses calculated with each model are displayed using one color scale for each cut plane, it can be visually verified that the stress patterns and magnitudes are nearly identical. Taking the full-domain, fine-mesh model results to be truth, the peak stresses calculated using the two-stage approach have a percent error of 1.4, 1.4, 5.4 and 3.5% at cuts 1–4, respectively.
Fig. 6.
Comparison of two-stage (ts) model stresses and full-domain, fine-mesh (ff) model stresses on cut planes indicated in center figure. First principal stresses are shown for fibrous plaque layer only.”Li” denotes lipid pool position, “Lu” indicates the lumen, and “*” shows the boundary of the vessel wall. Use of the same color scale for ts and ff results allows easy visual inspection, revealing very close agreement between ts and ff stresses. Color scale is determined independently for each cut plane so that images can most clearly show stress patterns. Stresses calculated using the two-stage approach are within 5.4% of those calculated with the computationally intense full-domain, fine-mesh model
3.3 Effects of fluid domain truncation on pressure field solution
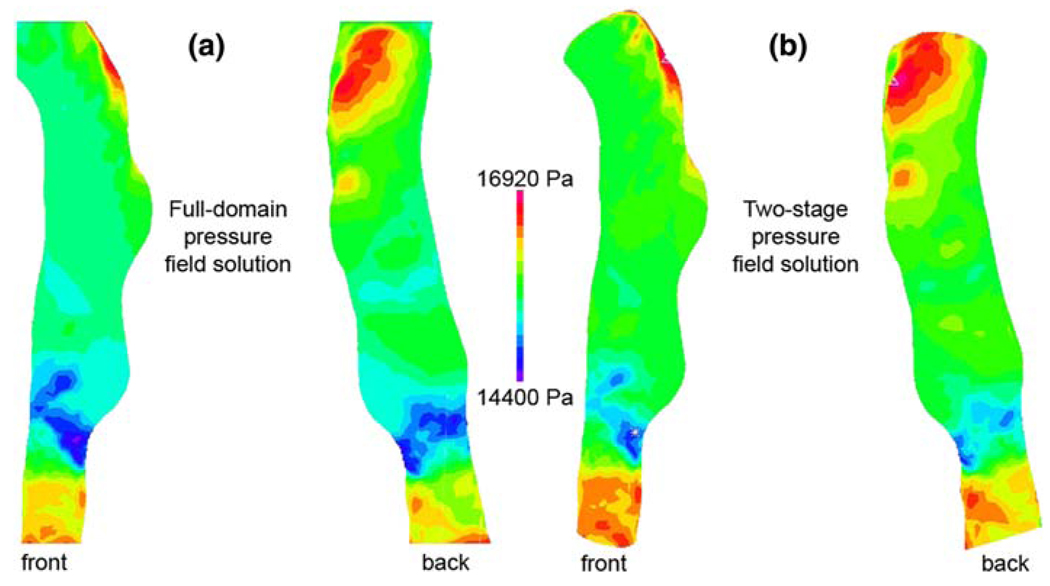
The pressure field solutions for the full-domain model and the truncated model are shown in Fig. 7a and b, respectively. Because the pressure distribution at the lumen surface is what imparts a load to the vessel wall, only those nodes on the FSI interface were used for the comparison.
Fig. 7.
a Pressure field solution from full-domain model.
b Pressure field solution from truncated model
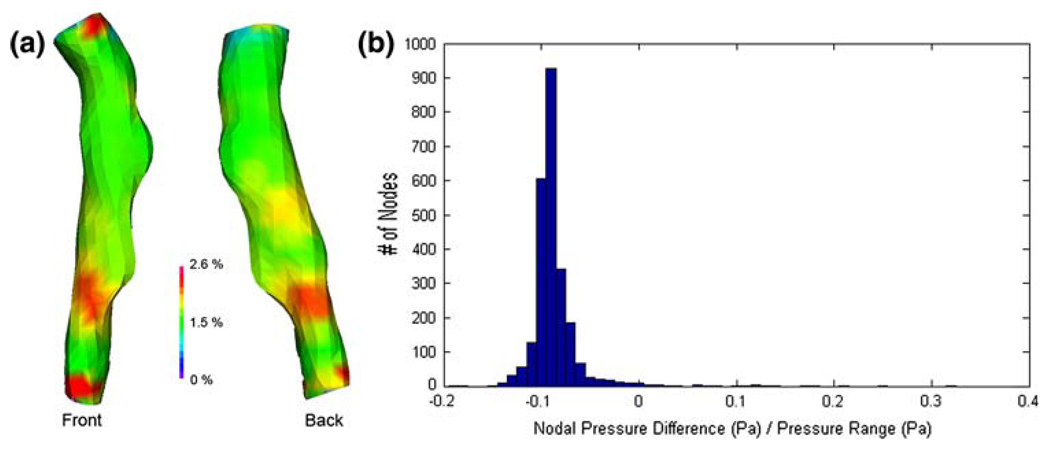
For this geometry, the average pressure difference at the FSI interface between the full-domain solution and the truncated solution is 217 Pa, or about 1.5% of the average pressure at the FSI interface. More important than capturing the exact same pressure magnitudes in the truncated model is the resolution of a similar pressure pattern (Fig. 8a), as this will determine the nature of the solid deformation field. Comparison of the nodal pressures calculated in each model revealed that the truncated model had a nearly uniform increase in pressure of ~200 Pa from the pressure field calculated in the full-domain model. As shown in Fig. 8b, this is equivalent to approximately 10% of the pressure range within the region of interest.
Fig. 8.
Pressure difference between full-domain fluid solution and truncated domain solution. a Difference between two models shown as a percent difference with regard to the full-domain solution. b Nodal distribution of pressure differences, showing a nearly constant offset of +200 Pa in the truncated model’s pressure field
4 Discussion
Atherosclerosis is known to be a significant contributor to stroke and myocardial infarction (Rosamond et al. 2007). In addition to the complex biochemistry involved in plaque vulnerability, mechanics plays a role in the breakdown of plaque stability (Humphrey 2002). For this reason, it is hoped that patient-specific finite element modeling of diseased arteries can offer a robust tool for clinicians to better stratify patients into different treatment plans. Due to relative ease of imaging and simpler physical boundary conditions, carotid artery FSI modeling has seen greater development than coronary artery modeling in recent years.
Unfortunately, there are significant hurdles to be over-come before 3D FSI modeling of atherosclerotic carotid arteries can be done on a patient specific basis with the ease and speed required for clinical use. Two of the biggest challenges are mesh generation and computation time. A computational mesh of brick elements, 8-node or higher order, generally provides more accurate stress results than a mesh of tetrahedral elements when the overall finite element system matrix is constrained to be of similar size. The geometries shown in Fig. 1 are not at all amenable to structured meshes, and unstructured meshes of tetrahedra become preferable for ease of mesh generation. Additionally, because it is difficult to assess a priori which region(s) of a diseased vessel might be of interest from a mechanics standpoint, it is important that the finite element model be able to consider highly complex shapes, something unstructured meshes are well suited for.
Simultaneously representing a portion of artery suitable for FSI analysis and accurately predicting plaque stresses over a large region using an unstructured mesh can easily require element counts in the several hundred thousands. An element count this high can lead to large computation demands for even a relatively simple linear analysis, and the problem is much more severe for arterial mechanics simulations. Material incompressibility necessitates the use of a mixed formulation finite element method, adding extra pressure degrees of freedom to the computation. Nonlinear material response is accounted for by solving the linearized equations in an incremental iterative manner, requiring repetitive solution of a large system of equations. Fluid–structure interaction only compounds the problem by requiring additional outer iterations to bring the fluid and structural mechanics systems into a converged equilibrium. Consideration of multiple phases of the cardiac cycle adds time to the computation not only in the sense that multiple loads steps must be simulated, but also because a great number of additional numerical integrations must be made to evaluate the system mass matrix and inertial terms in the element force vector. Meaningful FSI simulations of the diseased carotid bifurcation are thus computationally very demanding and require a computer cluster with ample memory for reasonable runtimes. For these reasons, we have developed a two-stage approach that both eliminates the difficulty of structured mesh generation and significantly reduces the computation time associated with accurate unstructured meshes.
To facilitate unstructured mesh generation with the greatest amount of user control, an intermediate set of geometrical surfaces representing the boundaries of various vessel and plaque components was constructed from medical imaging data. By referencing a continuous surface rather than discrete image pixels, mesh generation is more flexible and better suited to complex geometries. Although multi-sequence black-blood MRI studies have excellent soft tissue contrast and are often used to study carotid plaques in vivo (Yuan and Kerwin 2004; Saam et al. 2007), we have used CT-Angiography data for boundary surface extraction as it has an inherently smaller slice thickness. In principle, the same methods could be applied to MR data following appropriate re-sampling or interpolation of bounding curves, allowing a non-lofting approach to be used.
After a segmentation of the imaging study is achieved, an experienced user can generate the coarse and fine mesh models for both solid and fluid domains within a few hours. The surface meshes for each model can be constrained to lie within a user-defined tolerance in most unstructured mesh generators, ensuring a suitable FSI interface. While directly modeling each plaque component as a geometric solid would allow for an even easier conforming mesh generation scheme, this would not allow sufficient control over the anisotropic mesh density needed for these models.
The time-savings in mesh generation would not be valuable if the solution of the truncated model were not accurate. Our results for the further truncation of the region of interest show that coarse-mesh displacement results can be successfully employed as fine-mesh boundary conditions with minimal effect on the converged stress predictions. The full description of material stress is given by a second-order tensor with six unique entries, and the patterns for each stress entry throughout the geometry are complex and different (Tang et al. 2005). We have chosen to examine only the first principal stress,the maximum value of normal stress obtained through coordinate transformation, rather than the von Mises stress that is commonly used in the literature. In our models, the principal stress direction is tensile and primarily circumferential with regard to the lumen surface. Circumferential tensile stress is thought to be the predominant mechanical factor associated with fibrous plaque rupture, and thus the first principal stress was studied (Lee et al. 1991; Loree et al. 1992; Holzapfel and Sommer 2004).
In a full FSI analysis, the loading is not uniform, and the accuracy of the truncated fluid domain solutions was therefore checked. Of course, one should not expect the fluid pressure field to be exactly the same from the time-dependent full-domain simulation and the truncated steady state model, but the approximation can be good, as shown in Fig. 6. There is a nearly constant offset in pressure of ~200 Pa between the full-domain model and the truncated model. There are a very limited number of nodes exhibiting a greater pressure difference, with the maximum difference being 20% of the pressure range within the region of interest after accounting for the uniform offset. Although a 20% deviation with regard to range seems large, one must remember that it is only a 2.6% difference in absolute pressure, and the sparsity of errant nodes limits their effect on the overall stress pattern. The nearly constant offset in the truncated model is likely a result of using a uniform pressure, the average nodal pressure from the full-scale simulation, at the truncated model’s outlet boundary. A simple decrease of this outlet pressure would reduce the discrepancy, but because the offset is small this was not done. Although stenotic arteries like the one tested generally experience flow shear stresses much greater than those in healthy arteries, the shear stress is still orders of magnitude lower than the systemic pressure loading. For this reason, the accuracy of the truncated model’s velocity field was not quantitatively investigated, although qualitative inspection revealed that the truncated model’s solution agreed well with the full-model solution in the region of interest.
5 Conclusion
In this paper, we have presented a strategy to accurately and efficiently model atherosclerotic arteries, particularly carotid bifurcations. Diseased vessels often contain multiple lipid pools, calcifications, and have non-uniform fibrous plaque burden. These plaque components, and the vessel wall and lumen surface are often highly complex and irregularly shaped, rendering a priori knowledge of one “biomechanically interesting” region difficult or impossible. Although superior in terms of solution accuracy and computation time, allowing large regions of accurate stress prediction, structured meshes of such geometries are very difficult to construct, and pose a significant bottleneck to patient-specific simulations. To avoid the lengthy solution times inherent to a full-domain, stress-resolving, unstructured mesh, a two-stage strategy has been introduced. Using the two-stage approach, complex shapes are well represented and stresses are accurately solved, allowing for easier image-based modeling. Use of the two-stage technique allows very realistic image-based simulations to be run on a modest multi-core workstation, which will hopefully allow for greater use of these sophisticated models. The strategy presented here assumes that the modeler can focus on one or more regions of interest from the full domain and define truncation planes bounding those regions. A more general approach is in development, whereby nodal solutions from the coarse-grained model, and use of the element shape functions will allow passage of data to serve as boundary conditions in a fine-mesh model defined entirely separate from the coarse model. In this way, no initial guess at the region of interest is needed, and mesh generation for both models is even less constrained. Eventually, we hope this work can be incorporated in user-friendly interfaces appropriate for clinical settings where the clinicians can dynamically choose the region of interest and pass the information to the underlying software for capturing the biomechanical patterns at the region of interest.
Acknowledgments
The authors thank Bruno Soares and Max Winter-mark for providing medical imaging data. The authors also wish to thank LoicBoussel for help with nodal pressure data comparison. Funding support was provided by the following grants: American Heart Association Pre-doctoral Fellowship 0715072Y (JL), VA MERIT Review Award (DS), and NS059944 from the NINDS.
Footnotes
Open Access This article is distributed under the terms of the Creative Commons Attribution Noncommercial License which permits any noncommercial use, distribution, and reproduction in any medium, provided the original author(s) and source are credited.
Contributor Information
Joseph R. Leach, Email: joseph.leach@ucsf.edu, UC Berkeley/UC San Francisco Joint Graduate Group in Bioengineering, University of California San Francisco, San Francisco, CA, USA; Department of Radiology, UC San Francisco Medical Center, San Francisco, CA, USA.
Vitaliy L. Rayz, Department of Radiology, UC San Francisco Medical Center, San Francisco, CA, USA
Mohammad R. K. Mofrad, UC Berkeley/UC San Francisco Joint Graduate Group in Bioengineering, University of California San Francisco, San Francisco, CA, USA
David Saloner, UC Berkeley/UC San Francisco Joint Graduate Group in Bioengineering, University of California San Francisco, San Francisco, CA, USA; Department of Radiology, UC San Francisco Medical Center, San Francisco, CA, USA.
References
- Bluestein D, Alemu Y, et al. Influence of microcalcifications on vulnerable plaque mechanics using FSI modeling. J Biomech. 2008;41:1111–1118. doi: 10.1016/j.jbiomech.2007.11.029. [DOI] [PubMed] [Google Scholar]
- Chau AH, Chan RC, et al. Mechanical analysis of atherosclerotic plaques based on optical coherence tomography. Ann Biomed Eng. 2004;32(11):1494–1503. doi: 10.1114/b:abme.0000049034.75368.4a. [DOI] [PubMed] [Google Scholar]
- Cheng GC, Loree HM, et al. Distribution of circumferential stress in ruptured and stable atherosclerotic lesions. A structural analysis with histopathological correlation. Circulation. 1993;87(4):1179–1187. doi: 10.1161/01.cir.87.4.1179. [DOI] [PubMed] [Google Scholar]
- de Weert TT, de Monye C, et al. Assessment of atherosclerotic carotid plaque volume with multidetector computed tomography angiography. Int J Cardiovasc Imaging. 2008;24(7):751–759. doi: 10.1007/s10554-008-9309-1. [DOI] [PMC free article] [PubMed] [Google Scholar]
- de Weert TT, Ouhlous M, et al. In vivo characterization and quantification of atherosclerotic carotid plaque components with multidetector computed tomography and histopathological correlation. Arterioscler Thromb Vasc Biol. 2006;26(10):2366–2372. doi: 10.1161/01.ATV.0000240518.90124.57. [DOI] [PubMed] [Google Scholar]
- Forrester JS. The pathogenesis of atherosclerosis and plaque instability. In: Holtzman JL, editor. Atherosclerosis and oxidant stress: a new perspective. New York: Springer; 2007. [Google Scholar]
- Holzapfel GA, Gasser TC, et al. A new constitutive framework for arterial wall mechanics and a comparative study of material models. J Elast. 2000;61:1–48. [Google Scholar]
- Holzapfel GA, Sommer G. Anisotropic mechanical properties of tissue components in human atherosclerotic plaques. J Biomech Eng. 2004;126:657–665. doi: 10.1115/1.1800557. [DOI] [PubMed] [Google Scholar]
- Huang H, Virmani R, et al. The impact of calcification on the biomechanical stability of atherosclerotic plaques. Circulation. 2001;103:1051–1056. doi: 10.1161/01.cir.103.8.1051. [DOI] [PubMed] [Google Scholar]
- Humphrey JD. New York: Springer; 2002. Cardiovascular solid mechanics : cells, tissues, and organs. [Google Scholar]
- Kaazempur-Mofrad MR, Isasi AG, et al. Characterization of the atherosclerotic carotid bifurcation using MRI, finite element modeling, and histology. Ann Biomed Eng. 2004;32(7):932–946. doi: 10.1023/b:abme.0000032456.16097.e0. [DOI] [PubMed] [Google Scholar]
- Kock SA, Nygaard JV, et al. Mechanical stresses in carotid plaques using MRI-based fluid-structure interaction models. J Biomech. 2008;41(8):1651–1658. doi: 10.1016/j.jbiomech.2008.03.019. [DOI] [PubMed] [Google Scholar]
- Lafont A. Basic aspects of plaque vulnerability. Heart. 2003;89(10):1262–1267. doi: 10.1136/heart.89.10.1262. [DOI] [PMC free article] [PubMed] [Google Scholar]
- Lee RT, Grodzinsky AJ, et al. Structure-dependent dynamic mechanical behavior of fibrous caps from human atherosclerotic plaques. Circulation. 1991;83(5):1764–1770. doi: 10.1161/01.cir.83.5.1764. [DOI] [PubMed] [Google Scholar]
- Li ZY, Howarth SP, et al. Structural analysis and magnetic resonance imaging predict plaque vulnerability: a study comparing symptomatic and asymptomatic individuals. J Vasc Surg. 2007;45(4):768–775. doi: 10.1016/j.jvs.2006.12.065. [DOI] [PubMed] [Google Scholar]
- Loree HM, Kamm RD, et al. Effects of fibrous cap thickness on peak circumferential stress in model atherosclerotic vessels. Circ Res. 1992;71:850–858. doi: 10.1161/01.res.71.4.850. [DOI] [PubMed] [Google Scholar]
- Richardson PD. Biomechanics of plaque rupture: progress, problems, and new frontiers. Ann Biomed Eng. 2002;30:524–536. doi: 10.1114/1.1482781. [DOI] [PubMed] [Google Scholar]
- Rosamond W, Flegal K, et al. Heart disease and stroke statistics-2007 update: a report from the American Heart Association Statistics Committee and Stroke Statistics Subcommittee. Circulation. 2007;115(5):e69–e171. doi: 10.1161/CIRCULATIONAHA.106.179918. [DOI] [PubMed] [Google Scholar]
- Saam T, Hatsukami TS, et al. The vulnerable, or high-risk, atherosclerotic plaque: noninvasive MR imaging for characterization and assessment. Radiology. 2007;244(1):64–77. doi: 10.1148/radiol.2441051769. [DOI] [PubMed] [Google Scholar]
- Stoll G, Bendszus M. Inflammation and atherosclerosis: novel insights into plaque formation and destabilization. Stroke. 2006;37:1923–1932. doi: 10.1161/01.STR.0000226901.34927.10. [DOI] [PubMed] [Google Scholar]
- Tang D, Yang C, et al. Effect of a lipid pool on stress/strain distributions in stenotic arteries: 3-D fluid-structure interactions (FSI) models. J Biomech Eng. 2004a;126(3):363–370. doi: 10.1115/1.1762898. [DOI] [PubMed] [Google Scholar]
- Tang D, Yang C, et al. 3D MRI-based multicomponent FSI models for atherosclerotic plaques. Ann Biomed Eng. 2004b;32(7):947–960. doi: 10.1023/b:abme.0000032457.10191.e0. [DOI] [PubMed] [Google Scholar]
- Tang D, Yang C, et al. Quantifying effects of plaque structure and material properties on stress distributions in human atherosclerotic plaques using 3D FSI models. J Biomech Eng. 2005;127(7):1185–1194. doi: 10.1115/1.2073668. [DOI] [PMC free article] [PubMed] [Google Scholar]
- Tang D, Yang C, et al. A negative correlation between human carotid atherosclerotic plaque progression and plaque wall stress: in vivo MRI-based 2D/3D FSI models. J Biomech. 2008;41(4):727–736. doi: 10.1016/j.jbiomech.2007.11.026. [DOI] [PMC free article] [PubMed] [Google Scholar]
- Versluis A, Bank AJ, et al. Fatigue and plaque rupture in myo-cardial infarction. J Biomech. 2006;39:339–347. doi: 10.1016/j.jbiomech.2004.10.041. [DOI] [PubMed] [Google Scholar]
- Virmani R, Burke AP, et al. Pathology of the unstable plaque. Prog Cardiovasc Dis. 2002;44(5):349–356. doi: 10.1053/pcad.2002.122475. [DOI] [PubMed] [Google Scholar]
- Virmani R, Burke AP, et al. Pathology of the vulnerable plaque. J Am Coll Cardiol. 2006;47(8 Suppl):C13–C18. doi: 10.1016/j.jacc.2005.10.065. [DOI] [PubMed] [Google Scholar]
- Yuan C, Kerwin WS. MRI of atherosclerosis. J Magn Reson Imaging. 2004;19(6):710–719. doi: 10.1002/jmri.20070. [DOI] [PubMed] [Google Scholar]
- Yushkevich PA, Piven J, et al. User-guided 3D active contour segmentation of anatomical structures: significantly improved efficiency and reliability. Neuroimage. 2006;31(3):1116–1128. doi: 10.1016/j.neuroimage.2006.01.015. [DOI] [PubMed] [Google Scholar]


