

Abstract
In normal somatic cells, telomere length shortens with each cell replication. This progressive shortening is associated with cellular senescence and apoptosis. Germ cells, stem cells, and the majority of cancer cells express telomerase, an enzyme that extends telomere length and, when expressed at sufficient levels, can immortalize or extend the life span of a cell line. It is believed that telomeres switch between two states: capped and uncapped. The telomere state determines its accessibility to telomerase and also the onset of senescence. One hypothesis is that the t loop, a large lariat-like structure, represents the capped state. In this paper we model a telomere state on the basis of the biophysics of t-loop formation, allowing us to develop a single mathematical model that accounts for two processes: telomere length regulation for telomerase positive cells and cellular senescence in somatic cells. The model predicts the steady-state length distribution for telomerase positive cells, describes the time evolution of telomere length, and computes the life span of a cell line on the basis of the levels of TRF2 and telomerase expression. The model reproduces a wide range of experimental behavior and fits data from immortal cell lines (HeLa S3 and 293T) and somatic cells (human diploid fibroblasts) well. We conclude that the t loop as the capped state is a quantitatively reasonable model of telomere length regulation and cellular senescence.
Keywords: mathematical model, telomerase, telomeres
Telomeres are noncoding repetitive sequences of DNA at the end of the chromosomes of eukaryotic cells. They play an important role in “hiding” the end of the chromosomes from the DNA damage response pathway. Dysfunctional telomeres may be interpreted as DNA breaks that may lead to nonhomologous end joining and may trigger senescence or apoptosis through the p53 and p16-RB pathways (1, 2).
Because of the linear nature of eukaryotic DNA and the unidirectional synthesis of DNA polymerases, normal human somatic cells are unable to replicate their DNA completely (3). It is also believed that telomeres are actively degraded by an unknown exonuclease (4). These processes together with the action of oxidative stress (5) result in the progressive shortening of telomeres. Both in vivo and in vitro telomere lengths correlate with cellular life span.
Germ cells, stem cells, and cancer cells (in approximately 85% of cancer types) express telomerase, an enzyme that extends telomere length (6). Cells that express telomerase at sufficient levels maintain a stable telomere length and have an unlimited replication capacity (7). Furthermore, it has been shown that the introduction of telomerase into normal human cells can extend the life span of a cell culture (8).
The function and dynamics of telomeres depend on the action of several proteins that interact with chromosome ends. Particular attention has been given to shelterin, a complex of six telomere-specific proteins that protect and reshape telomeres (9). A key feature of shelterin is its ability to reshape telomeres into a large lariat- or lasso-like structure called a t loop (10, 11). It has been proposed that in the t loop the end of a telomere is tucked in and thus hidden from the DNA damage response pathways and from telomerase. In this paper we develop a mathematical model of telomere length regulation and cellular senescence on the basis of the biophysics of the t loop.
Deterministic Model
According to a widely proposed model for telomere length regulation, telomeres switch between two states: capped and uncapped. In the uncapped state the end of the telomere is accessible to telomerase, whereas in the capped state it is not. One hypothesis is that the probability of being in either of the two states is dependent on telomere length. The shorter the telomere, the higher the chance that it will be uncapped. Therefore a short telomere will have a high chance of being elongated by telomerase, whereas a long telomere will have a small chance of being uncapped and thus a small probability of being elongated (Fig. 1).
Fig. 1.

Telomere length regulation. (A) Type C (capped). A telomere in a t loop is not a substrate for telomerase. The longer the telomere, the higher the chance that it is in this state. (B) Type U (uncapped). An open telomere is a substrate for telomerase. The shorter the telomere, the higher the chance that it is in this state. (C) Type UT (telomere–telomerase complex). A telomerase-bound telomere is elongated by telomerase.
Telomere Shortening and Elongation.
The three main causes of telomere shortening are the incomplete replication of linear DNA (3), the processing of the 5′ strand by an unknown exonuclease (4), and unrepaired oxidative damage (5).
Mammalian telomeres have a long single-stranded overhang of TTAGGG repeats at the 3′ end (4). In the present paper, when we refer to the length l of a telomere, we mean the length of the 3′ strand, i.e., the strand that has its 3′ end at the end of the telomere. As shown in Fig. 2, the amount of telomere loss per generation will be determined by the length of the overhang immediately before replication. If a telomere with a 3′ strand of length l has an overhang of length μ, then the daughter lagging strand will have a 3′ length of l, the daughter leading strand will have a 3′ length of l - μ, and the mean telomere loss will be μ/2. In the deterministic model μ is a parameter that represents the average length of a telomere overhang.
Fig. 2.

Schematics of telomere shortening (17). The length of the 3′ strand is shown to the right of each telomere. (A) Before replication, the length of the 3′ strand is l, and the length of the overhang is μ. (B) Immediately after replication, the lagging strand has a 3′ length of l and an overhang length determined by the position of the last RNA primer. The leading strand has a 3′ length l - μ and no overhang. (C) Processing of the 5′ strand by an exonuclease increases the length of the overhang, while keeping the length of the 3′ strands constant. In the deterministic model, μ = ν = ξ; in the stochastic model, these are random numbers.
To model telomere elongation we note that telomerase is a processive enzyme that adds telomeric repeats to the end of the chromosome. If telomerase is bound to a telomere for a time period Δt, the telomere will be lengthened by ρΔt, where ρ is the elongation rate of telomerase.
Telomeres as Polymers.
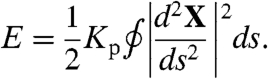
We model telomeric chromatin as a semiflexible polymer; this model is known in the literature as a worm-like chain (12). If X(s) gives the position of a point on the polymer in 3D space (parametrized by arc length), then the total energy is given by Eq. 1. Kp is related to the persistence length Lp by the equation Kp = LpkBT, where kB is Boltzmann’s constant and T is the absolute temperature.
 |
[1] |
To form a t loop, the telomere end must come into close proximity to an internal position of the telomere. For this reason we are interested in the fraction of chains in thermodynamic equilibrium (see the next subsection) for which the end lies within a distance d of at least one internal site. This fraction f(l) is length-dependent.
On a computer we represent the polymer as a sequence of points X1…Xn that satisfy |Xk - Xk+1| = Δs (a fixed length). We use this discretization and Eq. 1 to develop an algorithm to sample chromatin chains from the equilibrium distribution. (See Methods.) The distances are measured from the point Xn to the points Xi that lie in the center of the chromatin cross-section.
Equilibrium Analysis.
TRF2 is a telomere binding protein that promotes the generation of t loops in vitro (10, 11). The residence time of TRF2 at telomeres is on the order of minutes or seconds (13). In contrast, the relevant time scale for looping and unlooping of chromatin by diffusion is on the order of milliseconds (14, 15). This disparity of time scales justifies the equilibrium analysis employed here.
The current model for t-loop formation in vitro requires that a TRF2 complex binds at the single-strand/double-strand telomeric junction. Once TRF2 is positioned at the end of the telomere, the t loop may form as a result of the interaction between a TRF2 complex bound at an internal site with the complex bound at the end (11). In vivo, the action of other proteins may be necessary to generate t loops. Special attention has been given to shelterin, a complex formed by six telomeric proteins (TRF1, TRF2, TIN2, Rap1, TPP1, and POT1) that protects chromosome ends (for a review, see ref. 9).
In our model, we consider only the role of TRF2. Specifically, a t loop may form only if the end of the telomere is within a distance d of an internal site and if TRF2 is present both at the end of the telomere and at the internal site. We define three types of chains: Type O represents the telomeres for which the end is at a distance greater than d of every internal site; type S represents those chains for which the end lies within distance d of at least one internal site, but the t loop has not formed; and type C represents those telomeres with t loops. Type-S chains can be further subdivided into four types: type  in which TRF2 is present neither at the end of the telomere nor at an internal site within reach of the telomere end; type
  in which TRF2 is present at the end but not at an internal site within reach; type
  in which TRF2 is not present at the end but is present at an internal site within reach; and type
  in which TRF2 is present both at the end and at an internal site within reach of the end of the telomere (SI Text). Type-O chains could be subdivided in a similar fashion, but this subdivision is not relevant for our analysis.
Given the disparity of time scales noted above between chromatin looping and the chemical kinetics of TRF2, the switching between S and O is occurring on a much faster time scale than the binding and unbinding of TRF2 to the telomere. Thus at any given moment, we can find the ratio [O]/[S] from equilibrium considerations. If, as in the previous subsection, f(l) is the fraction of chains of length l for which the end lies within a distance d of an internal site, we find f(l) = [S]/([S] + [O]).
In vivo, switching between the  and C states is a complicated process, because it involves not only the reaction between two bound TRF2 dimers, but also the strand invasion of the overhang in what is called the D loop (9). In our model we treat the switch between
  and C states as a first-order reaction with equilibrium constant y. Note that y is a dimensionless parameter as it is unaffected by the concentration of TRF2.
Given a fixed concentration of TRF2, for chains in state S let p be the probability that a TRF2 dimer is bound at a site within reach of the end of the chain, and let x = (1 - p)/p. Then Diagram 2 shows all possible states and the corresponding equilibrium constants:  2
2
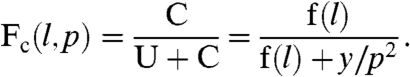
We are interested in the fraction of chains that are in t loops when the system is in equilibrium. From [2] and the previous expression for f(l), we can express the equilibrium concentration of every type of chain in terms of the equilibrium concentration of  . If we call those chains that are in t loops U = O + S, this fraction Fc(l,p) is given by
 |
[3] |
The concentration of TRF2 is significantly higher than the concentration of binding sites. If we use an average telomere length of 10 kbp and a binding site length of 12 bp, then there are approximately 833 binding sites, a number that is probably smaller, because the presence of histones most likely hides an important number of them. Meanwhile, there are approximately 2 million copies of TRF2 in the nucleus (16). Given this disparity between the concentrations of TRF2 and binding sites, in Eq. 3 we treat x as independent of l. In this work we treat p as a concentration-dependent variable and look at the effect of varying p on the percentage of telomeres with t loops, for telomeres of a given length.
Length Regulation.
We propose that telomeres exist in three mutually exclusive states: state C for capped telomeres (the t loop), state U for uncapped free telomeres, and state UT for uncapped telomeres bound to telomerase. In state C, telomerase may not bind to the telomere. In state U, telomerase may bind. If the telomere switches from state U to state UT, its length will increase by an amount proportional to the time it spends in state UT (Fig. 1).
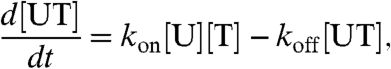
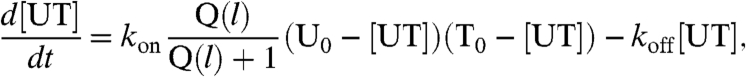
The variables of the model are l(t), the average length of telomeres in a cell at time t; [T](t), the concentration of free telomerase; and [C](t), [U](t), and [UT](t), the concentrations of telomeres in each of the three possible states. The rate of change of [UT] with respect to time is given in Eq. 4.
The switching between C and U states is occurring on a faster time scale than the transition between U and UT states. Whereas the time scale of t-loop formation is determined by the chemical kinetics of TRF2 (residence time of 44 sec) and the time scale of chromatin-loop formation (on the order of milliseconds), the average time that telomerase remains bound to a telomere is 70 min. Given that the association and dissociation of telomerase is a slow process (compared to the transition between U and C states), we can assume that for any given length l the ratio [U(l)]/[C(l)] remains constant. From Eq. 3 this fraction is given by Q(l) = y/(f(l)p2).
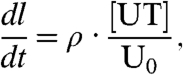
Cell replication is modeled as a discrete event, and the time between cell replications tr is assumed constant. On the basis of the discussion of telomere shortening, the average telomere length decreases by (μ/2) nm each time the cell divides. Because only telomeres in the UT state are elongated, the rate of elongation of the average length l is given by ρ[UT]/U0. The model is summarized by the following equations:
 |
[4] |
 |
[5] |
| [6] |
| [7] |
| [8] |
 |
[9] |
Stochastic Model
Several considerations show the need for a stochastic model that tracks the length of each individual telomere in a cell (instead of their average length): In any given cell, the length of the telomeres is not uniform but instead follows a cell-type-specific distribution (18); there is considerable variation in the length of the 3′ overhangs (19), suggesting randomness in the mechanisms that produce them; and, when telomerase positive cells were transfected with short tracts of telomeric DNA, these tracts were elongated until their lengths matched those of the telomeres in the transfected cells (18).
Following the deterministic model, if a telomere has a 3′ length of l and an overhang length of μ, then after replication the 3′ lengths of the daughter telomeres will be l and l - μ (Fig. 2). When deciding which daughter chromatid gets a 3′ telomere deletion, we have to consider that telomeres come in pairs (one telomere at each end of every chromosome). We note that the lagging strand with respect to the end of the p arm of a chromosome is the leading strand with respect to the q arm of that same chromosome and vice versa. If (lp,lq) represent the 3′ telomere lengths of the p and q arms of a chromosome and  and
and  the corresponding lengths of the overhangs, then after replication the 3′ telomere lengths of the daughter chromatids will be
 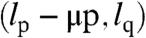 and
and  .
.
For any given daughter cell, each p telomere has a 50% chance of inheriting a deletion in its 3′ length. Whether or not this deletion occurs (along with the values of lp, lq,  , and
, and  ) determines the 3′ length of the q arm of the same chromosome and the corresponding p and q telomere lengths for that same chromosome in the sister cell. The overhang lengths μ are modeled as independent identically distributed random numbers (see Methods).
Telomere elongation follows the same scheme discussed in the deterministic model. Thus, even though the binding and unbinding of telomerase are modeled stochastically, the elongation rate of bound telomerase is treated deterministically.
We develop an algorithm, on the basis of Gillespie’s method (20), to simulate the time evolution of the length of every telomere in a cell (see Methods).
The algorithm simulates the attaching and detaching of telomerase to the telomeres, the elongation produced by telomerase, and the shortening that occurred during cell replication. By drawing from the calculations discussed in the deterministic model, the probability that telomerase binds with a free telomere depends on its length. A long telomere has a small chance of being uncapped and thus a small chance of being elongated by telomerase, whereas a short telomere has a higher chance of being uncapped and therefore a higher of being elongated by telomerase.
Senescence Model
Human cells that do not express telomerase at sufficient levels can divide only a limited number of times in vitro (20). This state of growth arrest in which they end up after reaching this limit is called cellular senescence.
It has been proposed that the onset of senescence is determined by telomere length (3). However, it is now known that the activation of the pathways that trigger senescence and apoptosis (the ATM-p53 or p16-RB pathways) are dependent not only on telomere length, but on the presence of various telomeric proteins (for reviews, see ref. 9). In particular, overexpression of TRF2 reduces the senescence set point (defined as the mean telomere length at which senescence occurs) (17), suggesting that what determines cellular senescence is not telomere length directly, but rather whether a telomere is in a protected or unprotected state (we shall identify this protected state with the t loop). The final outcome (either apoptosis or senescence) is probably dependent on cell type.
In our model a telomere can be in one of two states, protected or unprotected. Only when it is in the unprotected state may senescence be triggered. In the time between cell divisions we carry out the simulations following the stochastic model, and before replication proceeds we use the t loop as the basis to decide the state of a telomere. If at the time of replication the fraction of time that the telomere remains open O is less than some fixed parameter Os, the telomere is considered protected. If O is greater than Os, it is unprotected. If the telomere is unprotected, there is a probability αs that the cell will become senescent. If it does, the cell remains in the population, but it does not divide and it exits the cell cycle.
Results
Fig. 3 illustrates telomere length regulation of the average telomere length. Our simulations show that telomerase positive cells have a steady-state telomere length, dependent on the cell type. When the average length deviates from this equilibrium value, the system restores the average length back to its steady state. In the stochastic model, not only the average length but also the length of each individual telomere in a cell is controlled and kept within a cell-type-specific range. Using cells whose average telomere length had already settled around the expected value, we performed ten independent runs, each run spanning 4,000 cell generations. In these simulations every telomere in the cells remained between 5.1 and 8.5 kbp 98% of the time.
Fig. 3.

Cells that express telomerase at sufficient levels regulate telomere length. The simulations track the evolution of the mean telomere length l in cells of the same type with different initial lengths. Note that the expected telomere length depends only on the cell type and not on the initial lengths of the telomeres. (A) uses the deterministic model and (B) the stochastic model.
To study the stability properties of the system and to determine the steady-state mean telomere length le, replace Eq. 9 by a continuous linear shortening and simplify Eqs. 4–9, which leads to a reduced model described by the following equations (in SI Text we verify that on the time scale of cell generations the two formulations produce nearly identical results):
 |
[10] |
 |
[11] |
The steady-state solution is
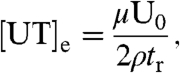 |
[12] |
 |
[13] |
Eqs. 10 and 11 allow one to compute the steady-state length le as a function of both the number of telomerase molecules in a cell and the probability p that TRF2 is bound to any given site in the telomere (Fig. 4). From this figure we verify the agreement between the stochastic and deterministic models. We note that a small difference between the two models is expected, given that in the deterministic model the ratio of open to closed free telomeres [U]/[C] depends on the average length of the telomeres in a cell, whereas in the stochastic model this ratio is determined independently for each telomere. Moreover, the deterministic formulation of chemical kinetics neglects fluctuations that may be significant in a chemical system with a small of number of molecules (21).
Fig. 4.

Equilibrium telomere length le as a function of (A) the number of telomerase molecules in a cell and (B) the probability p that any site in the telomere is bound to TRF2. The deterministic model is represented by the solid lines and the stochastic model by the circles (○). Error bars are smaller than the size of the symbols.
From the reduced model we note that if the number of telomerase molecules per cell falls below 29, then dl/dt < 0 and the telomere length eventually collapses to zero. At the other end of the spectrum, if the number of telomerase molecules is greater than 134, dl/dt > 0 and the telomere length continues to grow indefinitely throughout cell generations. The existence of an upper bound, for the number of telomerase molecules above which telomere length is not regulated, is explained by the fact that f(l) has an upper limit: f(l) is a fraction and thus never greater than one (although it may have an asymptote at a lower value). The model predicts that this behavior is true for any parameter choice: There is a minimum number of telomerase molecules (not necessarily zero) below which telomere length does not stabilize, resulting in the complete loss of all telomeric sequences, and a maximum number of telomerase molecules above which telomere length continues growing indefinitely and does not reach a steady-state telomere length.
The stability of the equilibrium point ([UT]e,le) is determined by the eigenvalues of the Jacobian, λ1 = -1.34 × 10⁻²/ min and λ2 = -3.11 × 10⁻⁶/ min. Because both eigenvalues are negative, ([UT]e,le) is a stable node and there is a neighborhood around it in which every trajectory asymptotically approaches it. Because λ1≫λ2, the overall dynamics of the system is characterized by rapid approach to a slow manifold, followed by a much slower evolution toward the equilibrium point along the slow manifold.
To fit data corresponding to the serial cultivation of cells, we simulated the cell culture process. We use the stochastic model to advance each cell, and when the cell culture reaches a specified population limit, half of the cells are harvested at random. Typical cell cultures used in laboratories have approximately 106 cells. Because of computational constraints, however, we used a target population size of 104 cells.
In Fig. 5(B) we fit the model to telomere length distributions of HeLa S3 and 293T cells (22). Because these are immortalized cell lines, we compared the experimental distributions to steady-state distributions predicted by the model.
Fig. 5.

(A) Telomere length distribution at different population doublings. The data corresponding to HDF cells are taken from Martens et al. (23). (B) Telomere length distribution of immortal cell lines. The data are taken from Canela et al. (22). The model’s results are steady-state distributions. In both panels, experimental data are shown in histograms and simulation results in solid lines.
In Fig. 5(A) we fit senescence data from human diploid fibroblasts (HDFs) (23). The model starts from an initially Gaussian telomere length distribution; as the life span of the cell cultures progresses, the mean decreases and the distribution becomes increasingly positively skewed.
Discussion
This paper models telomere length regulation (in telomerase positive cells) and cellular senescence (in somatic cells) within a unified framework. Previous models have considered these issues separately. Only one previous paper, developed by Kowald (24), models telomere length regulation quantitatively, by using the hypothesis that the capped telomere state depends solely on the sequestration of the 3′ overhang by a capping protein. The current paper presents a telomere length regulation model on the basis of the t loop that includes a length sensing feedback loop.
Cellular senescence was first modeled as depending directly on telomere length (25–27). Recent studies, however, indicate that the telomere state (protected or unprotected), rather than telomere length, determines the fate of a cell. We note that Arkus (16) and Proctor and Kirkwood (28) introduced a telomere state in their senescence models. Arkus modeled the telomere state as a function of the energy of telomeres bound or unbound to TRF2, and Proctor and Kirkwood modeled the telomere state by using Hill's equation. This paper models the telomere state on the basis of the biohysics of t-loop formation. Our model also produces quantitatively different results. Proctor and Kirkwood predicted a mean telomere length at the time of senescence of approximately 6 kbp, and the model by Arkus produces a binomial distribution of telomere length. Our model, in agreement with data (23), predicts a progressively positively skewed distribution as the cell culture ages and an accumulation of short telomeres (average 2.9 kbp) at the time of senescence.
A prediction of the model is that only a small number of telomerase molecules are needed to immortalize a cell line. In Fig. 4 as few as 29 telomerase molecules per cell were sufficient. Furthermore, in our simulations we found that as few as five telomerase molecules were enough to expand the life span of a cell culture by five population doublings. We also found that the number of telomerase molecules has a threshold value above which telomere length grows without bound, a behavior observed in HeLa and 293T cells. The model predicts that the same is true for every type of cell, although possibly with a different threshold in different cell types.
To test the model further, it is possible to devise experiments that vary one of the model’s parameters at a time. Model predictions on the effects of varying this parameter can then be compared to experimental results. For example, the mean length of the overhang μ can be varied by subjecting a group of cells to different levels of oxidative stress (5); the fraction p of TRF2 binding sites in the telomere occupied by the protein can be varied by infecting cells with retroviruses expressing TRF2 (17); and the number of telomerase molecules nT0 can be varied by transfecting cells with human telomerase reverse transcriptase constructs (8). In each of these experiments, the distribution of telomere length can measured for different values of the corresponding parameter. The experimental results can then be compared to the model’s predictions. If the chosen cells are somatic cells, the distributions should be measured at different population doublings of the cell culture; if they come from immortal cells lines, they can be interpreted as steady-state distributions.
Finally, we note that there are other factors not considered in this paper that play important roles in telomere biology. In particular, TRF1 and POT1 have been shown to regulate telomere length. It has been proposed that TRF1 loads POT1 to the end of the 3′ overhang, sequestering the overhang and stabilizing the t-loop structure. How exactly this is achieved is not known. A possible explanation is that there is a flexible linker between TRF1 and POT1 (9), and in the t-loop configuration more TRF1 molecules are positioned near the telomere terminus allowing a bound POT1 molecule to access the overhang. An extended version of the model including TRF1 and POT1 will be the subject of future investigation.
Materials and Methods
Stochastic Algorithm.
The basic variables for a cell with N chromosomes are the lengths li(t) (i = 1,…,2N) of each telomere at time t. The definitions of telomere states and the corresponding transition rules are identical to the deterministic model. For every telomere i, we define the variable Ai(t) that satisfies Ai(t) = 0 if the telomere is free (C and U states), and Ai(t) = 1 if the telomere is in a complex (UT state). The number of free telomerase molecules is given by nT(t) and the total number of telomerase molecules (free or bound) by nT0. Finally, we use the name  for the reaction in which telomerase detaches from telomere i and
  for the reaction in which telomerase attaches to telomere i.
Let con be the average probability per unit of time that a specific telomere in state U reacts with a specific telomerase molecule T to form a complex UT. Following the discussion for the deterministic model, we assume that the transition between states C and U occurs on a faster time scale than the binding and unbinding of telomerase. Therefore, at any given time t, the probability that a free telomere of length l is in state U and not C is given by Q(l)/(Q(l) + 1). Then to first order in δt, the average probability that reaction  occurs in the next time interval δt is
  , where
  is given by
 |
[14] |
Similarly, to first order in δt, the average probability that reaction  occurs in the next time interval δt is
  , where
  is given by
| [15] |
Note that for any particular telomere i, at any given time, only one of the variables  or
or  is nonzero, which means that at a specific time t only one of the reactions
  or
or  is possible.
At any given time t, the state of the system is described by the 4N + 1 numbers l1(t),…,l2N(t), A1(t),…,A2N(t), and 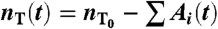 . In the time between cell replications, the system is advanced by carrying out the following steps:
- Generate a random number T from the probability density function PT(τ; a) defined below and set the time when the next reaction occurs to t + T.

[16] 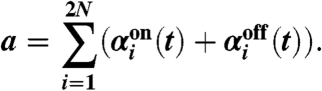
[17] Set the length of every telomere i at time t + T to li(t) + ρT(1 - Ai(t)).
For i = 1,…,2N, the probability that
 will be the next reaction is
  and the probability that it will be
  is
is  . On the basis of these probabilities, determine for which telomere k a reaction occurs.
If the reaction that occurred involved the kth telomere, update Ak(t + T) and nT(t + T) accordingly. For every other telomere, set Ai(t + T) = Ai(t).
Telomeres as Polymers Algorithm.
We can rewrite Eq. 1 as a function of the bond angles ϕk between Xk - Xk-1 and Xk+1 - Xk: 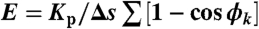 . These angles are independent of each other. Furthermore, Boltzmann’s distribution allows us to compute the probability density function of any angle ϕk under conditions of thermodynamic equilibrium. It follows that this density is proportional to sin(ϕ) exp(-Lp(1 - cos ϕ)/Δs), which suggests an algorithm to generate sample chains taken from the thermodynamic equilibrium distribution.
To generate a random chain (up to translation and rotation), first choose X1 and X2 such that |X2 - X1| = Δs. Once we have Xk, generate ϕk from the distribution previously described. This angle defines a circle of possible points, all of which contribute the same amount of energy to the polymer. Choose Xk+1 uniformly distributed in this circle. Finally, if we want to model loops, we have to exclude as possible sites those that are always very close to the end of the telomere. For example, because Δs < d, if we include Xn-1 as a possible site to form a loop, then every chain could potentially form one. So we set the minimal loop size at one persistence length (a value greater than d). This choice is not very restrictive, as polymers of length Lp are by definition very stiff.
Determination of Parameters.
Scanning force microscopy analysis of end-to-end distances of chromatin fibers supports values of Lp = 30–50 nm (for a discussion, see ref. 15). In this paper we use a value of Lp = 40 nm. Telomere chromatin fibers observed by EM exhibit an irregular diameter that ranges from 10 to 30 nm (29). In our model we choose the diameter as the average of these two values (d = 20 nm). In Results, telomere length refers to the length of uncoiled DNA in base pairs; henceforth, the length of telomeric chromatin is multiplied by 60 to account for a nucleosome packing ratio of 1∶20 (29) and a length of 0.33 nm per base pair.
To compute the values of T0 and U0, we assume a nucleus diameter of 6 μm. Note that the value of U0 is a cell-type-specific characteristic. The time between cell replications is assumed to be 1 day (tr = 1,440 min).
The dissociation rate of telomerase (koff) has been measured in vitro; at 37 °C it has a value of 0.01 min-1 (30). We estimate a value kon of 5 × 10⁻³ (nm·nM)-1 from the values for Km and koff reported by ref. 30. The value of coff = koff. con is related to kon by the equation 10-9NAVcon = kon, where V is the volume of the nucleus (in liters) and NA is Avogadro’s number. The factor 10-9 appears because the units of kon are nM-1 min-1 instead of M-1 min-1.
Telomerase adds between 4 and 24 bp before the half-life of the telomere–telomerase complex is reached (31). This quantity R1/2 is a measure of the processivity of the enzyme. The elongation rate ρ can be calculated from R1/2 and koff using the equation ρ = koffR1/2/(log(2)60 bp/nm), which means that ρ lies between 9.74 × 10⁻⁴ and 5.71 × 10⁻³ nm/ min. In this paper we use the lower limit of ρ.
The distribution of the length of the 3′ overhang μ is a cell-type-specific characteristic (19). To study how it affects telomere length, we tried three alternative distributions (SI Text). Although the model is sensitive to changes to the mean of μ, the trial distributions gave essentially the same results.
The number of telomeres per cell N is determined by the chromosome number of each cell type: N = 92 for normal human cells [Figs. 3, 4, and 5(A)]; N = 128 for 293T cells [Fig. 5(B)]; and N = 164 for HeLa S3 cells [Fig. 5(B)].
The parameters varied in this model are nT0, μ, and p (all of them cell-type-specific). For Figs. 3 and 4, we use (μ = 1.9 nm, p = 0.7, nT0 = 60). In Fig. 5, we use (μ = 2.2 nm, p = 0.26, nT0 = 45) for 293T cells and HeLa S3 cells and (μ = 2.2 nm, p = 0.9, nT0 = 13) for HDF cells.
Supplementary Material
Acknowledgments.
The authors thank Titia de Lange and Peter Lansdorp for helpful discussions. I.A.R.-B. was supported in part by NSF Grant DMS-0507901, and C.S.P. was supported in part by NIH Grant P50GM071558.
Footnotes
The authors declare no conflict of interest.
This article contains supporting information online at www.pnas.org/cgi/content/full/0914502107/DCSupplemental.
References
- 1.Karlseder J, Broccoli D, Dai Y, Hardy S, de Lange T. p53- and atm-dependent apoptosis induced by telomeres lacking trf2. Science. 1999;283:1321–1325. doi: 10.1126/science.283.5406.1321. [DOI] [PubMed] [Google Scholar]
- 2.Smogorzewska A, de Lange T. Different telomere damage signaling pathways in human and mouse cells. EMBO J. 2002;21:4338–4348. doi: 10.1093/emboj/cdf433. [DOI] [PMC free article] [PubMed] [Google Scholar]
- 3.Olovnikov AM. A theory of marginotomy. The incomplete copying of template margin in enzymic synthesis of polynucleotides and biological significance of the phenomenon. J Theor Biol. 1973;41:181–190. doi: 10.1016/0022-5193(73)90198-7. [DOI] [PubMed] [Google Scholar]
- 4.Makarov VL, Hirose Y, Langmore JP. Long g tails at both ends of human chromosomes suggest a c strand degradation mechanism for telomere shortening. Cell. 1997;88:657–666. doi: 10.1016/s0092-8674(00)81908-x. [DOI] [PubMed] [Google Scholar]
- 5.von Zglinicki T. Oxidative stress shortens telomeres. Trends Biochem Sci. 2002;27:339–344. doi: 10.1016/s0968-0004(02)02110-2. [DOI] [PubMed] [Google Scholar]
- 6.Kim NW, et al. Specific association of human telomerase activity with immortal cells and cancer. Science. 1994;266:2011–2015. doi: 10.1126/science.7605428. [DOI] [PubMed] [Google Scholar]
- 7.Counter CM, et al. Telomere shortening associated with chromosome instability is arrested in immortal cells which express telomerase activity. EMBO J. 1992;11:1921–1929. doi: 10.1002/j.1460-2075.1992.tb05245.x. [DOI] [PMC free article] [PubMed] [Google Scholar]
- 8.Bodnar AG, et al. Extension of life-span by introduction of telomerase into normal human cells. Science. 1998;279:349–352. doi: 10.1126/science.279.5349.349. [DOI] [PubMed] [Google Scholar]
- 9.de Lange T. Shelterin: The protein complex that shapes and safeguards human telomeres. Genes Dev. 2005;19:2100–2110. doi: 10.1101/gad.1346005. [DOI] [PubMed] [Google Scholar]
- 10.Griffith JD, et al. Mammalian telomeres end in a large duplex loop. Cell. 1999;97:503–514. doi: 10.1016/s0092-8674(00)80760-6. [DOI] [PubMed] [Google Scholar]
- 11.Stansel RM, de Lange T, Griffith JD. T-loop assembly in vitro involves binding of trf2 near the 3′ telomeric overhang. EMBO J. 2001;20:5532–5540. doi: 10.1093/emboj/20.19.5532. [DOI] [PMC free article] [PubMed] [Google Scholar]
- 12.Kratky O, Porod G. X-ray examination of solved filamentary molecules. Recl Trav Chim Pay-B. 1949;68:1106–1123. [Google Scholar]
- 13.Mattern KA, et al. Dynamics of protein binding to telomeres in living cells: Implications for telomere structure and function. Mol Cell Biol. 2004;24:5587–5594. doi: 10.1128/MCB.24.12.5587-5594.2004. [DOI] [PMC free article] [PubMed] [Google Scholar]
- 14.Toan NM, Marenduzzo D, Cook PR, Micheletti C. Depletion effects and loop formation in self-avoiding polymers. Phys Rev Lett. 2006;97:178302. doi: 10.1103/PhysRevLett.97.178302. [DOI] [PubMed] [Google Scholar]
- 15.Langowski J. Polymer chain models of DNA and chromatin. Eur Phys J E. 2006;19:241–249. doi: 10.1140/epje/i2005-10067-9. [DOI] [PubMed] [Google Scholar]
- 16.Arkus N. A mathematical model of cellular apoptosis and senescence through the dynamics of telomere loss. J Theor Biol. 2005;235:13–32. doi: 10.1016/j.jtbi.2004.12.016. [DOI] [PubMed] [Google Scholar]
- 17.Karlseder J, Smogorzewska A, de Lange T. Senescence induced by altered telomere state not telomere loss. Science. 2002;295:2446–2449. doi: 10.1126/science.1069523. [DOI] [PubMed] [Google Scholar]
- 18.Sprung CN, Reynolds GE, Jasin M, Murnane JP. Chromosome healing in mouse embryonic stem cells. Proc Natl Acad Sci USA. 1999;96:6781–6786. doi: 10.1073/pnas.96.12.6781. [DOI] [PMC free article] [PubMed] [Google Scholar]
- 19.Huffman KE, Levene SD, Tesmer VM, Shay JW, Wright WE. Telomere shortening is proportional to the size of the g-rich telomeric 3′-overhang. J Biol Chem. 2000;275:19719–19722. doi: 10.1074/jbc.M002843200. [DOI] [PubMed] [Google Scholar]
- 20.Hayflick L, Moorhead PS. The serial cultivation of human diploid cell strains. Exp Cell Res. 1961;25:585–621. doi: 10.1016/0014-4827(61)90192-6. [DOI] [PubMed] [Google Scholar]
- 21.Gillespie DT. A general method for numerically simulating the stochastic time evolution of coupled chemical reactions. J Comput Phys. 1976;22:403–434. [Google Scholar]
- 22.Canela A, Vera E, Klatt P, Blasco MA. High-throughput telomere length quantification by fish and its application to human population studies. Proc Natl Acad Sci USA. 2007;104:5300–5305. doi: 10.1073/pnas.0609367104. [DOI] [PMC free article] [PubMed] [Google Scholar]
- 23.Martens UM, Chavez EA, Poon SS, Schmoor C, Lansdorp PM. Accumulation of short telomeres in human fibroblasts prior to replicative senescence. Exp Cell Res. 2000;256:291–299. doi: 10.1006/excr.2000.4823. [DOI] [PubMed] [Google Scholar]
- 24.Kowald A. Possible mechanisms for the regulation of telomere length. J Mol Biol. 1997;273:814–825. doi: 10.1006/jmbi.1997.1305. [DOI] [PubMed] [Google Scholar]
- 25.Levy MZ, Allsopp RC, Futcher AB, Greider CW, Harley CB. Telomere end-replication problem and cell aging. J Mol Biol. 1992;225:951–960. doi: 10.1016/0022-2836(92)90096-3. [DOI] [PubMed] [Google Scholar]
- 26.Tan Z. Intramitotic and intraclonal variation in proliferative potential of human diploid cells: Explained by telomere shortening. J Theor Biol. 1999;198:259–268. doi: 10.1006/jtbi.1999.0914. [DOI] [PubMed] [Google Scholar]
- 27.Proctor CJ, Kirkwood TBL. Modelling telomere shortening and the role of oxidative stress. Mech Ageing Dev. 2002;123:351–363. doi: 10.1016/s0047-6374(01)00380-3. [DOI] [PubMed] [Google Scholar]
- 28.Proctor CJ, Kirkwood TBL. Modelling cellular senescence as a result of telomere state. Aging Cell. 2003;2:151–157. doi: 10.1046/j.1474-9728.2003.00050.x. [DOI] [PubMed] [Google Scholar]
- 29.Nikitina T, Woodcock CL. Closed chromatin loops at the ends of chromosomes. J Cell Biol. 2004;166:161–165. doi: 10.1083/jcb.200403118. [DOI] [PMC free article] [PubMed] [Google Scholar]
- 30.Wallweber G, Gryaznov S, Pongracz K, Pruzan R. Interaction of human telomerase with its primer substrate. Biochemistry. 2003;42:589–600. doi: 10.1021/bi026914a. [DOI] [PubMed] [Google Scholar]
- 31.Wang F, et al. The pot1-tpp1 telomere complex is a telomerase processivity factor. Nature. 2007;445:506–510. doi: 10.1038/nature05454. [DOI] [PubMed] [Google Scholar]
Associated Data
This section collects any data citations, data availability statements, or supplementary materials included in this article.