

Abstract
Cell differentiation in multicellular organisms is a complex process whose mechanism can be understood by a reductionist approach, in which the individual processes that control the generation of different cell types are identified. Alternatively, a large-scale approach in search of different organizational features of the growth stages promises to reveal its modular global structure with the goal of discovering previously unknown relations between cell types. Here, we sort and analyze a large set of scattered data to construct the network of human cell differentiation (NHCD) based on cell types (nodes) and differentiation steps (links) from the fertilized egg to a developed human. We discover a dynamical law of critical branching that reveals a self-similar regularity in the modular organization of the network, and allows us to observe the network at different scales. The emerging picture clearly identifies clusters of cell types following a hierarchical organization, ranging from sub-modules to super-modules of specialized tissues and organs on varying scales. This discovery will allow one to treat the development of a particular cell function in the context of the complex network of human development as a whole. Our results point to an integrated large-scale view of the network of cell types systematically revealing ties between previously unrelated domains in organ functions.
Keywords: complex network, modular organization, self-similarity, stem cells
The cell differentiation process plays a crucial role in the prenatal development of multicellular organisms. Recent advances in the research on stem cell properties and embryonic development have uncovered several steps in the differentiation process (1–7). Single and multiple sequences of cell differentiation have been identified through in vivo observations of a particular embryo during early stages of development and through pathology studies of miscarriages during late stages of the process. While the identification of each cell differentiation step has been the subject of intense research, an integrated view of this complex process is still missing. Such a global view promises to reveal features associated with the large-scale modular organization of the cell types (5–12) with the purpose of discovering functional modules between cell types by using theoretical network analysis for community detection (9–11). In this letter, we take advantage of the current knowledge on the sequence of cell differentiation processes that is spread over a vast specialized literature (1–6, 13–27) (SI Appendix), to reveal and characterize the topological and dynamical features associated with the network of human cell differentiation (NHCD).
I. Results
We construct the NHCD by systematically gathering the scattered information on the evolution of each cell type present in the embryo and fetus from a predecessor with a higher degree of differentiation potential into a more specialized type. The process of cell differentiation is then mapped onto a complex network that consists of 873 nodes connected through 977 edges. The nodes in the network represent distinct cell types reported in the literature (1–6, 13–27) and the edges represent the association between two cell types through a differentiation event.
The initial steps of the NHCD are shown in the Inset of Fig. 1, while the resulting network structure is shown in the main panel of Fig. 1 (SI Appendix). The fertilized egg is followed by the ball stage, and the formation of the primary germ cell layers. Currently, it is known that until the ball stage, cell division is symmetric and produces further totipotent stem cells (1). These cells then give rise to all the differentiated tissues of the organism as well as the extraembryonic tissues (placenta, umbilical cord, etc.). Moreover, in the course of the entire process of organism formation, there is a monotonic decrease in the differentiation potential (totipotent → pluripotent → multipotent → unipotent cells) accompanied with an increase in cell specialization.
Fig. 1.

Complex network representation of the human cell differentiation process. The first steps of the NHCD construction are shown in the Inset of this figure. These steps, known to also be present in the formation of the majority of multicellular organisms, include the first cleavage of a fertilized egg, that is, subsequently, followed by the ball stage and the formation of primary germ cell layers, namely, the ectoderm, mesoderm, and endoderm. The fertilized egg is a totipotent stem cell. The blastocyst, in turn, gives rise to both trophoblast and inner cell mass. These two cells further differentiate into other types of cells, and so on. Following the above process until the fetus is fully developed yields the complex network shown in this figure. Each node, plotted as a circle, corresponds to a cell type and the edges to a differentiation step. The entire network originates from the fertilized egg (denoted by a Red Square) and leads to the specialized cells of a developed human. Filled Circles correspond to nodes that survive at the end of the development process, whereas Empty Circles correspond to nonsurviving cell types. Nodes in communities of known functions from the literature are indicated by different colors, except for those cell types with no functional annotation (see SI Appendix and Dataset S1 for association to the known functions C1 to C19 extracted from the literature).
Certain types of cells can be generated following more than one path from the fertilized egg. This process generates some closed loops of edges in the network. The NHCD comprises 529 branches of different lengths with each branch ending when the cell types do not undergo further differentiation. Note, however, that the most recent compilation of cell types in normal, healthy, human adults done in (6) reports only 407 cell types. Therefore, not all branch endpoints correspond to cell types in born humans. Thus, not all 873 cell types are present in a human being. Among those absent are the placenta cells that are generated from the fertilized egg during embryo development, as well as other somatic cell types that are important to control embryo and fetus development. The cell types that survive in a human are denoted by filled circles, while nonsurviving ones are indicated by empty circles. The complete collected data are listed in the SI Appendix and Dataset S1, including an enumeration of cells and links between the cell types, their time of appearance in days after fecundation (Ta), and the reference to the publications reporting each link. To the best of our knowledge, the structure identified here provides the most complete schematic diagram of the human differentiation process to date.
It is visually apparent from Fig. 1 that the NHCD has a prominent modular structure. The continuous differentiation of cells into more specialized functions naturally leads to the formation of dense isolated clusters in the NHCD. As a first approach to understand this modular structure, we cluster cell types in the network of Fig. 1 according to their known functions; different colors indicate 19 functional modules extracted from the literature (C1-C19) (SI Appendix). The largest communities were extracted from refs. 1–6, 13–27. There is, however, a certain degree of arbitrariness in this modular structure as the separation of the nodes into communities in our dataset is not unique. For instance, community C12, the neural lineage, could be divided into two subcommunities, representing the neural and the supporting (glial) cells (1–3, 5, 6, 13,14). On the other hand, the neural system module could be merged with the eye system module (1, 5, 6, 13) on a larger scale because they have a common ancestral cell type. Therefore, a finer or coarser community structure can be extracted from the data when we look at the whole network at different scales of observation; a modified module-detection algorithm is needed to identify these communities in a systematic way.
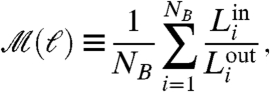
Graph theoretical concepts allow us to unravel the scale dependence of the modular structure of the NHCD. Graph theory (11) defines the distance between two nodes (also called the chemical distance) as the number of links along the shortest path between the nodes in the network. We use this notion to propose a community detection algorithm that identifies modules of size ℓ composed of highly connected cell types. The algorithm finds the optimal tiling of the network with the smallest possible number of modules, NB, of size ℓ (12) (each node is assigned to a module or box and all nodes in a module are at distance smaller than ℓ). This process results in an optimization problem that can be solved by using the box-covering algorithm explained in Fig. 2A, Materials and Methods Section III and reported in ref 28 as the Maximum Excluded Mass Burning algorithm (MEMB, the algorithm can be downloaded from http://lev.ccny.cuny.edu/~hmakse/soft_data.html). The requirement of minimal number of modules to cover the network (NB) guarantees that the partition of the network is such that each module contains the largest possible number of nodes and links inside the module with the constraint that the modules cannot exceed size ℓ. This optimized tiling process gives rise to modules with the fewest number of links connecting to other modules implying that the degree of modularity, defined by (9–11, 29)
 |
[1] |
is maximized. Here,  and
and  represent the number of links that start in a given module i and end either within or outside i, respectively. Large values of
  (
(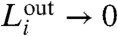 ) correspond to a higher degree of modularity. The value of the modularity of the network
  varies with ℓ, so that we can detect the dependence of modularity on different length scales, or equivalently how the modules themselves are organized into larger modules that enhance the degree of modularity.
Fig. 2.

Detection of modules and the network of modules at different scales. (A) Demonstration of the box-covering algorithm for a schematic network, following the MEMB algorithm in refs. 12 and 28 (SI Appendix). We cover the network with the smallest possible number of boxes for a given ℓ value. This is done in a two-stage process: (i) We detect the smallest possible number of box origins (shown with Cyan color) that provide the maximum number of nodes (mass) in each box, according to the following optimization algorithm: We calculate the mass associated with each node, and pick the first center as the node with largest mass and mark the nodes in this box as tagged. We repeat the process from the remaining noncenter nodes to identify a second center with the highest mass, and so on. (ii) We build the boxes through simultaneous burning from these center nodes until the entire network is covered with boxes. For example, at ℓ = 3 there are four boxes where the maximum distance between any two nodes in a box is smaller than ℓ. Similarly, we can cover the same network with two boxes at ℓ = 6. These two boxes are the result of merging two of the four boxes at ℓ = 3. (B) Detail of NHCD modules detected by the above box-covering algorithm for two particular functions. The algorithm detects a hierarchy of sub-modules, known functions and super-modules of size ℓ plotted in different colors. We show the identified modules corresponding to C12-neural system and C13-eye system (Fig. 2C and SI Appendix) that first appear at ℓ = 15 and ℓ = 11, resp. At other scales the box-covering algorithm detects new functional relations between cell types expressed in the obtained sub and super-modules. For instance, at ℓ = 11 the neural lineage is further divided into two sub-modules, whereas at ℓ = 19 the two functions merge into a super-module. (C) The network of modules at different ℓ values, as detected through the box-covering algorithm. Every node corresponds to one of the three following types, in terms of increasing scale: (i) Sub-modules (small Gray Dots) that are fractions of a fully functional module, (ii) Known functional biological modules (Colored Circles), whose color corresponds to the functions C1-C19, and (iii) Super-modules (Pie-Charts) that represent the union of more than one known functional module, described by the colors of the pie-chart. The links that stem from known functional modules and super-modules are shown in Red, and they progressively span the entire network as we increase ℓ.
For a given ℓ, we obtain the optimal coverage of the network with NB modules [we use the MEMB algorithm (28) explained in Fig. 2A and Materials and Methods]. Analysis of the modularity (Eq. 1) in Fig. 3A reveals a monotonic increase of  with a lack of a characteristic value of ℓ. Indeed, the data can be approximately fitted with a power-law functional form:
| [2] |
that is detected through the modularity exponent dM. We characterize the network by using different snapshots in time and we find that dM ≃ 2.0 is approximately constant over the time evolution (Fig. 3A). This value reveals a considerable degree of modularity in the entire system [for comparison, a random network has dM = 0 and a uniform lattice has dM = 1 (29)], as evidenced by the network structure in Fig. 1. The lack of a characteristic length-scale in the modularity shown in Fig. 3A suggests that the modules appear at all length-scales, i.e., modules are organized within larger modules in a self-similar way, so that the interconnections between those clusters repeat the basic modular character of the entire NHCD. Thus, the NHCD remains statistically invariant when observed at different scales. Varying the module size ℓ yields the scaling relation for the number of modules (Fig. 3B):
| [3] |
where dB represents the fractal dimension of the network (12). We find that the fractal character of the modules is established at the early stages, yielding dB ≃ 1.4 as early as 30 d (Fig. 3B). As the network evolves, the fractal dimension increases slightly and finally reaches dB ≃ 1.9.
Fig. 3.

Modular properties of the NHCD. (A) Degree of modularity of the network,  , at different times, t (indicated in the figure), as a function of the scale of observation, ℓ. (B) Number of boxes/modules, NB, versus the size of the modules, ℓ, identified by the box-covering algorithm for different networks at time t.
The significance of Eq. 2 is that the modules need to be interpreted at a given length-scale. Figure 2B shows an example of such hierarchical organization (Fig. 2C and the SI Appendix show the full modular structure, while a list of detected modules appears in Dataset S2). Three types of communities of cell types are clearly identified in Fig. 2B as we change ℓ. (i) The known functional modules: The entire eye lineage (1, 5, 6, 13) is detected as a single module by the box-covering algorithm at ℓ = 11, while the entire neural lineage (1–3, 5, 6, 13, 14) appears at ℓ = 15. Finer and coarser modules are identified by the algorithm. (ii) Sub-modules: At ℓ = 11 the neural lineage is split into the main neural and the supporting glial cell modules, while for ℓ = 7 sub-modules are identified in the eye system. (iii) Super-modules: When we increase the length to ℓ = 19, the eye and neural system form a single super-module. Thus, each cell type is connected to other types according to which groups of nodes of all sizes self-organize following a single principle. This property allows us to renormalize the network (12) by replacing each detected module by a single supernode to identify the network of modules as shown in Fig. 2C. Following the evolution and interdependence of these super-modules, as seen in Fig. 2C, identifies families of cell types at varying scales. This modularity map is useful in proposing future research ties between previously unrelated domains in organ functions.
The dynamics leading to such a structure can be unraveled by the study of the NHCD as a growth process. The knowledge of the time of appearance of each cell type, Ta, makes it possible to follow the cumulative growth of the embryo and fetus in terms of the total number of cell types at time t, N(t) as well as the number of cell types that eventually survive in the organism (Fig. 4A). As expected, surviving cells emerge in the later stages of the gestation period. However, the difference between the total and the surviving number of cell types indicates that generation of new types of nonsurviving cells takes place even during the final gestation months.
Fig. 4.

Growth properties of the NHCD. (A) Number of cell types in the network, N(t), as a function of time. We find precise information about the appearance time, Ta, for 782 among the 873 cell types. Those cells with missing appearance time have not been taken into account in this plot. Also shown are the time evolution of the number of surviving and nonsurviving cells. (B) Number of nodes whose degree increases at time t (Red Histogram) and number of new links appearing in the network (Blue Histogram) as a function of time. If all nodes were giving just one child then the two histograms would coincide. Inset: The average number of new links per node at a given time can be found by dividing the two histograms in the main plot. This plot shows how intense is the activity at that particular time. Despite the variation in activity, the new connections average around one that gives a critical branching ratio of 〈k〉 ≃ 2. (C) Number of cell types versus the chemical distance to the first node, ℓN1. This distance is only determined by the connections between the cell types and is not influenced by the appearance time so that we include all 873 cell types. (D) Average degree 〈k〉 of the network as a function of time showing that the network achieves the condition of critical branching process 〈k〉 ≈ 2 at around t∗ = 40 days.
The increase of the network size, N(t), is initially approximately exponential and after t∗ = 40 days changes into a slower growth (Fig. 4A). Only a small percentage of the nodes grow within a given time interval so that the network activity is focused in a small number of them at a given time. The number of nodes that differentiate at a given time are shown in Fig. 4B. We observe an activity that increases monotonically up to around t∗ = 40 days and then drops to lower values. The crossover time t∗ = 40 days observed in Fig. 4A and B separates two regimes of growth and approximately corresponds to the time below which most of the cells have a plastic characteristic (i.e., the capability to differentiate) and above which they start to become functional (1). Interestingly, the two regimes observed in N(t) merge into a single universal functional curve when we replot N(ℓN1) as a function of the chemical distance to the fertilized egg, ℓN1 (Fig. 4C). This result suggests that the topological distance in the network ℓN1 is the natural variable to characterize the growth process in a universal form rather than the time. The dynamic of N(ℓ) follows a typical logistic (Verhulst) process of population growth where the rate of growth is restricted by environmental limitations:
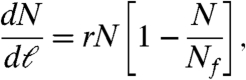 |
[4] |
with solution,
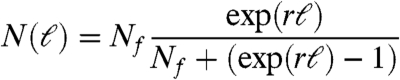 |
[5] |
(see the fitting in Fig. 4C), where Nf is the final number of cell types and r = 0.65 is the growth rate of cell types.
Analysis of the network connectivity reveals that the average number of links per node in the final stages of the entire NHCD is 〈k〉 = 2.24 (Fig. 4D). Even though 〈k〉 ≈ 2, there is a broad degree distribution [scale-free (11), P(k) ∼ k-γ, γ ≃ 3.0, and SI Appendix]. This implies that there is always a small number of crucial cell types that differentiate much more than the others, a fact that agrees with evidence on the existence of a few cells with large plasticity potential. As this potential is rapidly lost after 40 d, cell types change their development ability in favor of the organism life maintenance.
The fact that the average degree is close to two implies that the dynamical evolution of NHCD can be described by a critical branching process where every node has a certain probability of generating offsprings, in which case the critical condition for the branching to continue is 〈k〉 = 2 (30). This effectively means that each node needs to give at least one descendant for the network to keep growing. If 〈k〉 < 2, the growth would stop early, while for 〈k〉 > 2 the growth would be faster than exponential.
The network reaches the condition of criticality, 〈k〉 ≈ 2, at around t∗ = 40 days (Fig. 4D) in conjunction with the transition from plasticity to functional behavior. After this, the average degree remains just above criticality to sustain a growth rate that guarantees the network survival. The majority of the nodes propagate the growth in a single line, but there are nodes that generate significantly more descendants to generate the diversity implied by the power-law distributions of degree and modularity.
II. Discussion
In summary, we present a large-scale study of the prenatal evolution of the human cell differentiation process from the fertilized egg to a developed human. The process of human cell differentiation can be mapped onto a complex network composed of cell types and differentiation steps. This mapping allows us to study the cell differentiation process with state of the art network theory for community detection with the goal of identifying hitherto unknown functional relations between cell types.
We discover a dynamical law of critical branching explaining the emergence of the network topology that reveals a scale-invariant modular structure of the network of cell types. The self-similar modular features evidenced in Figs. 1, 2, and 3 are established early in the process and remain invariant during the evolution of the NHCD, although the network size changes significantly.
By using this law, we are able to observe the network at different scales. The emerging picture clearly identifies clusters of cell types, or modules, and their connectivity to other modules within its own and other functions. The resulting hierarchical organization consists of sub-modules, known biological functions, and super-modules of specialized tissues and organs emerging on varying scales. This discovery is useful in proposing future research ties between previously unrelated domains in organ functions in a systematic way. Furthermore, this information could be of importance in providing predictions of functional attributes to a number of identified modules of cell types in the NHCD.
III. Materials and Methods
The detection of modules or boxes in our work follows from the application of the box-covering algorithm (12, 28) at different length-scales. The algorithm can be downloaded at http://lev.ccny.cuny.edu/~hmakse/soft_data.html. In box covering we assign every node to a module, by finding the minimum possible number of boxes, NB(ℓ), that cover the network and whose diameter (defined as the maximum distance between any two nodes in this box) is smaller than ℓ. These boxes are characterized by the proximity between all their nodes, at a given length-scale. Different values of the box diameter ℓ yield boxes of different size. These boxes are identified as modules that at a smaller scale, ℓ, may be separated but merge into larger entities as we increase ℓ.
In this work we implement the Maximum Excluded Mass Burning (MEMB) algorithm from (28) for box covering. The algorithm uses the basic idea of box optimization, where we require that each box should cover the maximum possible number of nodes, and works as follows: For a given ℓ, we first locate the optimal “central” nodes that will act as the origins for the boxes. This is done by first calculating the number of nodes (called the mass) within a diameter ℓ from each node. The node that yields the largest mass is marked as a center. Then we mark all the nodes in the box of this center node as “tagged.” We repeat the process of calculating the mass of the boxes starting from all noncenter nodes, and we identify a second center according to the largest remaining mass, while nodes in the corresponding box are tagged, and so on. When all nodes are either centers or tagged we have identified the minimum number of centers that can cover the network at the given ℓ value. Starting from these centers as box origins, we then simultaneously burn the boxes from each origin until the entire network is covered, i.e., each node is assigned to one box [we call this process burning because it is similar to burning algorithms developed to investigate clustering statistics in percolation theory (11)]. In Fig. 2A we show how box covering works for a simple network at two different ℓ values.
This algorithm is driven by the proximity between nodes and the maximization of the mass associated with each module center (12, 28). Thus, it detects boxes that maximize modularity (Eq. 1). In the case of MEMB, we have the additional benefit of detecting modules at different scales so that we can study the hierarchical character of modularity, i.e., modules of modules, and we can detect whether modularity is a feature of the network that remains scale-invariant.
The fractal dimension dB of a complex network is an exponent that determines how the mass (equivalently: the number of nodes) around any given node scales with the length that in networks corresponds to the shortest distance between two nodes. To numerically measure this exponent we optimally cover the network with boxes using the MEMB algorithm. A box is a set of nodes where all distances ℓij between any two nodes i and j in this set are smaller than a given value of ℓ, the box size. Although there is a large number of coverings, for every value of ℓ we want to find the one that gives the smallest possible number of boxes, NB(ℓ). Varying ℓ then yields the scaling relation (Eq. 3). A finite fractal dimension reveals fundamental organizational principles of the underlying network, namely a self-similar structural character, where the network is built in a similar way even though we observe it at different length-scales. The boxes that are identified through this process correspond to the modules at varying scales.
Supplementary Material
Acknowledgments.
We thank J. Brujić, B. Dubin-Thaler, H.D. Rozenfeld, S. Havlin, T. Rattei, A.M. Andrade, J.M.M. Andrade, and M. Sigman for valuable discussions. This work was supported by National Science Foundation Grants SES-0624116 and EF-0827508. We thank the financial support of the Brazilian agencies Conselho Nacional de Desenvolvimento Científico e Tecnólogico, Coordenação de Aperfeiçoamento de Pessoal de Nível Superior, Fundação de Amparo à Pesquisa do Estado da Bahia, and Fundação Cearense de Apoio ao Desenvolvimento Cientifico e Tecnólogico, the National Institute of Science and Technology for Complex Systems, and the European Seventh Framework Programme Neuronano project (NMP4-SL-2008-214547) .
Footnotes
The authors declare no conflict of interest.
This article is a PNAS Direct Submission.
This article contains supporting information online at www.pnas.org/cgi/content/full/0914748107/DCSupplemental.
References
- 1.Sell S. Stem Cells Handbook. Totowa, NJ: Humana Press; 2004. [Google Scholar]
- 2.Kirschstein R, Skirboll LR. Stem Cells: Scientific Progress and Future Research Directions. Bethesda: NIH; 2001. [Google Scholar]
- 3.Freitas RA., Jr . Nanomedicine, Volume I: Basic Capabilities. Georgetown, Texas: Landes Bioscience; 1999. [Google Scholar]
- 4.Alberts B, et al. Molecular Biology of the Cell. IVth Ed. New York: Garland Science; 2002. [Google Scholar]
- 5.Sadler TW. Langman’s Medical Embryology. IXth Ed. Baltimore: Lippincott Williams and Wilkins; 2004. [Google Scholar]
- 6.Vickaryous MK, Hall BK. Human cell type diversity, evolution, development, and classification with special reference to cells derived from the neural crest. Biol Rev. 2006;81:425–455. doi: 10.1017/S1464793106007068. [DOI] [PubMed] [Google Scholar]
- 7.Valentine JW. In: Keywords and Concepts in Evolutionary Developmental Biology. Hall BK, Olson WM, editors. Cambridge: Harvard Univ Press; 2003. pp. 35–53. [Google Scholar]
- 8.Ravasz E, Somera AL, Mongru DA, Oltvai ZN, Barabási A-L. Hierarchical organization of modularity in metabolic networks. Science. 2002;297:1551–1555. doi: 10.1126/science.1073374. [DOI] [PubMed] [Google Scholar]
- 9.Newman MEJ, Girvan M. Finding and evaluating community structure in networks. Phys Rev E. 2004;69:026113. doi: 10.1103/PhysRevE.69.026113. [DOI] [PubMed] [Google Scholar]
- 10.Guimerà R, Amaral LAN. Functional cartography of complex metabolic networks. Nature. 2005;433:895–900. doi: 10.1038/nature03288. [DOI] [PMC free article] [PubMed] [Google Scholar]
- 11.Caldarelli G, Vespignani A, editors. Large scale structure and dynamics of complex networks. Singapore: World Scientific; 2007. [Google Scholar]
- 12.Song C, Havlin S, Makse HA. Self-similarity of complex networks. Nature. 2005;433:392–395. doi: 10.1038/nature03248. [DOI] [PubMed] [Google Scholar]
- 13.Paxinos G, Mai JK. The Human Nervous System. 2nd Ed. San Diego: Elsevier Academic; 2004. [Google Scholar]
- 14.Temple S. The development of neural stem cells. Nature. 2001;414:112–117. doi: 10.1038/35102174. [DOI] [PubMed] [Google Scholar]
- 15.Bianco P, Riminucci M, Gronthos S, Robey PG. Bone marrow stromal stem cells: Nature, biology, and potential applications. Stem Cells. 2001;19:180–192. doi: 10.1634/stemcells.19-3-180. [DOI] [PubMed] [Google Scholar]
- 16.Chen JCJ, Goldhamer DJ. Skeletal muscle stem cells. Reprod Biol Endocrin. 2003;1:101. doi: 10.1186/1477-7827-1-101. [DOI] [PMC free article] [PubMed] [Google Scholar]
- 17.Janeway CA, Travers P, Walport M, Shlomchik M. Immunobiology: The Immune System in Health and Disease. 5th Ed. New York: Garland Science; 2001. [Google Scholar]
- 18.Anglani F, et al. In search of adult renal stem cells. J Cell Mol Med. 2004;8:474–487. doi: 10.1111/j.1582-4934.2004.tb00472.x. [DOI] [PMC free article] [PubMed] [Google Scholar]
- 19.Horster MF, Braun GS, Huber SM. Embryonic renal epithelial: induction, nephrogenesis, and cell differentiation. Physiol Rev. 1999;79:1157–1191. doi: 10.1152/physrev.1999.79.4.1157. [DOI] [PubMed] [Google Scholar]
- 20.Herrick SE, Mutsaers SE. Mesothelial progenitor cells and their potential in tissue engineering. Int J Biochem Cell B. 2004;36:621–642. doi: 10.1016/j.biocel.2003.11.002. [DOI] [PubMed] [Google Scholar]
- 21.Otto WR. Lung epithelial stem cells. J Pathol. 2002;197:527–535. doi: 10.1002/path.1160. [DOI] [PubMed] [Google Scholar]
- 22.Jessen KR, Mirsky R. The origin and development of glial cells in peripheral nerves. Nat Rev Neurosci. 2005;6:671–682. doi: 10.1038/nrn1746. [DOI] [PubMed] [Google Scholar]
- 23.Nakashima M, Redid AH. The application of bone morphogenetic proteins to dental tissue engineering. Nat Biotechnol. 2003;21:1025–1032. doi: 10.1038/nbt864. [DOI] [PubMed] [Google Scholar]
- 24.Santagati F, Rijli FM. Cranial neural crest and the building of the vertebrate head. Nat Rev Neurosci. 2003;4:806–818. doi: 10.1038/nrn1221. [DOI] [PubMed] [Google Scholar]
- 25.Savage JJ, Yaden BC, Kiratipranon P, Rhodes SJ. Transcriptional control during mammalian anterior pituitary development. Gene. 2003;319:1–19. doi: 10.1016/s0378-1119(03)00804-7. [DOI] [PubMed] [Google Scholar]
- 26.Forge A, Wright T. The molecular architecture of the inner ear. Brit Med Bull. 2002;63:5–24. doi: 10.1093/bmb/63.1.5. [DOI] [PubMed] [Google Scholar]
- 27.Panteleyev A, Jahoda CAB, Christiano AM. Hair follicle predetermination. J Cell Sci. 2001;114:3419–3431. doi: 10.1242/jcs.114.19.3419. [DOI] [PubMed] [Google Scholar]
- 28.Song C, Gallos LK, Havlin S, Makse HA. How to calculate the fractal dimension in complex networks. J Stat Mech. 2007:P03006. [Google Scholar]
- 29.Gallos LK, Song C, Havlin S, Makse HA. Scaling Theory of transport in complex biological networks. Proc Natl Acad Sci USA. 2007;104:7746–7751. doi: 10.1073/pnas.0700250104. [DOI] [PMC free article] [PubMed] [Google Scholar]
- 30.Athreya KB, Ney PE. Branching processes. New York: Dover; 2004. [Google Scholar]
Associated Data
This section collects any data citations, data availability statements, or supplementary materials included in this article.