Abstract
The use of nanoscale x-ray probes overcomes several key limitations in the study of materials up to multimegabar (> 200) pressures, namely, the spatial resolution of measurements of multiple samples, stress gradients, and crystal domains in micron to submicron size samples in diamond-anvil cells. Mixtures of Fe, Pt, and W were studied up to 282 GPa with 250–600 nm size synchrotron x-ray absorption and diffraction probes. The probes readily resolve signals from individual materials, between sample and gasket, and peak pressures, in contrast to the 5-μm-sized x-ray beams that are now becoming routine. The use of nanoscale x-ray beams also enables single-crystal x-ray diffraction studies in nominally polycrystalline samples at ultrahigh pressures, as demonstrated in measurements of (Mg,Fe)SiO3 postperovskite. These capabilities have potential for driving a push toward higher maximum pressures and further miniaturization of high-pressure devices, in the process advancing studies at extreme conditions.
Keywords: extreme conditions, imaging, x-ray
Advances in high-pressure technology have opened numerous scientific frontiers through the study of materials over an expanding range of conditions. Pressure can drastically change the properties of ordinary materials to reveal surprising physical phenomena (1–3), unique phases and chemical interactions (4–5), and knowledge of Earth and planetary interiors (6–8). Scientific progress in this area is dictated by advances in high-pressure-temperature apparatus for reaching extreme conditions and analytical probes for conducting in situ investigations. Breaking the megabar barrier (9) and beyond (10) with diamond-anvil cells (DACs) has enabled static high-pressure measurements covering a broad range of compression depending on the materials studies, including over an order of magnitude increase in density.
Pressure is an intensive parameter, and the quality of measurements under compression is governed by the size of the analytical probe relative to the size of the samples rather than the absolute sample size. Consequently, major advances in high-pressure science and technology have often been marked by the miniaturization of associated analytical techniques, e.g., electrical (11–12), magnetic (13), optical (14), and x-ray probes (15) down to the micron scale. Further miniaturization to nanoscale probes has been very challenging. The standard submicron probes using focused electrons (e.g., electron microscopy) or ions (e.g., nano secondary ionization mass spectrometry) or surface contact (e.g., atomic force microscopy) typically require a low-pressure, if not a near-vacuum, environment, which is incompatible with high-pressure experimental environments. Optical probes can access the high-pressure sample through the diamond windows (14) but are generally restricted in spatial resolution by the micron-scale diffraction limit of optical wavelengths.
High-energy x-rays (> 6 keV) have the penetrating power to reach samples through diamond anvils or beryllium gaskets (16) for in situ high-pressure measurement studies (7). The development of a plethora of high-pressure x-ray techniques utilizing synchrotron radiation has been an essential driving force in recent development in high-pressure sciences. These techniques include x-ray diffraction, emission and absorption spectroscopy, radiography, and inelastic scattering techniques applied at megabar to multimegabar pressures (17–27). However, existing synchrotron probes are limited to spatial resolution of 2–5 μm, corresponding to the size of the focused x-ray beams, which has become a key limitation to resolve stress gradients, compositional heterogeneity, and texture at megabar pressures, where significant differences occur on a submicron level. For example, x-ray diffraction and radiographic measurements of the strains of diamond, iron, and tungsten were carried out to multimegabar pressures (> 300 GPa) with 5-μm x-ray beams, which was state of the art at that time (17). Large strains of the tip of the beveled 300-μm diamond were mapped, and steep pressure gradients were determined to the maximum pressures. However, the potentially large pressure gradients within the 10-μm central flat area could not be accurately determined with the 5-μm x-ray beam because the strain distributions could not be measured on a finer scale. This problem can be solved with a nano/submicron beam to improve the spatial resolution of pressure gradient measurements. Further miniaturization of high-pressure devices to generate even higher (i.e., terapascal) pressures also demands nano/submicron probes.
For high-energy x-rays, with their very short wavelength (< 0.2 nm), the theoretical diffraction limit is no longer an issue for the spatial resolution needed for these applications. The focus size is restricted by the practical limits of the x-ray optics, such as the slope error and surface finish of the focusing mirror. The nanoscale focusing capabilities of x-rays have recently made major progress at synchrotron beamlines specializing in nanotechnology; the two most promising focusing techniques are Kirkpatrick–Baez (K-B) mirrors and Fresnel zone plates. The zone plate system has the advantages of large working distance and small focus at low x-ray energy, whereas the K-B mirror system has the advantage of high efficiency and energy-independent focusing capability; i.e., it can be used to focus a wide range of monochromatic and polychromatic energies while maintaining the stability of focusing spot position. Zone plates were fabricated to achieve 15-nm FWHM focusing resolution for 1.8-keV soft x-rays (28) and 30-nm resolution for 8-keV x-rays (29). A precisely configured K-B mirror was used to focus a 15-keV x-ray beam down to 25 nm (FWHM) at the kilometer-length beamline (BL29XUL) of SPring-8, Japan (30). These small 15- to 30-nm beams are achieved at a great sacrifice to the maximum x-ray energy, beam flux, and working distance and may still be impractical for routine high-pressure experiments. In contrast, 200- to 600-nm x-ray beams, an order of magnitude smaller than the micron x-ray beams available at leading high-pressure beamlines at the European Synchrotron Radiation Facility, SPring-8, and the Advanced Photon Source (APS) are now in use at specialized nanofocusing beamlines, but they have yet to be applied to studies of materials under extreme conditions.
Here we demonstrate the use of x-ray focusing and nanoscale beam technology with a series of multimegabar high-pressure experiments. We show that focused x-ray beams of 250- to 600-nm limitations in the current technology provide the ability to spatially resolve materials in composite or heterogeneous samples, sample and gasket, strain gradients from which pressure can be determined, and the individual submicron-sized single crystals that comprise polycrystalline samples. The results demonstrated the importance of x-ray nanobeams for studies of materials at multimegabar pressures and the need for development of still smaller probes for extreme conditions science.
Results and Discussion
High-pressure experiments were carried out with the K-B mirror nanofocusing system at beamline 34ID-E, the zone plate nanofocusing system at 2ID-D, and the microfocusing system at 16ID-B of the APS, Argonne National Laboratory. The monochromatic x-ray beam of 15.001 keV was focused to 250 nm (FWHM) at 2ID-D with a zone plate, both polychromatic and monochromatic x-ray beams were focused to 600 nm at 34ID-E with K-B mirrors, and the x-ray beam of 33.686 keV was focused to 5 μm at 16ID-B for comparison. Symmetric DACs were used to generate pressure (31). X-ray diffraction and absorption data were collected along the loading axis of the DACs (see Methods).
Spatially Resolving Heterogeneous Samples, Multiple Materials, and Sample from Gasket.
Accurate high-pressure measurements rely upon the ability of the analytical probe to resolve signals for the microscopic samples and the background signals originating from the surrounding materials. High-pressure x-ray diffraction (XRD) facilities at the APS (32–33), European Synchrotron Radiation Facility (34), and SPring-8 (35) have established 2- to 10-μm (FWHM) focused x-ray probes for this purpose. With the tail of the focused beam typically 3× the FWHM and approaching the sample size in ultrahigh-pressure experiments, it would be difficult to avoid having signals from the gasket contaminate the measurements. For example, XRD was used for the recent discovery of the hP4 phase of Na (36); however, the XRD pattern at 190 GPa was dominated by the Re gasket, making the hP4 assignment less robust. The problem is particularly challenging in high-pressure XRD of low-Z elements, where scattering from the sample is much weaker than the background (37).
Multiple samples have been studied in the same pressure chamber for direct comparison of their compressibility under the same pressure conditions (38–39), and natural rock specimens have been studied to simulate high-pressure geological environments (40). Despite these advances, the above measurements have been limited by the overlap of diffraction peaks that obscures characterization of the different phases involved. These problems can be overcome with an x-ray beam that is an order of magnitude smaller, which could then distinguish between multiple samples and phases.
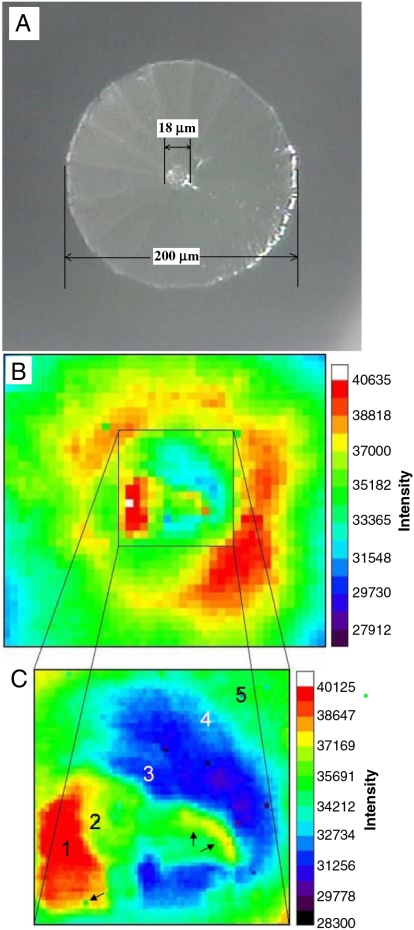
We studied a mixture of three different materials, Pt, W, and Fe, in the same pressure chamber up to 282 GPa. We mapped out features of the three different components of the sample on the 18-μm diameter culet by step-scanning the 250-nm (FWHM) focused x-ray beam and measuring x-ray absorption and diffraction at each step. Fig. 1A is the photomicrograph of the beveled diamond culet with the gasket and sample. Fig. 1B and C are two-dimensional (2D) x-ray absorption maps. Fig. 1B is an enlarged 40 × 40 μm2 map from the area in the white-outlined square of Fig. 1A. The step size for scanning is 1 μm. The circular shape of the diamond-anvil tip can clearly be seen. Fig. 1C shows a 15 × 15 μm2 map of the black-outlined square in Fig. 1B. The scanning step size is 250 nm. Compared with Fig. 1B, the map in Fig. 1C shows much better detail because of its smaller step size. As indicated by the arrows, submicron features have been resolved with the 250-nm x-ray beam scan.
Fig. 1.
(A) Photomicrograph of the beveled diamond culet with the gasket and samples; (B) 2D transmission intensity map with a 1 μm/step of the 40 × 40 μm2 white-outlined square in A. (C) 250 nm/step map of the black-outlined square in B. The color scale indicates the transmitted x-ray intensity.
The intensity of the transmitted x-ray decreases with increasing sample (or gasket) thickness and sample absorption coefficients. Because of the cupping of the culet (17), the gasket is thinner at the edge of the cup and thicker closer to the center of the cup. The circular, 18-μm diameter, ring-like feature in Fig. 1B corresponds to the thin, pinched-out rim of the culet. Because of their higher absorption coefficients, Pt and W are stronger absorbers than Fe; the area with higher x-ray transmission intensity in the map is Fe, whereas the areas with lower x-ray transmission intensity are W or Pt.
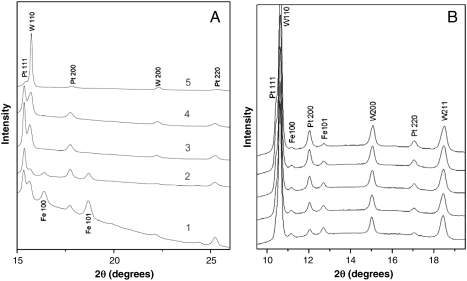
XRD patterns were also collected from areas corresponding to the 2D x-ray absorption map (Fig. 2A). From the diffraction patterns, it can be seen that, even though the gasket material (W) spreads all over the sample chamber and spatially overlaps with W and Fe samples, Fe and Pt are still easily distinguishable in the diffraction patterns. The diffraction results show submicron resolution and are consistent with the x-ray 2D transmission intensity maps shown in Fig. 1B and C. The benefits of using a submicron-focused x-ray beam to resolve between multiple samples and the gasket are clearly revealed by comparing with diffraction patterns collected on the same samples by using an x-ray beam size of 5 μm (Fig. 2B). In contrast to results measured with a submicron x-ray beam, Fe, Pt, and W appear in all diffraction patterns and cannot be resolved spatially.
Fig. 2.
XRD patterns collected at the locations marked by the numbers in Fig. 1C (A) with a 600-nm focused x-ray beam of 23.000 keV at 34ID-E and (B) by using a 5-μm focused x-ray beam of 33.686 keV at 16ID-B. Whereas the results from the 5-μm beam are indistinguishable, with the 600 nm beam it is clear that area 1 is Fe, area 2 contains both Fe and Pt, areas 3 and 4 are mainly Pt, and area 5 is W with no Fe.
Strain Variations, Stress Gradients, and Pressure Distributions.
Current static multimegabar experiments are made possible by beveling the diamond anvils in order to sharpen the pressure gradient in the solid gasket that supports the peak pressure at the center of the culet (10, 41). Designing and achieving a very steep pressure gradient in the gasket and then placing the solid or fluid samples at the position where the pressure is maximum and the gradient is zero is critical for reaching ultrahigh pressures (42). Advances in ultrahigh-pressure technology thus critically depend upon our ability to resolve the pressure distribution and to determine the peak pressure. The use of a nanofocused x-ray beam enables us to resolve pressure gradients that are an order of magnitude steeper and to detect peak pressures at submicron length scales.
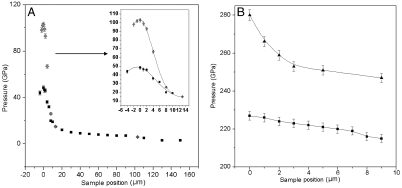
We compared pressure gradients in a DAC measured by XRD of W with a 5-μm x-ray probe at 16ID-B and a 600-nm x-ray probe at 34ID-E. The pressure determination was based on the pressure-volume equation of state of W (38, 43). Peak pressures of 105 (Fig. 3A) and 282 GPa (Fig. 3B) were reached. The random uncertainty in the pressure values arises mainly from the resolution of the detector system and errors in the sample to detector distance. The anisotropy of the stress, including uncertainty in the maximum pressure, for these measurements is similar to that described in ref. 17. The load and average pressure might have changed during the time span because the available beam time between 16ID-B and 34ID-E measurements was a month apart. The comparison is mainly to demonstrate the difference in ability to resolve the pressure gradient and peak pressure. Fig. 3B shows that the peak pressure in a 2-μm (FWHM) region can be resolved by the 600-nm x-ray probe but is missed by the 5-μm beam. The sharp peak was smeared out in the 2D average of the larger beam. The 15 GPa/μm peak pressure gradient observed with the submicron x-ray beam is also averaged out with the larger beam.
Fig. 3.
The pressure distribution as a function of sample position (radial distance from the center of anvil) determined with a 5-μm (black squares) and a 600-nm (red diamonds or triangles) focused x-ray beam (A) at peak pressure of 105 GPa and (B) at peak pressure of 282 GPa. The uncertainty of the measured pressure is indicated by the error bar.
The measurement of pressure in current static multimegabar experiments at the maximum loading technology is limited by the ability to probe pressure distributions with 2- to 5-μm x-ray beams. The present experiment indicates that a submicron x-ray beam can be used to understand fundamentally the constraints imposed by current diamond-anvil size, design, and maximum achievable pressure. It will help to advance the anvil design by sharpening the pressure gradient and creating a higher-pressure peak in a smaller area that is compatible with the finer probe size. The size of the diamond anvil and the entire DAC can also be greatly reduced (by a factor of ten) with the availability of still smaller probes.
Resolving Individual Single Crystals in a Polycrystalline Aggregate.
Structural information on an atomic level is essential for understanding the properties of materials at high pressure. XRD has long been the bread-and-butter probe for studying structure in situ at high pressure. Ideally, XRD from single crystals provides unique and critical sources of structural information that are crucial for understanding the microscopic mechanisms of high-pressure phenomena and characterizing unique pressure-induced phase transitions. However, single crystals break up into powders after reconstructive transitions. Without single crystals, we are forced to use various polycrystalline XRD methods that do not give as definitive a result. These polycrystalline methods often assume a “good” powder sample—i.e., statistically nearly infinite number of randomly distributed crystallites—which yield a smooth and uniform XRD pattern. In reality, most new phases formed under megabar pressures are neither a good powder nor a single crystal, their XRD patterns are often spotty with a 5-μm x-ray probe, and the intensity data are often insufficient for reliable Rietveld refinement.
From the standpoint of these measurements, whether a sample is single-crystal or polycrystalline (powder) depends upon the number of crystallites impinged by the probe beam at one time. The material is considered single-crystalline if the beam is smaller than the crystallites and polycrystalline if the beam covers a large number of crystals; a spotty polycrystalline pattern is measured if the beam probes an intermediate number of crystallites. Significant effort has been made to grow single crystals larger than the 5-μm beam by annealing samples, but the successful cases are rare (44–46). Here we took the different approach by reducing the x-ray probe size to 250 nm. The results show that the use of a submicron-focused x-ray beam enables us to carry out single-crystal studies even in the polycrystalline sample with grain sizes in the micron or submicron range.
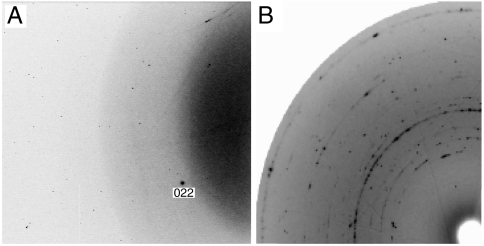
Fig. 4A shows the XRD pattern of a (Mg0.6Fe0.4)SiO3 postperovskite sample at 142 GPa using a 250 nm monochromatic x-ray (λ = 0.8266 Å) beam at 2ID-D of the APS (47–48). For comparison, the XRD pattern measured with a ∼5-μm monochromatic x-ray (λ = 0.3344 Å) beam from the same sample is shown in Fig. 4B. The spotty diffraction rings collected with the 5-μm x-ray beam indicate that the sample is polycrystalline. In comparison, the diffraction pattern measured with a 250-nm x-ray beam shows only a few reflections instead of spotty powder diffraction rings, which indicates that the grain size is similar in scale to the beam size. Hence the use of a submicron-focused x-ray beam enables single-crystal measurements of conventional polycrystalline samples with scanning monochromatic x-ray energy or sample rotation techniques.
Fig. 4.
The x-ray diffraction patterns for the same (Mg0.6Fe0.4)SiO3 postperovskite sample measured at 142 GPa with 250-nm (A) and 5-μm (B) monochromatic x-ray beams and at sectors 2 (λ = 0.8266 Å) and 13 (λ = 0.3344 Å) of the APS, respectively.
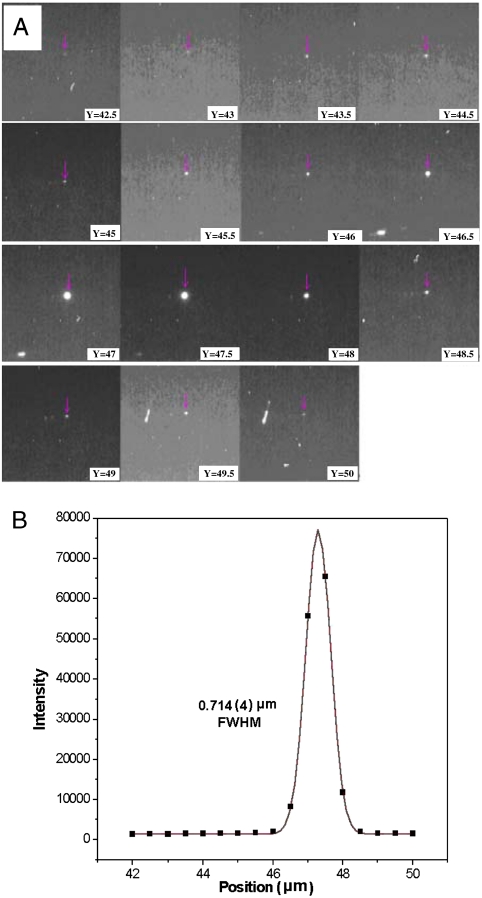
We also developed a method to measure the grain size of a polycrystalline sample at multimegabar pressures by probing a single-crystal diffraction spot from each grain with a submicron-focused x-ray beam. Fig. 5A shows a series of diffraction patterns taken from different locations of the sample during a 1D scan with a constant step size of 0.5 μm. By monitoring one peak in each image, we are able to track the dimension of the crystal associated with the particular x-ray reflection. Fig. 5B is a plot of peak intensity of interest against the scanning positions. The FWHM is measured as 0.714(4) μm; deconvoluting the data suggests that the grain size is close to the width of the x-ray beam.
Fig. 5.
XRD patterns collected in different locations (A) and the intensity distribution (B) of the spots marked with pink arrows as a function of sample position measured with the 250-nm x-ray beam.
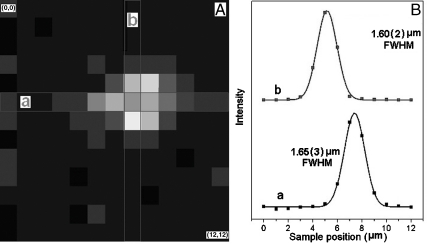
Fig. 6A shows a 2D diffraction intensity contrast map scanned from a single crystal in a powdered postperovskite sample at high pressure. The scanning area is 13 × 13 μm2 with a step size of 1 μm. The grain size can be easily determined from the image by fitting the intensity versus position. The intensity distribution along the a and b directions of Fig. 6A are shown in Fig. 6B, and the grain is determined to be 1.60 × 1.65 μm2 in dimensions. The result also suggests that we can easily track a particular grain in the sample.
Fig. 6.
Two-dimensional map of a single-crystal diffraction spot from the same grain of the postperovskite sample obtained under high pressure (A), and the intensity distribution (B) along strips a and b of A. It shows that the grain size is about 1.60 μm.
Conclusions
We demonstrate the utility of focused submicron x-ray beam studies of materials at multimegabar pressures. The x-ray absorption mapping with these beams show that one can clearly resolve different materials in composite samples. This technique allows the study of multiple samples in a single experiment, which both increases efficiency and permits direct comparisons of the behavior of different materials under similar thermomechanical conditions. The techniques have the potential for reaching still higher pressures with very small diamond culets. These small beams can be used to separate signals of the sample from those of the surrounding materials, which is critical for experiments designed to reach more extreme pressures (i.e., with culets < 20 μm and sample chambers < 5 μm). The use of a submicron-focused x-ray beam allows us to carry out single-crystal studies even in polycrystalline samples with submicron-scale grain size. We further demonstrate the ability to track submicron-scale single crystals in a 1,000 × 1,000 μm2 area during a single experiment. Finally, the use of a submicron-focused beam provides important knowledge of the stress state of samples at static multimegabar pressures by providing accurate measurements of strain distributions at these length scales. Such information is crucial for accurate calibration of pressure under extreme conditions
Methods
Symmetrical DACs with different diamond anvils were used to generate pressures (31). For the studies of spatially resolved multiple samples, as well as the pressure gradient measurement, we used diamond anvils with a 200-μm diameter outer culet, a 17° bevel, and an inner culet of 18 μm. The Fe and Pt samples were loaded into a ∼10-μm diameter sample chamber that was drilled into a preindented W gasket without any pressure medium (Fig. 1A).
X-ray absorption mapping and diffraction measurements were performed at 34ID-E and 2ID-D at the APS. The experimental setups are shown schematically in Fig. S1. 2ID-D uses the undulator radiation source, which can maximize the incident flux for a specific energy. A double-crystal Si(111) monochromator selects the incident beam energy (15 keV for the current study) and a zone plate focuses the incident beam down to 250 nm. At 34ID-E, the x-ray beam is interchangeable between a white and monochromatic sources with an insertable/removable monochromator. The energy of the monochromatic beam we used during the experiments at 34ID-E was tunable from 10 to 23 keV. The beam was focused to 600 nm with a pair of K-B mirrors that were designed to keep the identical focus spot during the tuning of monochromatic energy and switching between monochromatic and white sources. The beam sizes were measured by knife-edge scans for both stations (Fig. S2). All of the diffraction patterns were collected with either an image plate (MAR345) or a Princeton CCD and processed with FIT2D. The x-ray transmission maps were measured with an ion chamber.
Supplementary Material
Acknowledgments.
HPSynC is supported as part of EFree, an Energy Frontier Research Center funded by the U.S. Department of Energy, Office of Science, Office of Basic Energy Sciences under Award DE-SC0001057. Use of the HPCAT facility was supported by the Department of Energy, Office of Basic Energy Sciences, the Department of Energy, National Nuclear Security Administration (Carnegie/Department of Energy Alliance Center), and the National Science Foundation. The Advanced Photon Source is supported by the U.S. Department of Energy, Office of Science, Office of Basic Energy Sciences, under Contract DE-AC02-06CH11357. Research of L.W. was supported by National Science Foundation Grants MRI-0821584 and EAR-0810255 and the International Balzan Foundation. W.L.M. is supported through the National Science Foundation Geophysics Grant EAR-0738873.
Footnotes
The authors declare no conflict of interest.
This article contains supporting information online at www.pnas.org/cgi/content/full/1001141107/DCSupplemental.
References
- 1.Ashcroft NW. Diamond, diamond cells, and the structure of element. Proc Natl Acad Sci USA. 2008;105:5–6. doi: 10.1073/pnas.0710426105. [DOI] [PMC free article] [PubMed] [Google Scholar]
- 2.Ashcroft NW. Condensed-matter physics: Pressure for change in metals. Nature. 2009;458:158–159. doi: 10.1038/458158a. [DOI] [PubMed] [Google Scholar]
- 3.Hemley RJ, Crabtree GW, Buchanan MV. Energy challenges for materials in extreme environments. Phys Today. 2009;62:32–37. [Google Scholar]
- 4.McMillan PF. Chemistry at high pressure. Chem Soc Rev. 2006;35:855–857. doi: 10.1039/b610410j. [DOI] [PubMed] [Google Scholar]
- 5.Hemley RJ. Effects of high pressure on molecules. Ann Rev Phys Chem. 2000;51:763–800. doi: 10.1146/annurev.physchem.51.1.763. [DOI] [PubMed] [Google Scholar]
- 6.Mao HK, Hemley RJ. The high-pressure dimension in earth and planetary science. Proc Natl Acad Sci USA. 2007;104:9114–9115. doi: 10.1073/pnas.0703653104. [DOI] [PMC free article] [PubMed] [Google Scholar]
- 7.Duffy TS. Mineralogy at the extremes. Nature. 2008;451:269–270. doi: 10.1038/nature06584. [DOI] [PubMed] [Google Scholar]
- 8.Grochala W, Feng J, Hoffman R, Ashcroft NW. The chemical imagination at work in very tight places. Ang Chem. 2007;46:3620–3642. doi: 10.1002/anie.200602485. [DOI] [PubMed] [Google Scholar]
- 9.Mao HK, Bell PM. High-pressure physics: The 1-megabar mark on the ruby R1 static pressure scale. Science. 1976;191:851–852. doi: 10.1126/science.191.4229.851. [DOI] [PubMed] [Google Scholar]
- 10.Bell PM, Mao HK, Goettel K. Ultrahigh pressure: Beyond 2 megabars and the ruby fluorescence scale. Science. 1984;226:542–544. doi: 10.1126/science.226.4674.542. [DOI] [PubMed] [Google Scholar]
- 11.Eremets MI, et al. Electrical conductivity of Xe at megabar pressures. Phys Rev Lett. 2000;85:2797–2800. doi: 10.1103/PhysRevLett.85.2797. [DOI] [PubMed] [Google Scholar]
- 12.Velisavljevic N, MacMinn KM, Vohra YK, Weir ST. Electrical measurements on praseodymium metal to 179 GPa using designer diamond anvils. Appl Phys Lett. 2004;84:927–929. [Google Scholar]
- 13.Struzhkin VV, Timofeev YA, Hemley RJ, Mao HK. Superconducting Tc and electron-phonon coupling in Nb to 132 GPa: Magnetic susceptibility at megabar pressures. Phys Rev Lett. 1997;79:4262–4265. [Google Scholar]
- 14.Hemley RJ, Bell PM, Mao HK. Laser techniques in high-pressure geophysics. Science. 1987;237:605–612. doi: 10.1126/science.237.4815.605. [DOI] [PubMed] [Google Scholar]
- 15.Mao HK, et al. X-ray diffraction to 302 gigapascals: High-pressure crystal structure of cesium iodide. Science. 1989;246:649–651. doi: 10.1126/science.246.4930.649. [DOI] [PubMed] [Google Scholar]
- 16.Singh AK, Mao HK, Shu J, Hemley RJ. Estimation of single-crystal elastic moduli from polycrystalline x-ray diffraction at high pressure: Applications to FeO and iron. Phys Rev Lett. 1998;80:2157–2160. [Google Scholar]
- 17.Hemley RJ, et al. X-ray imaging of stress and strain of diamond, iron, and tungsten at megabar pressures. Science. 1997;276:1242–1245. [Google Scholar]
- 18.Badro J, et al. Magnetism in FeO at megabar pressures from x-ray emission spectroscopy. Phys Rev Lett. 1999;83:4101–4104. [Google Scholar]
- 19.Ding Y, et al. Novel pressure-induced magnetic transition in magnetitie (Fe3O4) Phys Rev Lett. 2008;100:045508. doi: 10.1103/PhysRevLett.100.045508. [DOI] [PubMed] [Google Scholar]
- 20.Fiquet G, Badro J, Guyot F, Requardt H, Krisch M. Sound velocities in iron to 110 gigapascals. Science. 2001;291:468–471. doi: 10.1126/science.291.5503.468. [DOI] [PubMed] [Google Scholar]
- 21.Itié JP, et al. Pressure-induced coordination changes in crystalline and vitreous GeO2. Phys Rev Lett. 1989;63:398–401. doi: 10.1103/PhysRevLett.63.398. [DOI] [PubMed] [Google Scholar]
- 22.Liu H, et al. Anomalous pressure-induced behavior of amorphous selenium from synchrotron x-ray diffraction and microtomography. Proc Natl Acad Sci USA. 2008;105:13229–13234. doi: 10.1073/pnas.0806857105. [DOI] [PMC free article] [PubMed] [Google Scholar]
- 23.Mao HK, et al. Phonon density of states of iron up to 153 GPa. Science. 2001;292:914–916. doi: 10.1126/science.1057670. [DOI] [PubMed] [Google Scholar]
- 24.Mao WL, et al. Bonding changes in compressed superhard graphite. Science. 2003;302:425–427. doi: 10.1126/science.1089713. [DOI] [PubMed] [Google Scholar]
- 25.Pascarelli S, et al. Effect of pressure on magnetoelastic coupling in 3d metal alloys studied with x-ray absorption spectroscopy. Phys Rev Lett. 2007;99:237204. doi: 10.1103/PhysRevLett.99.237204. [DOI] [PubMed] [Google Scholar]
- 26.Rueff JP, et al. Pressure induced high-spin to low-spin transition in FeS evidenced by x-ray emission spectroscopy. Phys Rev Lett. 1999;82:3284–3287. [Google Scholar]
- 27.Wenk H-R, Matthies S, Hemley RJ, Mao HK, Shu J. The plastic deformation of iron at pressures of the Earth’s inner core. Nature. 2000;405(6790):1044–1047. doi: 10.1038/35016558. [DOI] [PubMed] [Google Scholar]
- 28.Chao W, Harteneck BD, Liddle JA, Anderson EH, Attwood DT. X-ray microscopy at a spatial resolution better than 15 nm. Nature. 2005;435:1210–1213. doi: 10.1038/nature03719. [DOI] [PubMed] [Google Scholar]
- 29.Yin GC, et al. 30 nm resolution x-ray imaging at 8 keV using third order diffraction of a zone plate lens objective in a transmission microscope. Appl Phys Lett. 2006;89:221122. [Google Scholar]
- 30.Mimura H, et al. Efficient focusing of hard x-rays to 25 nm by a total reflection mirror. Appl Phys Lett. 2007;90:051903. [Google Scholar]
- 31.Mao HK, Hemley RJ. Experimental studies of Earth deep interior: Accuracy and versatility of diamond cells. Philos Trans R Soc Lond A. 1996;354:1315–1333. [Google Scholar]
- 32.Prakapenka V, et al. Advanced flat top laser heating system for high pressure research at GSECARS: Application to the melting behavior of germanium. High Pressure Res. 2008;28:225–235. [Google Scholar]
- 33.Shen G, Prakapenka V, Eng PJ, Rivers ML, Sutton SR. Facilities for high-pressure research with the diamond anvil cell at GSECARS. J Synchrotron Radiat. 2005;12:642–649. doi: 10.1107/S0909049505022442. [DOI] [PubMed] [Google Scholar]
- 34.Mezouar M, et al. Development of a new state-of-the-art beamline optimized for monochromatic single-crystal and powder x-ray diffraction under extreme conditions at the ESRF. J Synchrotron Radiat. 2005;12:659–664. doi: 10.1107/S0909049505023216. [DOI] [PubMed] [Google Scholar]
- 35.Ohishi Y, Hirao N, Sata N, Hirose K, Takata M. Highly intense monochromatic x-ray diffraction facility for high-pressure research at SPring-8. High Pressure Res. 2008;28:163–173. [Google Scholar]
- 36.Ma Y, et al. Transparent dense sodium. Nature. 2009;458:182–185. doi: 10.1038/nature07786. [DOI] [PubMed] [Google Scholar]
- 37.Goncharenko IN, Loubeyre P. Neutron and x-ray diffraction study of the broken symmetry phase transition in solid deuterium. Nature. 2005;435:1206–1209. doi: 10.1038/nature03699. [DOI] [PubMed] [Google Scholar]
- 38.Dewaele A, Loubeyre P, Mezouar M. Equations of state of six metals above 94 GPa. Phys Rev B. 2004;70:094112. [Google Scholar]
- 39.Mao HK, Bell PM, Shaner JW, Steinberg DJ. Specific volume measurements of Cu, Mo, Pd, and Ag and calibration of the ruby R1 fluorescence pressure gauge from 006 to 1 Mbar. J Appl Phys. 1978;49:3276–3283. [Google Scholar]
- 40.Lee KKM, O’Neill B, Jeanloz R. Limits to resolution in composition and density in ultra high-pressure experiments on natural mantle-rock samples. Phys Earth Planet In. 2004;143–144:241–253. [Google Scholar]
- 41.Mao HK, Bell PM. High-pressure physics: Sustained static generation to 136 to 172 megabars. Science. 1978;200:1145–1147. doi: 10.1126/science.200.4346.1145. [DOI] [PubMed] [Google Scholar]
- 42.Mao HK, Bell PM, Hemley RJ. Ultrahigh pressures: Optical observations and Raman measurements of hydrogen and deuterium to 147 Mbar. Phys Rev Lett. 1985;55:99–102. doi: 10.1103/PhysRevLett.55.99. [DOI] [PubMed] [Google Scholar]
- 43.Koči L, Ma Y, Oganov AR, Souvatzis P, Ahuja R. Elasticity of the superconducting metals V, Nb, Ta,Mo W at high pressure. Phys Rev B. 2008;77:214101. [Google Scholar]
- 44.Gregoryanz E, et al. Structural diversity of sodium. Science. 2008;320:1054–1057. doi: 10.1126/science.1155715. [DOI] [PubMed] [Google Scholar]
- 45.Lundegaard LF, Weck G, McMahon MI, Desgreniers S, Loubeyre P. Observation of an 08 molecular lattice in the ε phase of solid oxygen. Nature. 2006;443:201–204. doi: 10.1038/nature05174. [DOI] [PubMed] [Google Scholar]
- 46.Weck G, Desgreniers S, Loubeyre P, Mezouar M. Single-crystal structural characterization of the metallic phase of oxygen. Phys Rev Lett. 2009;102:255503. doi: 10.1103/PhysRevLett.102.255503. [DOI] [PubMed] [Google Scholar]
- 47.Mao WL, et al. Iron-rich post-perovskite and the origin of ultralow-velocity zones. Science. 2006;312:564–565. doi: 10.1126/science.1123442. [DOI] [PubMed] [Google Scholar]
- 48.Murakami M, Hirose K, Kawamura K, Sata N, Ohishi Y. Post-perovskite phase transition in MgSiO3. Science. 2004;304:855–858. doi: 10.1126/science.1095932. [DOI] [PubMed] [Google Scholar]
Associated Data
This section collects any data citations, data availability statements, or supplementary materials included in this article.


