Abstract
We present a novel technique to predict the outcome of an RF ablation, including the vascular cooling effect. The main idea is to separate the problem into a patient independent part, which has to be performed only once for every applicator model and generator setting, and a patient dependent part, which can be performed very fast. The patient independent part fills a look-up table of the cooling effects of blood vessels, depending on the vessel radius and the distance of the RF applicator from the vessel, using a numerical simulation of the ablation process. The patient dependent part, on the other hand, only consists of a number of table look-up processes. The paper presents this main idea, along with the required steps for its implementation. First results of the computation and the related ex-vivo evaluation are presented and discussed. The paper concludes with future extensions and improvements of the approach.
Keywords: Radiofrequency ablation, vascular cooling, fast prediction.
1. INTRODUCTION
Cancer is currently a leading cause of death [1]. Over 50 % of all patients suffering from colon cancer develop hepatic metastases [2]. Since surgical resection is often not applicable due to size, number, and location of the tumors, or due to the general constitution of the patient, minimally invasive therapies, such as radiofrequency (RF) ablation, have become very popular in the last years for both primary hepatic tumors and hepatic metastases [3].
In RF ablation, a needle shaped probe is inserted into the tumor. The probe is then connected to an electric generator, which induces an electric current into the tissue. By Joule’s law, heat is produced, and above a certain critical temperature cell proteins denaturate, causing cell death.
Intervention planning is hampered by the fact that blood vessels in the vicinity of the RF probe can lead to a cooling effect and thus decrease the coagulation size [4]. Next to the area where the tissue is completely destroyed, there is a transition zone in which the tissue is still heated up, but the heat is not sufficient to cause cell death. There are some indications that possibly remaining tumor cells in this transition zone might become more aggressive and resistant towards further treatment than they would have been if no RF ablation had been performed: It is known that increased temperatures give rise to expression of heat shock proteins [5, 6], which may in turn later-on protect the cells against heat-induced apoptosis [7]. Also, the transition zone develops an increased activity of matrix metalloproteinase [8], which is known to be connected to an increased risk of tumor recurrence in colorectal cancer [9]. Although the clinical relevance of these correlations is yet unknown and there are also a number of indications for the converse point of view (see also the overview paper of Mulier et al. [10]), we argue that incomplete tumor ablation should be avoided whenever possible.
From the slices of a CT scan, it is typically even hard to tell how distant a tumor is located from a large blood vessel, not to mention the cooling effect of this blood vessel on the necrosis. This causes a need for computer assisted planning tools and simulations of the ablation, including the vascular cooling effect. Such simulations are developed by various authors. The way in which vascular cooling is taken into account varies considerably: Simple models use heuristics to quantify the cooling effects [11] or do not consider patient individual vascular systems at all [12]. More advanced approaches model individual vessels by a fixed heat sink [13, 14], and some authors even take blood flow together with heat exchange between vessel and tissue into account [15-17]. For a comprehensive review, see the overview article by Berjano [18]. However, the more precise cooling is considered, the slower the computations are, and, in fact, all models—except those that are based on heuristics—are far too slow to be usable in clinical practice.
In the current publication, we present a novel approach to overcome this dilemma. The idea is to separate the computationally intensive part of the simulation from the patient dependent part as much as possible. Computations that are not dependent on the individual anatomy of the patient can be performed in advance and, if necessary, on high-performance computers. For a given RF applicator and generator type, our idea is to precompute the cooling effect of blood vessels, depending on the vessel radius and its distance to the applicator, and to store these results in a table. Once the table has been generated, the cooling effects for any individual case can be estimated and visualized in real time. Our method points out tumor regions that would be underablated due to vascular cooling and can thus help the attending physician to choose a suitable applicator placement or to decide whether additional steps like a Pringle manoeuvre or chemoembolization should be applied.
2. MATERIALS AND METHODS
In Sect. 2.1, we describe the basic concept of the method, consisting of a quantitative description of necrosis zones in the presence of a vessel as well as an extension model for the case of a complete vascular tree. Section 2.2 briefly addresses the creation of an adaptive look-up table. The mathematical model of RF ablation that we use in this work is presented in Sect. 2.3. along with its numerical approximation in Sect. 2.4.. The setup for our example computations and a first ex-vivo evaluation are described in Sect. 2.5.
2.1. Quantitative Description of Necrosis
2.1.1. Single Vessel Model
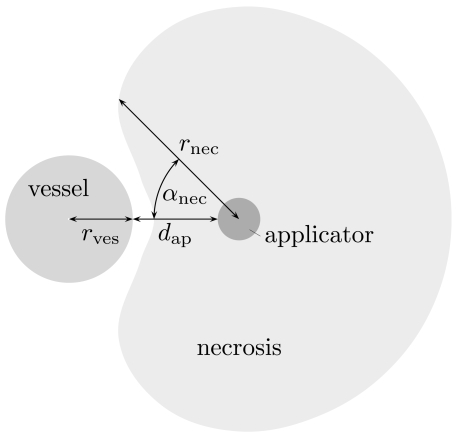
Let us first simplify the general setting by considering the situation of one straight blood vessel of infinite length, oriented parallel to the RF applicator. The cooling effect of this vessel—for a fixed applicator type and generator setting—is assumed to depend on the radius rves of the vessel and on the distance dap of the applicator from the vessel. (Other influence factors, such as the vessel type, will be respected in our forthcoming research.) We quantify the cooling effect by stating the size rnec of the necrosis, measured from the applicator’s center, in all directions orthogonal to the applicator axis.
Using a forward simulation (cf. Sect. 2.3), we establish a connection between the vessel radius rves, the distance dap of the applicator from the vessel, and the resulting necrosis size rnec, which is a function of the direction, expressed as the angle αnec between the direction under consideration and the direction in which the vessel center is located. For reasons of symmetry, it suffices to consider αnec∈[0,π]. We formally denote this relation as a function
see also Fig. (1). For a precise definition we refer the reader to Sect. 2.3.
Fig. (1).
Schematic sketch of the quantities that are related by the function Ф.
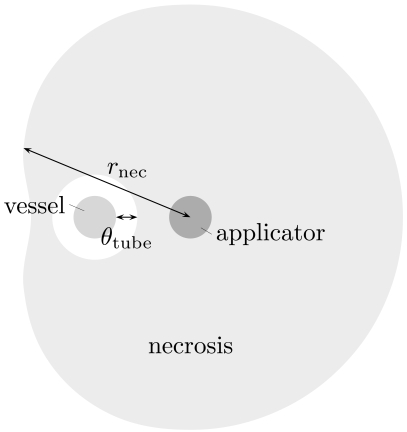
In the case of an encasement of the vessel, we measure the distance to the outer-most boundary of the necrosis area. This measurement ignores the fact that there will be a thin layer of unaffected tissue around the vessel. To compensate for this, we additionally measure the thickness θtube of this tube and hence employ another function
see Fig. (2), where we approximate the tube by a circular cylinder.
Fig. (2).
Schematic sketch of the situation in the case of an encasement.
2.1.2. Full Model
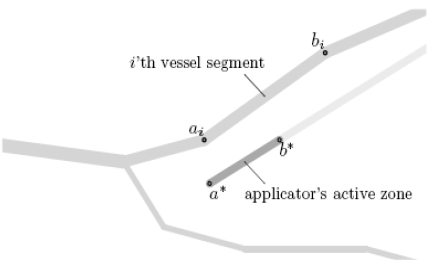
Now, let the complete vascular system be given as a set of straight vessel segments with end points ai, bi ∈ R3 and radii ri > 0 where i=1,...,N (such a charaterization can be obtained using the methods presented earlier [19, 20]), and let a* and b* denote the applicator’s active zone’s end points and r* the applicator’s radius (cf. Fig. 3). We make the simplification that the cooling effect of the blood vessels is additive in the sense that the necrosis achieved in the presence of two blood vessels A and B is given by the intersection of those achieved in the presence of only vessel A and only vessel B – see Fig. (4). For clinically relevant settings, this can be assumed to be a sufficiently good approximation.
Fig. (3).
Location of the points ai and bi (for some value of i) as well as a* and b*.
Fig. (4).
Assumption of additive cooling: The necrosis achieved in the presence of two blood vessels A and B is in clinically relevant settings sufficiently well aproximated by the intersection of those achieved in the presence of only vessel A and only vessel B.
In the following, we denote by [a,b] the straight line from a ∈ R3 to b ∈ R3 and by ∠abc the angle between the lines and . Additionally, by dr,s (a,b) we denote the distance of a ball of radius r around a from a ball of radius s around b, i. e.
Let ξ ∈ R3 be a given point in the tissue, and we want to decide whether the tissue at this point will be destroyed by the ablation or not. For each choice of a point x ∈ [a* ,b*] on the applicator’s active zone and a point y ∈ [ai ,bi] in the i’th vessel segment, we consider the plane containing ξ, x, and y and apply the considerations described in Sect. 2.1.1 in this plane.
The transformation to that plane is not actually computed since the distances of the points ξ, x, and y from each other together with the angle in x suffice to obtain the required information. ξ is destroyed if it is contained in the necrosis described by the function Ф, but not in the tube described by the function Ψ; that is, if
We therefore define
| (1a) |
| (1b) |
so that the set describes the necrosis for fixed x and y.
Now, let y vary over the vascular tree. This corresponds to taking several vascular segements into account and hence reduces the necrosis to the intersection of the corresponding sets. Finally, let x vary along the active zone’s centerline. Since longer electrodes generate longer coagulation zones, we take the union of all the respective necrosis sets. The final formula for the necrosis hence reads
| (1c) |
For the case where all vessel segments are too distant from the applicator to have any effect, this results in the union of balls with equal radius around all the points on the active zone, see Fig. (5).
Fig. (5).
In the absence of near-by vessels, the estimated necrosis consists of the union of balls around all the points on the electrode.
2.2. Adaptive Creation of Look-Up Table
Let us assume that the functions Ф and Ψ (cf. Sect. 2.1) are known in the sense that for given rves, dap and αnec , the values Ф(rves, dap, αnec) and Ψ(rves, dap) can be computed, but this computation is too slow for clinical application. The idea is to approximate Ф and Ψ by some functions and , respectively, with the following properties:
The construction of and (for a given tolerance) requires preferably few evaluations of Ф and Ψ.
Once and have been computed, they can be evaluated very fast.
An easy possiblity consists of the evaluation of the functions on a uniform grid and storage of the function values in an array, together with a piecewise multilinear interpolation (that is, trilinear for Ф and bilinear for Ψ). However, it can be expected that this will result in many unnecessary evaluations since the functions might be approximately multilinear in some regions and more essentially non-multilinear in others.
For that reason, we use an adaptive hierarchic grid technique as described by Bungartz and Dirnstorfer [21], consisting of a hierachical ansatz space of piecewise multilinear functions. This produces a fine grid (i. e. small pieces on which and are multilinear) in regions where this is necessary only. However, in the αnec direction, we use a full grid, since all values can be obtained from the same simulation result here.
Analogously to (1), we define approximations . We emphasize that no special properties of any particular forward simulation model are utilized here.
2.3. A Mathematical Model of RF Ablation
In this section, we briefly describe the forward simulation model that we used to produce the results shown in Sect. 3, i. e. the employed functions Ф and Ψ (in the notation of Sect. 2.1).
As mentioned briefly in the introduction, a broad variety of simulation models for RF ablation exist, and they differ not only in the way in which they consider vascular cooling. They range from simple geometric models that use ellipsoids to describe the necrosis [11] over time dependent PDE models with constant coefficients [13, 16] to complex models that take cell water evaporation and temperature dependent material parameters into account [14, 15, 17]. Some authors exploit rotational symmetry around the applicator axis [12], which is of course impossible if the aim is to consider patient individual vascular systems.
Since the precomputation typically involves several hundred of calls of the forward simulation, we currently use a simplified forward simulation model here. It assumes constant material parameters and is based on a steady state solution. Since also the electric conductivity is assumed to be equal in the parenchyma and the blood vessel, the computation of the electric power density is independent of the location and the geometry of the vessel. Hence, for a given applicator type and generator setting, the potential equation (see (2) below) has to be solved only once, whereas the steady state bio-heat equation (see (4) below) has to be solved for varying blood vessel configurations. We further simplify our model by assuming the applicator to be placed in a direction parallel to the blood vessel and then computing the steady state bio-heat transfer equation in two space dimensions only. Note that for reasons that will become clear below, the potential and power computation must, in contrast, be computed in three space dimensions.
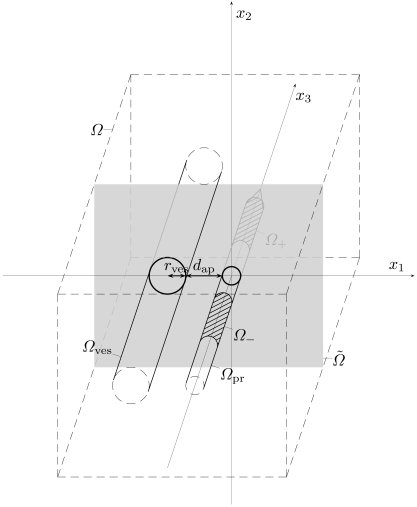
More specific, we consider a cuboid shaped compuational domain Ω ⊂ R3 that is chosen large enough such that any influences from outside can be neglected. Without loss of generality, we assume the centerlines of both the applicator and the blood vessel to be aligned in x3 direction and have an x2 coordinate of 0, cf. Fig. (6). The center of the applicator’s active zone is placed in the origin; the x1 position of the blood vessel is chosen to be negative and such that the distance between blood vessel and applicator matches the prescribed value dap. The open subdomains of Ω occupied by blood vessel, electrodes, and applicator are denoted by Ωves, Ω±, and Ωpr . Here, one of the electrodes is arbitrarily chosen to be Ω+ and the other Ω- , both of which are subsets of Ωpr ; in the case of a monopolar probe, only Ω+ is used. Further, we let
Fig. (6).
Schematic sketch of the geometric setup.
Since the electric potential φ(x) can be considered as quasistatic [12], we can model it as the solution of the elliptic boundary value problem [14]
| (2a) |
| (2b) |
| (2c) |
| (2d) |
Here, σ>0 is the electric conductivity, s is the center of the applicator’s active zone, and n(x) is the outward normal vector. It is a well-known fact that this problem has a unique weak solution where H1 = H1,2 denotes the Sobolev space of functions whose weak first derivatives are square integrable [22].
The electric power density p is now given by [14]
and the remaining quantities are properties and settings of the electric generator, namely its inner resistance RI and the setup power psetup. (These formulae arise from an equivalent circuit that models the generator by a constant voltage source and an inner resistance. Even though we use a steady state model, it is important to capture this power scaling since it is a fact that the effective power is generally lower than the setup power, cf. Sects. 2.5.2 and 3.2).
It is well-known [23] that , and if we extend p to Ω by setting p|Ωpr =0, we have
Performing these computations in two (rather than in three) space dimensions would result in a mismatch of units: ptotal would be an integral over a two-dimensional domain only, hence have a unit that differs by a factor of a meter from the correct unit. In consequence, this would Rtis cause to have a wrong unit as well, and finally the equation for peff would not be well-defined any more, since two quantities with different units would be added in the denominator. The physics of electric fields and electric potentials behaves differently in two dimensions than in three.
The temperature equation, on the other hand, can easily be performed two-dimensional. To do this, we let denote the intersection of Ω and the x1 - x2 plane as a subset of R2, i. e. (see again Fig. 6) and analogously for Ωves, Ωpr, and Гout. Further, we let be given by where
| (3) |
is a suitable projection to be specified below. The remaining modelling is completely performed in two space dimensions, but for simplicity of notation, we will omit the ~ symbol from now on.
The temperature distribution T(x) is modelled by the two-dimensional steady state bio-heat equation [14, 24, 25]
| (4a) |
| (4b) |
| (4c) |
where λ>0 is the thermal conductivity, Tbody is the native body temperature, and ν quantifies the cooling due to small vessels, which are assumed to pervade the complete tissue. This is again an elliptic boundary value problem with unique weak solution .
Once T is known, we let Ωcoag ⊂ Ω denote the set of coagulated tissue,
(where Tcrit is a critical temperature above which the tissue is assumed to be destroyed).
Finally, we define the necrosis size rnec in a direction αnec and the thickness θtube of the uneffected tissue tube according to the size and shape of Ωcoag as described in Sect. 2.1.1. Since, however, a point evaluation of a function in H1 is in general not defined, the set Ωcoag is only defined up to sets of measure zero, so that the precise definition of rnec and θtube is given by
where eα = (cos α, sin α)and xves is the position of the vessel’s centerline in Ω (i. e. xves = (–rves–dap,0)), Bε(x) denotes a ball of radius ε around x, and denotes the Lebesgue measure of a set.
Now that the description of our functions Ф and Ψ is finished, we would like to add some remarks:
The described forward simulation model provides only a rough approximation of the ablation outcome. This is, however, not a substantial drawback since any other model can be plugged in easily, thus any level of precision can be achieved without slowing down the patient individual estimation.
It is well-known that a chemical process like the denaturation of liver cells is not only a function of temperature, but in fact also depends on the duration for which a given temperature is applied. Hence, a better model for the set Ωcoag would be to apply the Arrhenius formalism [12, 14, 26]. However, a steady-state solution does obviously not supply the required time information.
-
A possible choice of the projection P (cf. (8)) is
where 2ℓ is the length of the applicator’s active zone and is a non-negative function with compact support in [-ℓ,ℓ] and the property that . It is straight forward to prove that Pε is well-defined, but the norm does not remain bounded for ε→0. In other words,
does apparently not provide a mapping , and although Pε does provide such a mapping for any ε>0, the result might theoretically depend essentially on the (arbitrary) choice of ε. In the view of remark number 1, we argue that for a full (three-dimensional) forward model, no such mapping will be required any more anyway. Also, the numerical approximation ph of the power density p (see Sect. 2.4 below) is an element of L∞(Ω), so that P0(ph) is well-defined, and so is even P*(ph), where P* is defined by
In our numerical examples, we are using the projection P*.
2.4. Numerical Approximation Using Finite Elements
Both elliptic boundary value problems, (2) and (4), are solved with standard finite element approaches [22]: We cover the computational domain Ω (that is, Ω=Ω for the electric potential or for the temperature) with a uniform Cartesian grid with grid parameter h>0. Let Vh be the space of all continuous functions on that are piecewise trilinear (bilinear for (4)). Let Ω±,h, Ωpr,h, and Ωves,h denote the union of all grid cells that have non-empty intersection with Ω±, Ωpr, or Ωves, respectively, and let Гout,h, Гves,h, Г±,h, and Гiso,h be defined as the respective boundary sections. Further, for any topological space X and any set F of functions X→R, any subset , and any number , we use the notation
i. e. FM=c denotes the set of functions in F that take the constant value c everywhere on M.
With this notation, our numerical solution φh of the potential equation (2) is given by
for all and the additional condition
This results in a system of linear equations for the nodal values of φh that offers a unique solution. The temperature equation (4) is discretized analogously.
2.5. Experimental Setup
2.5.1. Computational Experiments
We performed the patient independent precomputation as described in this paper for a virtual RF applicator that was modelled according to the properties of a CelonProSurge 150-T30™ applicator (Celon AG, Teltow, Germany; cf. Sect. 2.5.2 below). Further, we assumed an electric generator with an inner resistance of 80 Ω, set up to a power of 30 W. In the two-dimensional computation of the temperature distribution, we used a computational domain with an extent of 60×60 mm, covered with a grid of width 0.1 mm. For the three-dimensional computation of the electric potential, we used a domain Ω of extent 38×38×50 mm with a grid width of 0.1 mm in x1 and x2 directions, but a width of 1 mm in x3 direction. The tissue was assumed to denaturate at a temperature of Tcrit = 50 °C. The material parameters σ, λ, and ν were chosen as follows [14]:
and
2.5.2. Ex-Vivo Experiments
A first clinical ex-vivo evaluation of our model has been performed. The clinically relevant part of the evaluation is published separately [27]; we focus here on the aspects that are essential in connection with the current publication.
Pieces of fresh porcine livers were ablated using a CelonProSurge 150-T30™ applicator (bipolar, active zone length 30 mm, isolator length 3 mm, radius 0.9 mm). The power unit was set up to psetup = 30W, but note that due to the varying tissue impedance, the effective power was generally below that value. The ablation was performed until a total energy amount of 15 kJ had been induced (where the required duration varied, see Sect. 3.2 below for details). A glass tube, arranged parallel to the applicator and connected to a pump with an adjustable flow rate of saline, has been used to simulate a blood vessel. The experiments were performed at room temperature (25˚C). A number of experiments has been performed that varied in
the distance dap of the glass tube from the applicator (5 mm or 10 mm),
the radius rves of the glass tube (outer radius between 2.5 mm and 5 mm), and
the flow rate in the glass tube (between 8.3 cm/s and 330 cm/s, which includes the range that has been measured in hepatic blood vessels [15, p. 79], [28, p. 62]).
After each experiment, the liver was cut perpendicular at the center of the applicator. A photograph was taken and imported into a software tool. The lesion border, applicator center, and glass tube location were marked manually with that software tool.
3. RESULTS
3.1. Computational Results
The computations described in Sect. 2.5.1 generated a sparse look-up table containing 526 nodes in the (rves,dap) plane, where 65 values in the direction αnec were stored. The computation required less than hours on a four-years-old standard desktop computer, where about 20 minutes of this time were required to compute the electric potential φ and power density p (cf. Sect. 2.3).
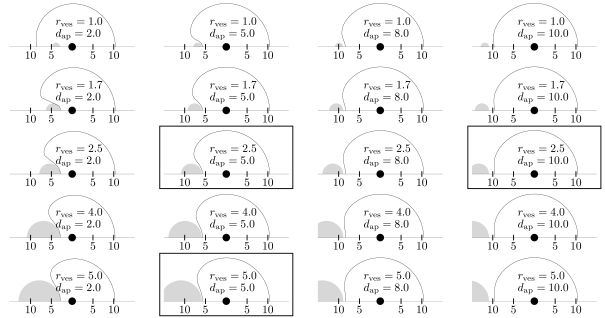
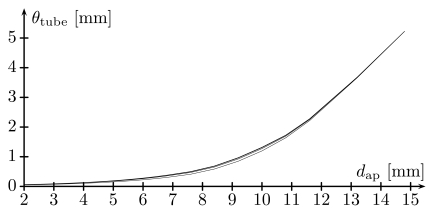
Fig. (7) shows a reconstruction of the necrosis area from the data stored in the look-up table for various values of rves and dap. We did not consider vessels with a radius below 1 mm (diameter below 2 mm) since these will usually be destroyed by blood clots [29]. As can be seen in the figure, encasement can happen (although only rarely), which justifies the additional consideration of a tube of unaffected tissue around the vessel. On the other hand, in cases where encasement happens, the tube is very thin (fractions of a millimeter). This is confirmed by Fig. (8), which shows a plot of the tube thicknesses (values of Ψ) as functions of dap for various values of rves: The tube thickness remains below a clinically significant value for settings in which encasement is imaginable to occur; note that encasement can in particular not occur for since the maximally obtained coagulation radius is about 10 mm.
Fig. (7).
Plot of the necrosis (solid line) for selected values of the vessel radius rves and the applicator distance dap , as reconstructed from the look-up table, i. e. from the function . For reasons of symmetry, we only show the top half plane. For clarity, the corresponding vessel (gray) is also shown. Given quantities are in millimeters. An encasement occured in the top left case—the (very small) tube of unaffected tissue (thickness θtube = 0.05mm ) is not shown. Framed plots correspond to the ex-vivo experiments shown in Figs. (10-12).
Fig. (8).
Plots of the tube thickness θtube as a function of the distance dap for fixed values of the vessel radius rves , that is, the graph of the function Ψ(rves,.). Shown plots are for rves = 1, 2.5, 4, 5 (bottom to top, millimeters).
Since considering this tube does not slow down the computation essentially (neither when creating the tables nor when applying the result to a patient specific data set), we currently decide to retain it.
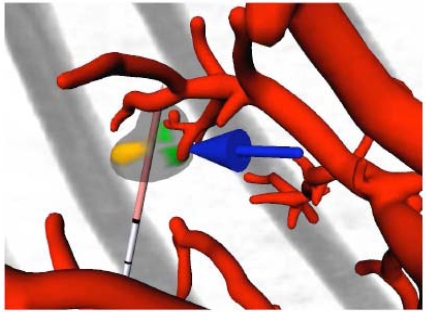
An interactive software tool, based on the MeVisLab platform (www.mevislab.de), has been developed that is meant to assist the physician in the planning of the intervention. It allows for placement and rearrangement of one or several RF applicators and uses colors and arrows to point out underablated tumor regions. See Fig. (9) for an example obtained from a clinical real CT data set, from which the tumors and vessel trees were segmented and preprocessed with methods presented earlier [19, 20].
Fig. (9).
Screenshot of the interactive visualization tool, displaying the vessels (red), the applicator (gray and light red), and the original CT image (gray). A tumor is displayed as well, using three different colors: transparent gray for parts that will be destroyed, brown for parts that will possibly remain unaffected due to a too large distance from the applicator, and green for parts that will possibly remain unaffected due to the influence of blood vessels. A blue arrow points to the latter to catch the observer’s eye.
In the visualization, every point ξ on the tumor surface has to be checked for its containedness in C, which involves a double loop over the points of the vessel skeleton and the electrode axis. We speed up the computation by instead of the outer loop, computing the projection x* = p[a*, b*](ξ) of ξ onto the electrode axis and replacing the check for with the check
for this x*, which, although it potentially underestimates the necrosis, did apparently not influence the result in the examined cases.
3.2. Ex-Vivo Results
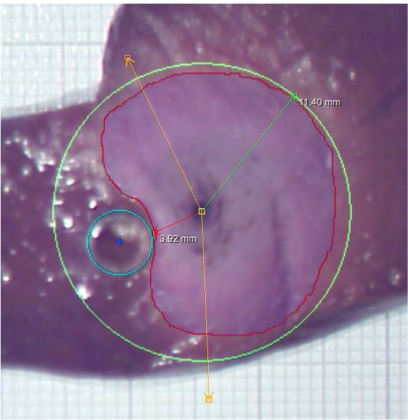
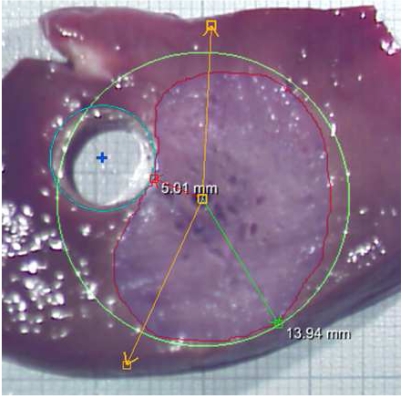
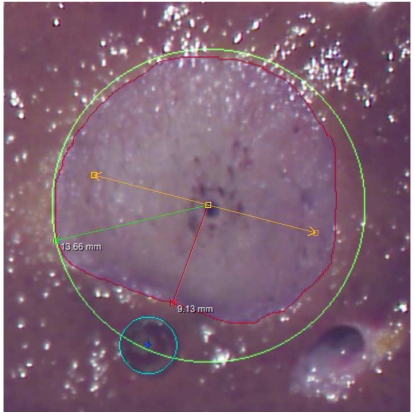
The mean duration of the experiments described in Sect. 2.5.2 was 985 s with a standard deviation of 141 s (n=361). Three example results are shown in Figs. (10-12); note again that the clinically relevant part of the ex-vivo study is published separately [27].
Fig. (10).
Result of an ex-vivo experiment with rves = 2.5mm and dap = 5mm . The red line is the manually drawn contour of the coagulation. The maximal radius of this contour, measured from the applicator’s center, is determined automatically, and a green circle with this radius is drawn. The cyan circle is the contour of the glass tube (also located manually). The amber lines specify a user-defined angle that is irrelevant for the results presented here.
Fig. (12).
Result of an ex-vivo experiment with rves = 5mm and dap = 5mm .
It turned out that between intervention and measurement, a deformation of the tissue and, in particular, a shrinkage of the necrosis took place, which made a quantitative comparison challanging (see figures).
Nevertheless, the evaluation can be used to check the computation results for plausibility. As can be seen from the images, the shape of the necrosis area apparently coincides with the computed results (cf. framed plots in Fig. 7), and so do the total size and, in particular, the distance between the vessel and the necrosis (θtube).
Additionally, the results give rise to the conclusion that the blood flow rate has essentially no influence on the ablation result [27]. This implies that the blood is not heated up considerably, i. e. the Dirichlet boundary condition for the temperature (4c) is justified. Other authors consider the so-called thermal equilibration length, that is the length of a blood vessel within which the blood is heated up such that the temperature difference to the surrounding tissue is reduced by a factor of exp(–1). According to Creeze and Lagendijk [30], the thermal equilibration length for vessels of the size we are concerned about is essentially above the length scale which the heat of an RF applicator affects, which confirms our observation.
Another point is that the ex-vivo results do not show a significant dependence on the vessel radius [27]. The computational results clearly indicate such a dependence. However, this is not a contradiction, since this dependence mainly appears if rves and / or dap are chosen outside the range covered by the ex-vivo experiments (that is, rves < 2.5mm or dap < 5mm), see again Fig. (7).
Additional ex-vivo experiments were performed to verify that the glass did not influence the necrosis: We compared experiments with disabled pump to those without any glass tube, not obtaining visual differences [27].
4. DISCUSSION
We presented a concept for a fast estimation of the cooling effects induced by the vascular systems in hepatic RF ablation. The idea is based on patient-independent precomputations, the results of which are stored in a look-up table. Currently, the look-up table establishes a relationship between the radius of a vessel, the distance of an RF applicator from the vessel, and the cooling effect due to this vessel. The cooling effect is expressed as a direction dependent size of the necrosis, together with the distance from the vessel in which tissue remains unaffected.
The results of our computation can be visualized using a tool that allows to place and move applicators interactively and is meant to assist the physician in the intervention planning step. First ex-vivo experiments confirmed some of the computational results.
We would like to emphasize that our visualizations are not meant to replace a thorough intervention planning, nor are they meant to claim that in certain situations RF ablation cannot be successful. It is of course up to the physician’s choice to perform additional steps like a Pringle manoeuvre or chemoembolization to avoid the cooling effect.
In our future work, we plan a number of extensions to our model, including the following:
We will replace the currently used, partially two-dimensional forward simulation model (Sect. 2.3) with a fully three-dimensional, time-dependent model that also takes state dependent material paramters into account.
We will examine whether the orientation of the applicator (in relation to the blood vessel) has an essential influence on the result and include this parameter into the look-up table, if necessary. This will introduce additional dimensions in the look-up table, hence requiring essentially more precomputations.
Other subjects of future work are a thorough evaluation, including a verification of the assumption of additive cooling (cf. Sect. 2.1), as well as the creation of look-up tables for a large number of clinically employed applicator and generator types and settings. The validity of our modelling of the blood vessels (constant temperature, same electric conductivity as in the parenchyma) will also be examined.
In view of a more realistic evaluation, it would be useful to employ a setup similar to that described by Lubienski et al. [31].
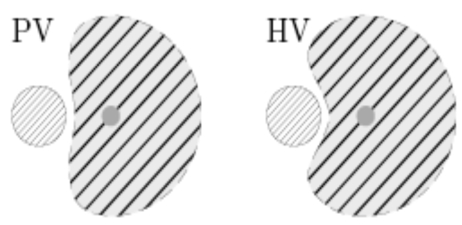
As has been published earlier [32, 33], the cooling effect of different hepatic vascular systems (that is in particular, the portal venous (PV) versus the hepatic venous (HV) tree) result in considerably different necrosis shapes, see Fig. (13). However, to our knowledge, no forward simulation model for the incorporation of this effect has been proposed by now. Once such a model has been developed, we will incorporate it into our concept. Note that this is straight forward by just preparing independent look-up tables for these two systems (roughly doubling the number of precomputations).
Fig. (13).
Schematic of different cooling effects induced by portal venous (left) and hepatic venous (right) vessel systems (qualitatively).
Finally, we would like to remark that our proposed method strongly relies on a precise vessel and tumor segmentation result. The radius information supplied by the currently employed segmentation algorithm [19, 20] is, however, not accurate enough for this purpose [34]. Note that even although the vessel radius is less decisive for the cooling effect (cf. Sect. 3.2), an incorrect vessel radius will (supposed that the vessel centerline has been determined correctly) also essentially distort the information about the distance of both applicator and tumor from the vessel. Once better segmentation procedures have been developed, they can directly be used by our model—recomputation of the look-up tables will not be necessary.
Fig. (11).
Result of an ex-vivo experiment with rves = 2.5mm and dap = 10mm .
ACKNOWLEDGEMENTS
Part of this research was supported by the German Research Foundation (project Pe199/15-2). We would like to thank Thomas Stein from Celon AG, Teltow, Germany, for supplying precise information about the utilized applicators, as well as Susanne Zentis, Claudia Hilck, and Michaela Jesse from MeVis Medical Solutions for performing the analysis of the CT scans from the example case. We also thank all our colleagues at Fraunhofer MEVIS for hints and helpful discussions and in particular Andreas Weihusen and Christian Rieder for their work on software toolkits for the clinical evaluation.
REFERENCES
- 1.World Health Organization. “Fact sheet no. 297 ‘cancer”, Feb. 2009. [Online] Available: http://www.who.int/mediacentre/factsheets/fs297 . [Accessed: Oct. 5, 2009].
- 2.Pereira P.L. “Actual role of radiofrequency ablation of liver metastases,”. Eur. Radiol. 2007;17:2062–2070. doi: 10.1007/s00330-007-0587-0. [DOI] [PubMed] [Google Scholar]
- 3.Goldberg S.N., Grassi C.J., Cardella J.F., Charboneau J.W., Dodd III G.D., Dupuy D.E., Gervais D, Gillams A.R., Kanna R.A., Lee F.T., Livraghi T, McGahan J, Phillips D.A., Rhim H, Silverman S.G. “Image-guided tumor ablation: Standardization of terminology and reporting criteria,”. Radiology. 2005;235:28–739. doi: 10.1148/radiol.2353042205. [DOI] [PMC free article] [PubMed] [Google Scholar]
- 4.Lu D.S.K., Raman S.S., Vodopich D.J., Wang M, Sayre J, Lassman C. “Effect of vessel size and creation of hepatic radiofrequency lesions in pigs: assessment of the “heat sink” effect,”. Am. J. Roentgenol. 2002;178:47–51. doi: 10.2214/ajr.178.1.1780047. [DOI] [PubMed] [Google Scholar]
- 5.Lindquist S. “The heat-shock response,”. Ann. Rev. Biochem. 1986;55:1151–1191. doi: 10.1146/annurev.bi.55.070186.005443. [DOI] [PubMed] [Google Scholar]
- 6.Schueller G, Kettenbach J, Sedivy R, Stift A, Friedl J, Gnant M, Lammer J. “Heat shock protein expression induced by percutaneous radiofrequency ablation of hepatocellular carcinoma in vivo,”. Int. J. Oncol. 2004;24:609–613. [PubMed] [Google Scholar]
- 7.Mosser D.D., Caron A.W., Bourget L, Denis-Larose C, Massie B. “Role of the human heat shock protein hsp70 in protection against stress-induces apoptosis,”. Mol. Cell Biol. 1997;17:5317–5327. doi: 10.1128/mcb.17.9.5317. [DOI] [PMC free article] [PubMed] [Google Scholar]
- 8.Frich L, Bjørnland K, Pettersen S, Clausen O.P.F., Gladhaug I.P. “Increased activity of matrix metalloproteinase 2 and 9 after hepatic radiofrequency ablation,”. J. Surg. Res. 2006;135:297–304. doi: 10.1016/j.jss.2006.05.010. [DOI] [PubMed] [Google Scholar]
- 9.Wagenaar-Miller R, Gorden L, Mastrisian L.M. “Matrix metalloproteinase in colorectal cancer: Is it worth talking about?,”. Canc. Metastat. Rev. 2004;23:119–135. doi: 10.1023/a:1025819214508. [DOI] [PubMed] [Google Scholar]
- 10.Mulier S, Ni Y, Jamart J, Michel L, Marchal G, Ruers T. “Radiofrequency ablation versus resection for resectable colorectal liver metastases: time for a randomized trial?,”. Ann. Surg. Oncol. 2007;15:144–157. doi: 10.1245/s10434-007-9478-5. [DOI] [PubMed] [Google Scholar]
- 11.Villard C, Soler L, Gangi A. “Radiofrequency ablation of hepatic tumors; simulation, planning, and contribution of virtual reality and haptics,”. Comput. Meth. Biomed. Eng. 2005;8:215–227. doi: 10.1080/10255840500289988. [DOI] [PubMed] [Google Scholar]
- 12.Stein T. Müller, Berlien, editors. Untersuchungen zur Dosimetrie der hochfrequenzstrominduzierten interstitiellen Thermotherapie in bipolarer Technik, Fortschritte in der Lasermedizin. 2000;22 [Google Scholar]
- 13.Tungjikusolum S, Staelin S.T., Haemmerich D, Tsai J.-Z., Cao H, Webster J.G., Lee F.T., Mahvi D.M., Vorperian V.R. “Three-dimensional finite-element analyses for radio-frequency hepatic tumor ablation,”. IEEE Trans. Biomed. Eng. 2002;49:3–9. doi: 10.1109/10.972834. [DOI] [PubMed] [Google Scholar]
- 14.Larsen R, Nielsen M, Sporring L. “9th International Conference on Medical Image Computing and Computer Assisted Intervention (MICCAI)”, Lecture Note in Computer Science. vol. 4191, pp. 380-388, 2006.
- 15.Welp C. Ph.D. thesis, Ruhr-Universität Bochum: Bochum, Germany. 2005. “Simulationsbasierte Untersuchung der hochfrequenten Thermoablation bei Lebertumoren,”. [Google Scholar]
- 16.Mooibroek J, Lagendijk J.J. “A fast and simple algorithm for the calculation of convective heat transfer by large vessels in three-dimensional inhomogeneous tissues,”. IEEE Trans. Biomed. Eng. 1991;38:490–501. doi: 10.1109/10.81569. [DOI] [PubMed] [Google Scholar]
- 17.Sheu T.W., Chou C, Tsai S, Liang P. “Three-dimensional analysis for radio-frequency ablation of liver tumor with blood perfusion effect,”. Comput. Meth. Biomech. Biomed. Eng. 2005;8:229–240. doi: 10.1080/10255840500289731. [DOI] [PubMed] [Google Scholar]
- 18.Berjano E.J. “Theoretical modelling for radiofrequency ablation: state-of-the-art and challenges for the future,”. [Accessed Oct. 5, 2009];Biomed. Eng. Online. 2006 Apr;5(24) doi: 10.1186/1475-925X-5-24. [Online]. Available: http://www.biomedical-engineering-online.com/content/5/1/24 . [DOI] [PMC free article] [PubMed] [Google Scholar]
- 19.Bourquain H, Schenk A, Link F, Preim B, Prause G, Peitgen H.O. “Hepavision2: a software assistant for preoperative planning in living-related liver transplantation and oncologic liver surgery,”. Proceedings of the 16th International Congress and Exihibition on Computer Assisted Radiology and Surgery (CARS) 2002. pp. 341–346.
- 20.Selle D, Preim B, Schenk A, Peitgen H.O. “Analysis of vasculature for liver surgical planning.,”. IEEE Trans. Med. Imaging. 2002;21:1344–1357. doi: 10.1109/TMI.2002.801166. [DOI] [PubMed] [Google Scholar]
- 21.Bungartz H, Dirnstorfer D. “Multivariate quadrature on adaptive sparse grids,”. Computing. 2003;71:89–114. [Google Scholar]
- 22.Johnson C. “Numerical Solution of Partial Differential Equations by the Finite Element Method. UK: Dover Publications; 2009. [Google Scholar]
- 23.Antontsev S.N., Chipot M. “The thermistor problem: Existence, smoothness, uniqueness, blowup,”. SIAM J. Math. Anal. 1994;25:1128–1156. [Google Scholar]
- 24.Pennes H.H. “Analysis of tissue and arterial blood temperatures in a resting forearm,”. J. Appl. Physiol. 1948;1:93–122. doi: 10.1152/jappl.1948.1.2.93. [DOI] [PubMed] [Google Scholar]
- 25.Deuflhard P, Weiser M, Seebaß M. “A new nonlinear elliptic multilevel fem applied to regional hyperthermia,”. Comput. Vis. Sci. 2000;3:115–120. [Google Scholar]
- 26.Arrhenius S. “Über die Reaktionsgeschwindigkeit bei der Inversion von Rohrzucker durch Säuren,”. Z. Phys. Chem. 1889;4:226–248. [Google Scholar]
- 27.Lehmann K.S., Ritz J.P., Valdeig S, Knappe V, Schenk A, Weihusen A, Rieder C, Holmer C, Zurbuchen U, Hoffman P, Peitgen H.O., Buhr H.J., Frericks B.B. “Ex situ quantification of the cooling effect of liver vessels on radiofrequency ablation,”. Langenbeck’s Archiv. Surg. 2009;394:475–481. doi: 10.1007/s00423-009-0480-1. [DOI] [PubMed] [Google Scholar]
- 28.Wermke W. Sonographische Differenzialdiagnose Leberkrankheiten. Deutscher Ärzte Verlag GmbH. 2006 [Google Scholar]
- 29.De Baere T, Denys A, Wood B.J., Lassau N, Kardache M, Vilgrain V, Menu Y, Roche A. “Radiofrequency liver ablation: Experimental comparative study of water-cooled versus expandable systems,”. Am. J. Roentgenol. 2001;176:187–192. doi: 10.2214/ajr.176.1.1760187. [DOI] [PubMed] [Google Scholar]
- 30.Crezee J, Lagendijk J. “Temperature uniformity during hyperthermia: the impact of large vessels,”. Phys. Med. Biol. 1992;37:1321–1337. doi: 10.1088/0031-9155/37/6/009. [DOI] [PubMed] [Google Scholar]
- 31.Lubienski A, Bitsch R.G., Lubienski K, Kauffmann G, Duex M. “Radiofrequency ablation (rfa): development of a flow model for bovine livers for extensive bench testing,”. Cardiovasc. Interv. Radiol. 2006;29:1068–1072. doi: 10.1007/s00270-004-0338-4. [DOI] [PubMed] [Google Scholar]
- 32.Bangard C, Gossmann A, Kasper H.U., Hellmich M, Fischer J, Hoelscher A, Lacker K, Stippel D.L. “Experimental radiofrequency ablation near the portal and the hepatic veins in pigs: differences in efficacy of a monopolar ablation system,”. J. Surg. Res. 2006;135:113–119. doi: 10.1016/j.jss.2006.02.026. [DOI] [PubMed] [Google Scholar]
- 33.Frericks B.B., Ritz J.P., Albrecht T, Valdeig S, Schenk A, Wolf K.J., Lehmann K. “Influence of intrahepatic vessels on volume and shape of percutaneous thermal ablation zones: In vivo evaluation in a porcine model,”. Invest. Radiol. 2008;43:211–218. doi: 10.1097/RLI.0b013e31815daf36. [DOI] [PubMed] [Google Scholar]
- 34.Drexl J, Knappe V, Hahn H.K., Lehmann K.S., Frericks B, Shin H, Peitgen H.O. “Accuracy analysis of vessel segmentation for a litt dosimetry planning system,”. In: Buzug T.M., Lueth T.C., editors. Perspective in Image-Guided Surgery. World Scientific; 2004. [Google Scholar]


