Abstract
Recent progress in bottom-up tissue engineering has demonstrated that three-dimensional (3D) tissue constructs with pre-defined architectures may be obtained by assembling shape-controlled hydrogels in multiphase reactor systems. Driven by the hydrophobic force between gel unit and liquid media, highly ordered hydrogel clusters can be formed. Many complex factors occurring at microscale (i.e. gel unit collisions, hydrophobic forces and gel unit movement), are involved in the self-assembly process. In this paper a two-dimensional (2D) off-lattice Monte Carlo model with Lennard-Jones type potential describing unit-unit interactions, is introduced for studying this process. Simulations are shown to agree well with the experimental results for hydrogel assembly in mineral oil. The simulation method is demonstrated for rectangular hydrogel units of different aspect ratios as well as extended to the case of more complex hydrogel units geometries.
1. Introduction
Recent progress in bottom-up tissue engineering has resulted in new approaches to form biomimetic 3D tissue construct by assembling cell-laden microengineered hydrogel (microgel) building blocks [1-3]. So far, several approaches have been used for bottom-up assembly of microgels, such as physical manipulation of individual cell-laden microgels [4], random packing of cell-laden microgels [5], and building layers of microgels with controlled arrangement by photolithography [6]. However, none of these approaches are both scalable and capable of controlling the architecture of the assembly. Du et al. demonstrated the first attempt to form tunable 3D hydrogel assemblies in a highly scalable manner [1], which provides a potentially powerful tool to form biomimetic 3D tissue constructs. Hydrogel assemblies with predestined geometric arrangement can be obtained by assembling shape-controlled hydrogels in multiphase reactor systems. Hydrogel units made from hydrophilic polymeric materials were generated by photolithography, mixed in hydrophobic mineral oil and subjected to mechanical agitation. The hydrogel self-assembly process is driven by the hydrophobic effect which minimizes multi-phase interface area and free energy [7].
Four different types of cluster structures (random, branches, offset and linear, see Figure 1) have been observed as a result of the self-assembly process [1]. The percentage of different types varies depending on the choice of experimental parameters including time, size and shape of the hydrogel unit, agitation strength and the surface tension [1]. The linear type of the hydrogel clusters is preferred as the biomimetic 3D tissue construct due to its well-defined architecture and the minimal local energy (Figure 1). To control the self-assembly process, large numbers of experiments are required to find the optimal parameters, which require extensive resources and is time-consuming. A quantitative model of the self-assembling process will facilitate the understanding of the self-assembly mechanism and in the optimization of the experiments.
Figure 1.
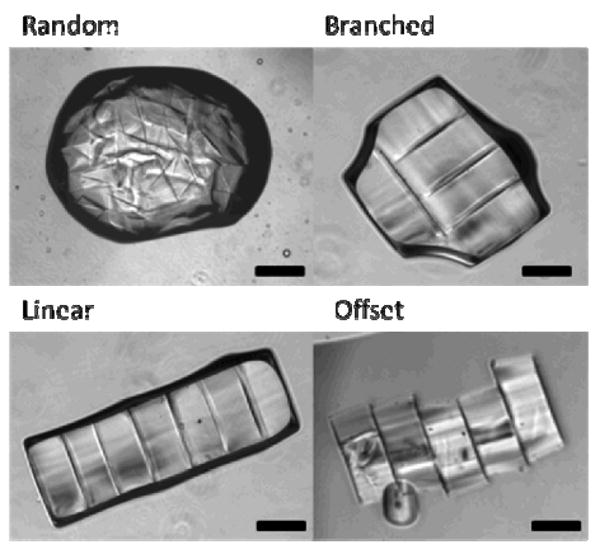
Four different structures of hydrogel clusters.
In this paper we describe a computational model to supplement the experimental approach [1-21]. Quantitative biological model is based on detailed assumptions about the physical process to help researchers to optimize the experiments. To date, several models have been developed for simulating hydrophobic effects in the context of molecule assembly [2,6,7,11,18] including molecular dynamics model with energy governed interactions of surfactants in solution and continuum model of ion-specific protein-protein interactions with explicit solvent21. However, all these models utilize the effect of the hydrophobic interactions at molecular scale and their applicable spatial scale is in the range of 10-9 to 10-6 m, which is far less than the mesoscale in the self-assembly of hydrogels (0.001-0.1m). Furthermore, the time scale of the molecular scale models (with upper limit of 10-6 sec.) is significantly shorter than those required to describe the self-assembly process (from 10 to 1000 sec.).
One possible solution to overcome the problems related to the spatial and temporal scales is to use continuous models in which properties of the physical system, such as gel unit distribution, are described as continuous functions and the relationships between the variables are described by differential equations. However, physical mechanism leading to formation of different types of cluster structures (random, branched, offset and linear) involves many microscale events including gel collisions, hydrophobic interactions and gel units detachment, which is difficult to simulate using a continuous model. Discrete models play an important role in simulating events occurring at the micro and mesoscale, in which each individual object is explicitly presented and a coarse-grained potential is used to describe objects interaction. In particular, Newman [15] developed a subcellular element model to simulate the dynamics of a large number of interacting cells. Also, discrete off-lattice models were used by Wu et al. [17,22] to study swarming in bacterial colonies.
Coarse grained methods have been extensively used in mesoscale modeling to resolve time and length scale problems. In this approach, groups of atoms are used as the basic objects and interactions between objects are described by different types of potentials. In particular, mesoscale coarse grained model was used to study cyclic dynamics and hydrodynamical fluctuations of molecular machines [18]. In this model, each protein is described as a polymer network with a set of identical beads (atomic groups) and the interactions between the polymer protein and solvent molecule is represented by the Lennard_Jones (LJ) potential. Using lipid molecule as the basic coarse grained object, Revalee et al. [21] developed an efficient implicit-solvent model for simulating self-assembly of lipid bilayers based with a soft-core potential describing lipid molecular interactions. Cooke et al. [14] used an implicit solvent modified LJ potential to describe lipid molecular interactions. Glotzer et al. [23] used patchy points on the particles surface and LJ potential to simulate the self-assembly of those particles.
In this paper we describe a coarse grained off-lattice discrete model to simulate hydrogel self-assembly process. The hydrogel unit surface contains several interaction points and a LJ type potential is used to describe point-point interactions contributing to the surface energy. Choice of the specific form of the potential depends on the specific liquid media. We show that simulations agree with the experimental results. The method is demonstrated for rectangular hydrogel units but it can be extended to any unit shape and type of liquid media.
2. Experimental Methods
Microgel units were fabricated by photolithography and assembled in oil-water interface by mechanical agitation, which have been described in detail previously [1,19]. Briefly, the prepolymer solution [20% (w/w) poly(ethylene glycol)-methacrylate polymer, (PEGmA, MW: 1000, Polysciences) in Dulbecco's Phosphate Buffered Saline (DPBS, Gibco)] containing 1% photoinitiator (w/w total solution) [2-hydroxy-1-(4-(hydroxyethoxy) phenyl)-2-methyl-1-propanone (Irgacure 2959, CIBA Chemicals)] were exposed to UV polymerization through the photomask (designed using AutoCAD and printed on transparencies) with square and the lock -and-key patterns. Following the microgel formation, microgel units (total number of 500) were soaked in prepolymer solution and transferred to a 60×15mm dish (Fisher Scientific) containing 6ml mineral oil (CVS pharmacy). Microgel units were assembled in oil-water interface by mechanical agitation, which was applied by manually manipulating a pipette tip. All the reagents were purchased from Sigma Aldrich, unless specifically mentioned.
3. Computational Model
3.1. Model assumptions
The mechanical deformation of hydrogels is highly dependent on the force that is exerted on the gels. Under our assembling conditions the hydrophobic/hydrophilic surface tension forces are not strong enough to form deformations in the gels as shown in the previously published work [1]. Our model assumption of building blocks being rigid is therefore valid for the conditions described in such studies. Furthermore, the hydrophobic forces involved in assembly play a role not at the molecular level but rather at the interface between a two phase component comprised of microgels in a secondary phase of hydrophobic media. Thus the assembling forces are surface tension between hydrophobic / hydrophilic interface. This is the reason that the gels do not collapse as they are preformed and the water that is entrapped in each of the gels remains within the gels throughout the assembly process.
Rectangular (or other shaped) hydrogel units are initially homogeneously distributed in a liquid media and the mixture is randomly rotated or stirred. We assume that hydrogel units move randomly due to the external random perturbations. When hydrogel units get close to each other and collide, their movement is driven by hydrophobic forces that assemble them into a cluster to minimize the hydrophobic-hydrophilic interface contact area. At an early stage, hydrogel units of an aggregated cluster are randomly oriented. Hydrophobic forces between the units yield further unit alignment resulting in highly ordered clusters with different structures (see Figure 1).
Some parameters in the model are directly linked to the experimental parameters. For example, the value of epsilon represents the adhesion strength between unit's surfaces and the aspect ratio in the model corresponds to the experimental one. However, many physical processes involved in the experiments are difficult to describe in details in the model. For instance, the stirring frequency, strength and stirring mode (direction) all affect the fluid-unit and unit-unit dynamics, and are difficult to be precisely simulated in the model. Instead, in the model, combined effects of those processes are represented by two parameters: temperature T and unit velocity V, describing the unit-unit detachment effects and unit mobility driven by those processes, respectively. It is difficult to find the precise relationship between those two parameters and the real physical experimental parameters. However, model helps to estimate the tendency controlled by the experimental parameters. For instance, higher temperature T and unit velocity V correspond to the increase of the stirring frequency.
3.2 Basic components of the model
Although the experiment is performed in a 3D environment, most hydrogel unit interactions still take place on the bottom of the experimental container. It was observed that hydrogel clusters are formed in the same plane. To simplify the problem, a 2D model is developed in the current paper. In this model gel units move on a square N×N lattice with periodic boundary conditions. We assume that shape and size of each individual gel unit stays unchanged. Each unit is described with three variables: coordinates of the center of mass (x, y) and orientation (rotation angle θ). To simplify the model, we chose a large number of force points (pixels) homogeneously distributed on the boundary of each piece of gel and calculate gel-gel surface interactions as a sum of force point-point interactions. Figure 2 demonstrates how interactions between rectangular gel units are represented in the model. The distance between two neighboring interaction points is denoted as δ1 and the points are located inside the gel unit with the distance to the edge of δ2, implying that the smallest distance between interaction points of two neighboring hydrogels' is 2δ2. One can use the same approach to represent interactions between units with complex shape geometries.
Figure 2.
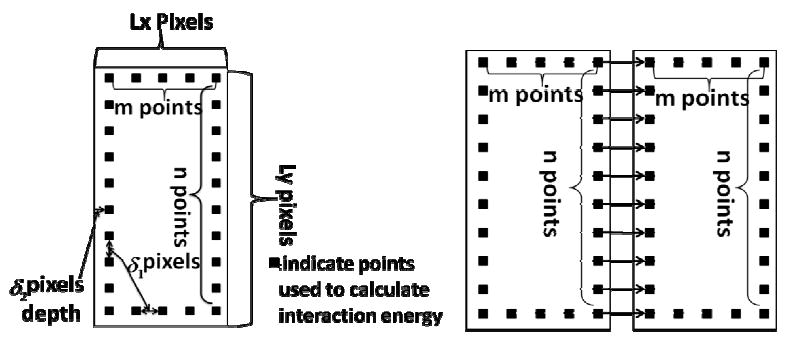
Diagram describing model representation of the hydrogel pieces.
3.3 Energy of hydrophobic interactions between gel units
Previous results [21] indicate that the hydrophobic energy ΔAhyd at liquid-solid interfaces depends linearly on the solute surface area A
| (1) |
where γ is a free energy/surface area coefficient and b is a free energy of hydration for a point solute.
Hydrophobic effect takes place when the distance between surfaces of two neighboring gels units is very small (of nm scale). We initially used a stepwise function to describe the hydrophobic effects between unit surfaces. However, after even a long time (30000 Monte Carlo steps (MCS)), the simulation did not reproduce cluster formation process observed in the experiment
Most unit collisions in the simulations resulted in corner-edge configurations (see Figure 3 (a)), not leading to unit-unit attachment. To avoid this we used LJ type potential with a cutoff value [9] to describe gel-gel interaction energy
Figure 3.
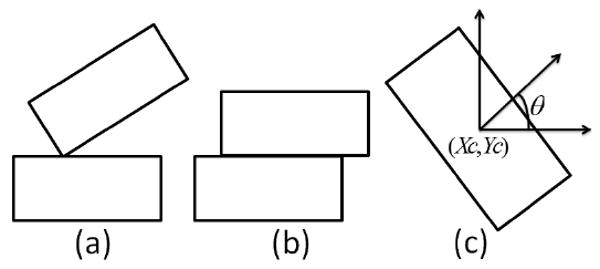
Diagram describing collisions and dynamics of hydrogels. (a) and (b) demonstrate corner-edge and edge-edge unit collisions. (c) indicates variables describing position and orientation of a gel.
| (2) |
| (3) |
where i and j represent interaction points of two neighboring hydrogels n and m, ε is the depth of the potential well and rmin is the minimal distance between two neighboring hydrogels' interaction points. In this paper we choose rmin = 2δ2 pixels and ε depends on the media. The total interaction energy is calculated by summing up interaction energies between all points i and j in the two neighboring hydrogel units. As demonstrated in Figure 4, as the distance between two hydrogels increases, the interaction energy approaches zero very quickly. By adjusting the cutoff value, one can control the effective range of the interaction potential.
Figure 4.
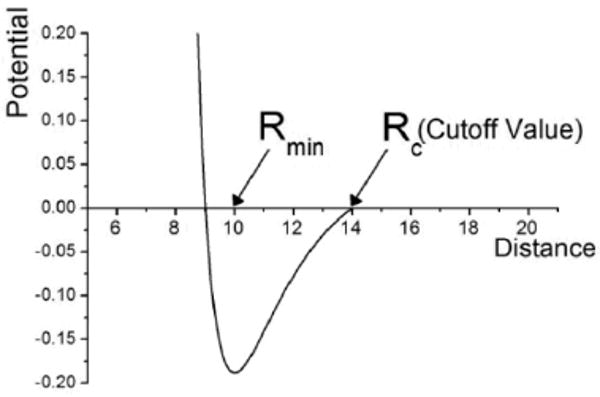
Lennard-Jones type potential with indicated cutoff value in normalized (unit less) form.
3.4 Dynamics of the hydrogels
Monte Carlo simulation starts with random initial hydrogel configuration. Location and orientation of each individual hydrogel are described by three variables (Xc,Yc,θ) (see Figure 3(c)). At each simulation step, a random movement of a randomly selected unit is attempted. There are three types of such movement in the model: random displacement of the center of mass (in X or Y direction) or random rotation of a hydrogel unit. If the random movement causes an overlap between units, then the movement attempt is ignored. Acceptance of a movement attempt is based on the resulting energy change ΔE (equations (2) and (3)) and Metropolis algorithm [8]. Namely, movement attempt is accepted with probability P(ΔE) = 1 if ΔE ≤ 0 and P(ΔE) = exp−(ΔE/T) if ΔE > 0, where T represents effective amplitude of the stirring intensity in units of energy. Large values of T result in the higher hydrogel cluster detachment frequency.
In the simulation, large enough ΔE/T will result in the probability of breaking an edge-edge contact between two units being very small causing a large cluster of hydrogels to freeze. We resolve this problem by treating cluster as a new unit. During the Metropolis updating process, when probability of one hydrogel's movement is very small due to attachment to a large cluster, the whole cluster is rotated with respect to its center of mass. Then positional information of all individual units in the cluster is updated. At the same time, probability of detachment of an individual unit from the cluster is calculated.
4. Results
4.1 Simulations in different liquid media
Different liquid media have different hydrophobic effects, leading to different cluster aggregation configurations. In our model media effects are implicitly included in the interaction potential (Eq. 2) where parameter ε describes the intensity of the hydrophobic forces between media and hydrogels. Both ε and stirring intensity T determine the attachment rate between neighboring units. We choose approapriate ε values by performing series of tests. Figure 5 demonstrates two simulation results with different ε values. A relatively large value of ε was used to represent oil-like media (Figure 5(a)). Hydrogel clusters are clearly formed for the following numbers of MCS=50000, 600000. Small value of ε was used in a simulation of waterlike media (Figure 5(b)). No unit clusters were observed even for a large number of MCS=200000.
Figure 5.
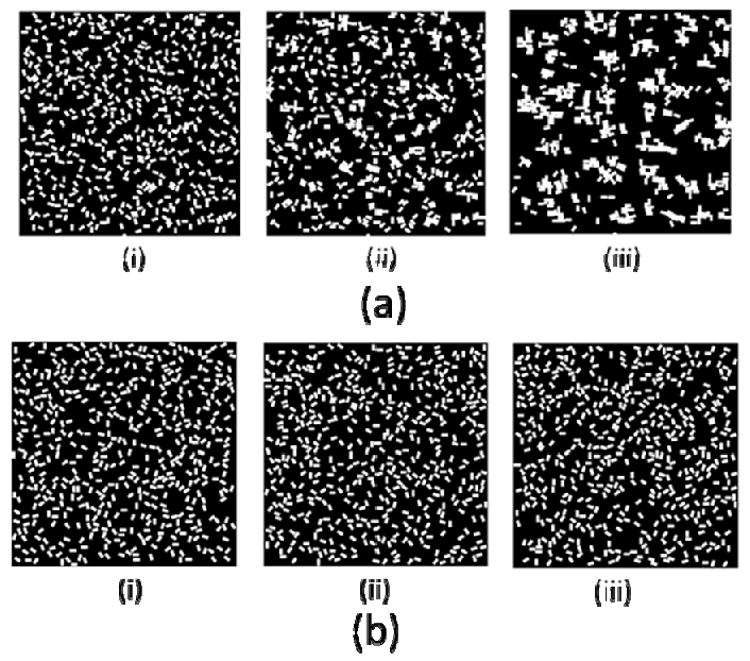
(a). Formation of self-assembled clusters in a simulation with an oil-like potential. (i): MCS=2000, (ii): MCS=50000, (iii): MCS=600000 (ε = 1, 1/T=5, Lx=50, Ly=100). 5(b). Formation of self-assembly clusters in a simulation with a water-like potential. (i):MCS=2000 (ii):MCS=50000 (iii): MCS=200000. (ε = 0.1, 1/T=5, Lx=50, Ly=100).
4.2 Distributions of different types of clusters
Figure 6a shows length distributions of linear hydrogel clusters upon agitation in an experiment for different times (see [1]). At the initial stage (5 seconds), clusters of sizes 2,3,5 and 6 gel units appear but clusters of size 2 and 3 units dominate. At 15 seconds, the number of clusters of size 2 and 3 decreases and the number of larger clusters increases. The length distribution stablizes after agitaion of more than 30 seconds with most of the clcusters being from 2 to 6 gel units.
Figure 6.
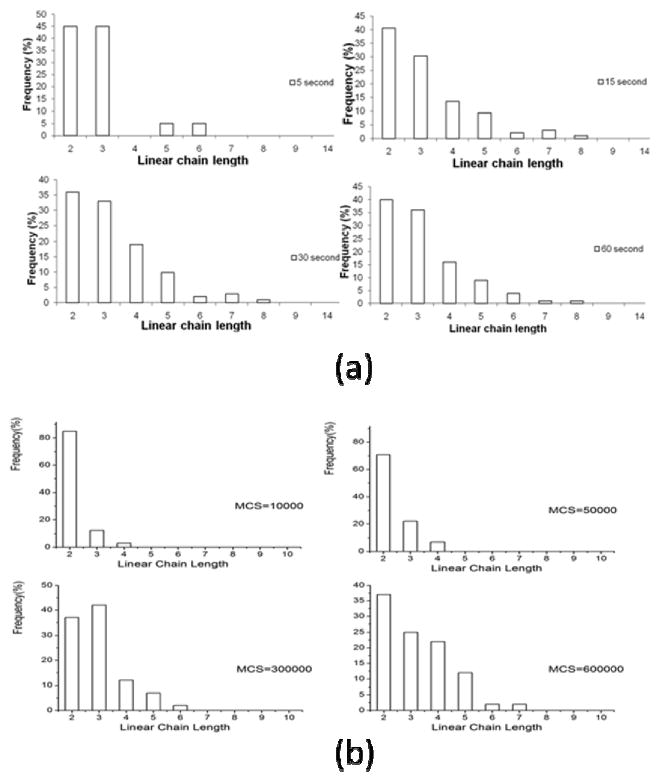
(a) Linear hydrogel chain length distribtuions in the experiment [1]. (b) Hydrogel chain length distribtuions in simulations (Lx=50, Ly=100).
Simulation results are shown in Figures 5(a) and 6(b). In the simulations, T=0.2 and the size of the hydrogel unit is chosen to be 50 pixels × 100 pixels. At the initial stage (MCS=2000) only small clusters are formed and no large size (bigger then 7) clusters are present. At MCS=10000 clusters of size 2,3 and 4 appear and clusters of size 2 dominate. At MCS=300000, large clusters (of size 5 and 6) are formed and the number of small clusters (of size 2 and 3) decreases. At MCS=600000, clusters of size 7 are formed and the number of large clusters still increases. Therefore, simulation results demonstrate tendency similar to the one observed an experiment. With time, the number of small clusters decreases and the number of large clusters increases.
4.3 Role of the hydrogel shape
4.3.1 Rectangular shapes
In Figures 7 and 8 rectangles consisting of 60 pixels × 160 pixels were used to represent gels corresponding to the hydrogels of size 150 um × 400 um used in an experiment.
Figure. 7.
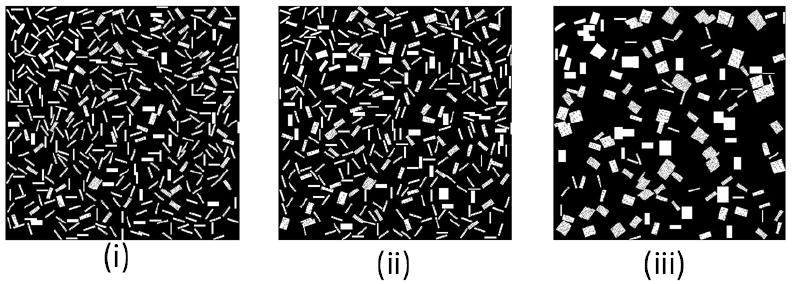
Simulations of hydrogel cluster self-assembly in oil-like medium. (i): MCS=2000 (ii):MCS=50000 (iii): MCS=600000. (ε = 1, 1/T=3, Lx=60, Ly=160).
Figure 8.

Distribtuions of hydrogel chain lengths in simulations (Lx=60,Ly=160).
Figure 6(b) and Figure 8 show the statistics of assembly of hydrogels of size Lx=50 pixels by Ly=100 pixels and Lx=60 pixels by Ly=160 pixels, respectively. Comparison of the last graph of Figure 8 and Figure 10 yields that there is a higher percentage of linear clusters of size 3 and less of cluster size 2 in a simulation. They all have larger clusters, for example, of sizes 5, 6 and 7 (although size 6 is missing in Figure 8 due to limited simulation time). Average linear cluster length in the last graph in Figure 6(b) and Figure 8 is 3.23 and 3.25, respectively. However, the cluster size 3 is dominant in Figure 8, while it is 2 in Figure 6(b). Comparison yields that simulation with gels with bigger ratio Ly/Lx has bigger average length of the clusters after 600000 MCS. Figure 9 shows the dynamics of the simulation. The length of a linear cluster becomes larger with increasing number of MCS. The size of the random cluster first increases (until 300000 MCS) and then decreases.
Figure 10.
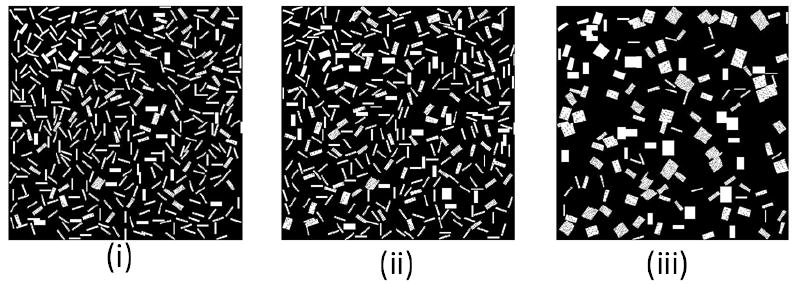
Simulations of cluster self-assembly in an oil-like medium. (i): MCS=5000 (ii):MCS=10000 (iii): MCS=100000. (ε = 1, 1/T=3, Lx=60, Ly=400).
Figure 9.
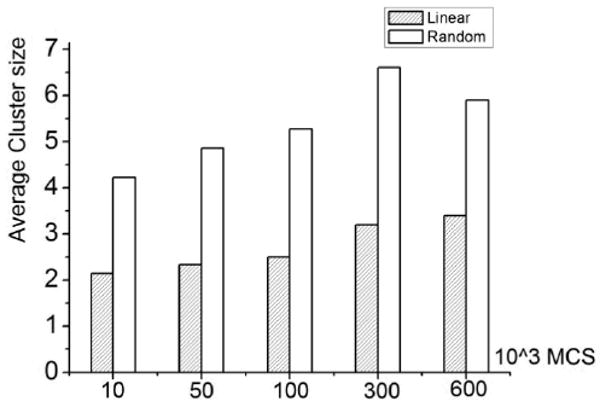
Average cluster size versus number of Monte Carlo Steps (MCS) (ε = 1, 1/T=3, Lx=60, Ly=160).
4.4 Complex hydrogel geometries
The model presented in this paper can be extended to incorporate hydrogels with more complex shapes including lock-key shapes (Figure 12) [1].
Figure 12.

Lock-and-key configurations in the experiment.
Figure 13 demonstrates that one lock can attract different number of keys (from 1 to 4) in a simulation to form different types of self-assembled units. In the experiment, at most three keys were observed to attach to one lock. However, based on the hydrophobic energy minimization, our model predicts that fully loaded lock-key unit (one lock combined with four keys) can also form. Thus, future experiments with modified process conditions might result in such structures confirming the following predictions.
Figure 13.
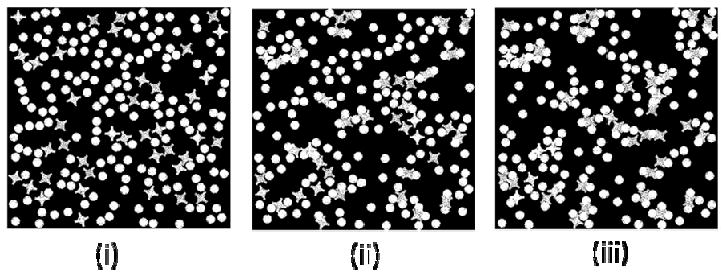
Formation of the lock-and-key clusters in simulations in oil-like medium. (i) MCS=0, (ii) MCS=50000, (iii) MCS=400000. (ε = 1, 1/T=5)
Cluster size in Figure 14 represents the number of keys (round circles) per cluster. Figure 14 demonstrates that given enough time, larger clusters of size 4 are formed. At MCS=400000, more clusters of size 3 and 4 are formed. However, clusters of size 1 and 2 are still dominant.
Figure 14.

Lock and key cluster size distribution in the simulations.
4.5 Different density ratio
We tried different lock and key's density ratio and got the following results. From the simulation results, we could see that in part (a), after long enough Monte Carlo steps, very few clusters were formed. In part(b), we changed the ratio to Lock:Key=2:1, here we found some new clusters, two locks with one key in between. In part (c), larger and longer cluster was formed, in the middle graph of part (b), we could find a cluster which was formed by three locks with two keys among them. In part (d), there are more keys than locks in the simulation, we could find some clusters with one lock occupied with two or more keys. In part (e), more such kind of clusters were formed. After we change the Key:Lock=1:4, in part (e), nearly all locks were occupied by the keys, and locks were always occupied by more than 2 keys.
However, we noticed the difference between two status when the ratio of lock and key bigger or smaller than 1. When the ratio>1, there could form longer clusters, such cluster in part (b). When we changed the ratio, more Locks were occupied by keys, although they could not form longer cluster, but the cluster's shape is more predictive.
5. Summary
A 2D off-lattice Monte Carlo model was developed for simulating hydrogel self-assembly process governed by hydrophobic effects in liquid media. Within this model, the LJ type potential was used to describe the interactions between the hydrogel units and a Metropolis algorithm was applied for simulating hydrogel dynamics. Simulation results agree well with the experimental data for rectangular units. The model was also used for studying self-assembly of hydrogel units with more complex shapes.
Simulation results demonstrated that the computational model is predictive of the experimental results and may be used in future as a powerful tool for optimization of the mesoscale tissue unit self-assembly process. Not only can process conditions (i.e. agitation rate, hydrophobic force and time) be verified in our design but also the shape of the microgels could be modified to generate optimal outcome. In addition, it is possible to extend the model to the 3D case by simple modification of the modeling procedure. The simulation approach will provide theoretical guidance for building 3D tissue constructs mimicking the architectures of the native tissues, which will facilitate future research in the bottom-up tissue engineering.
Figure 11.

Hydrogel chain length distribtuions in simulations (Lx=60,Ly=400).
Figure 15.
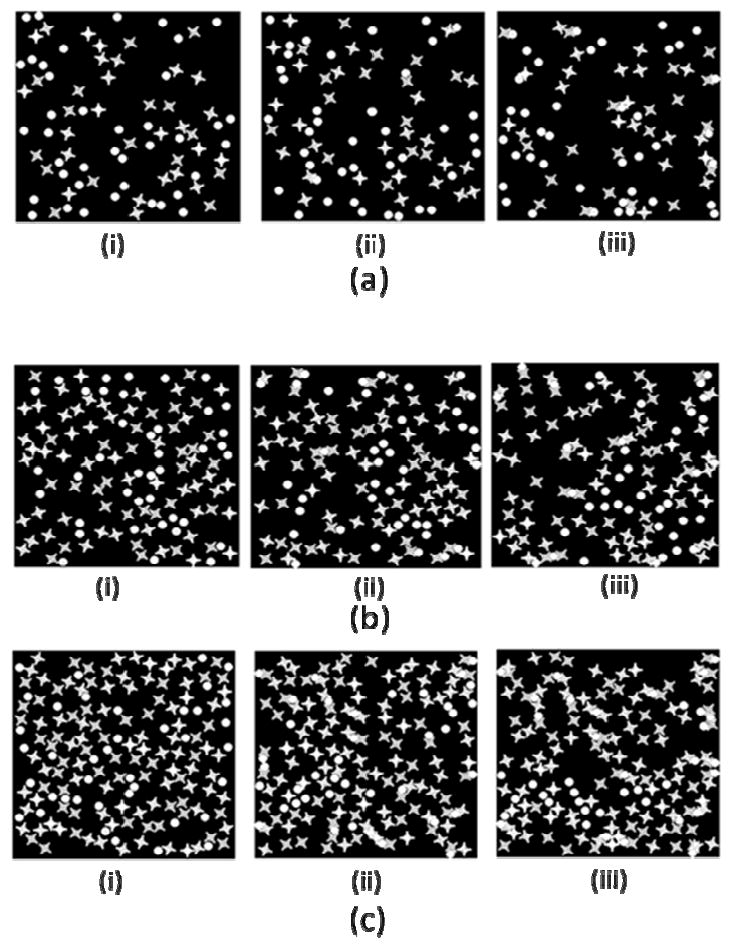
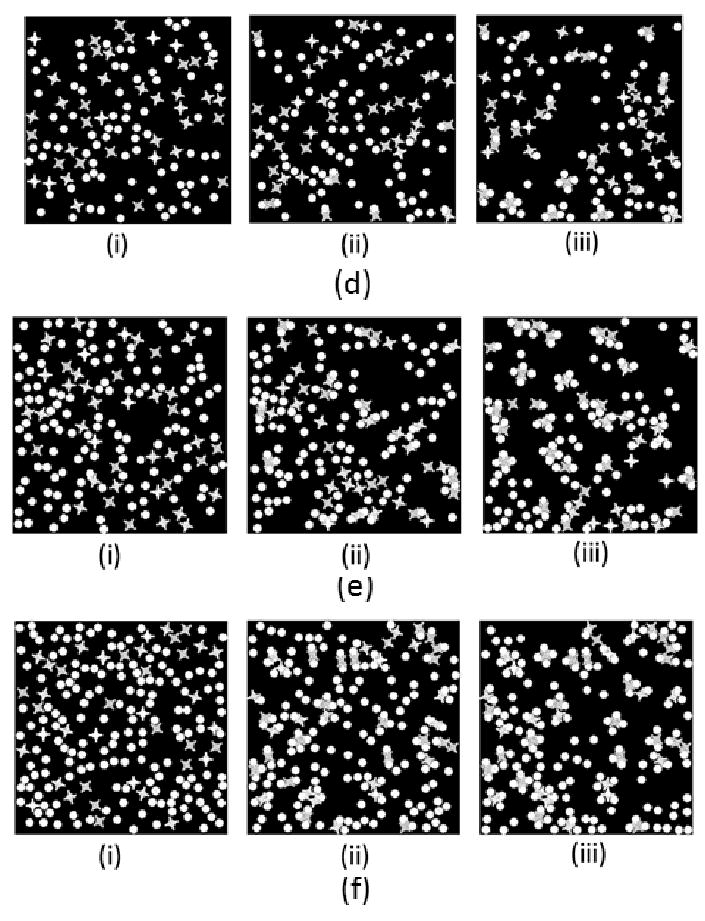
Different density ratio of Lock and Key. (a) 1:1, (b) 2:1, (c) 3:1, (d) 1:2, (e) 1:3, (f) 1:4, (i) MCS=0, (ii) MCS=50000, (iii) MCS=400000.
Figure 16.
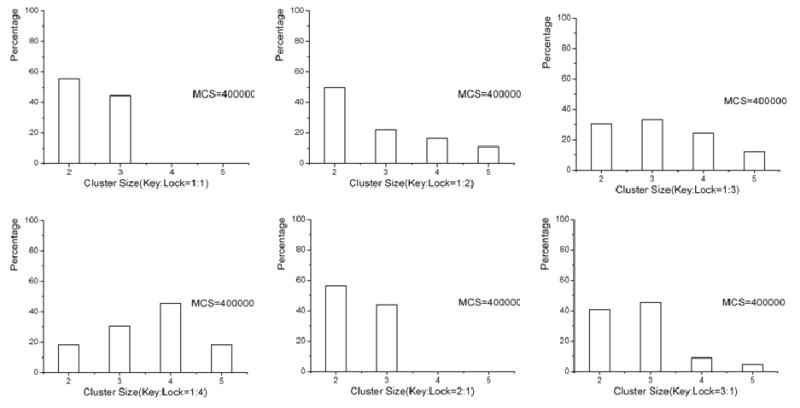
Statistics for MCS=400000 for different density ratio of Lock and Key
Acknowledgments
This work was supported by the National Institutes of Health (#102864), and the Institute for Soldier Nanotechnology for Ali Khademhosseini. Mark Alber and Nan Chen were partially supported by the National Science Foundation grants DMS-0800612 and CCF-0622940.
References
- 1.Du Y, Lo E, Ali S, Khademhosseini A. Proceedings of the National Academy of Sciences of the United States of America. 2008;105:9522–9527. doi: 10.1073/pnas.0801866105. [DOI] [PMC free article] [PubMed] [Google Scholar]
- 2.Khademhosseini A, Langer R, Borenstein J, Vacanti JP. Proceedings of the National Academy of Sciences of the United States of America. 2006;103:2480–2487. doi: 10.1073/pnas.0507681102. [DOI] [PMC free article] [PubMed] [Google Scholar]
- 3.Khademhosseini A, Langer R. Biomaterials. 2007;28:5087–5092. doi: 10.1016/j.biomaterials.2007.07.021. [DOI] [PubMed] [Google Scholar]
- 4.Yeh J, Ling Y, Karp JM, Gantz J, Chandawarkar A, Eng G, Blumling J, 3rd, Langer R, Khademhosseini A. Biomaterials. 2006;27:5391–5398. doi: 10.1016/j.biomaterials.2006.06.005. [DOI] [PubMed] [Google Scholar]
- 5.McGuigan AP, Sefton MV. Proceedings of the National Academy of Sciences of the United States of America. 2006;103:11461–11466. doi: 10.1073/pnas.0602740103. [DOI] [PMC free article] [PubMed] [Google Scholar]
- 6.Liu Tsang V, Chen AA, Cho LM, Jadin KD, Sah RL, DeLong S, West JL, Bhatia SN. Faseb J. 2007;21:790–801. doi: 10.1096/fj.06-7117com. [DOI] [PubMed] [Google Scholar]
- 7.Arieh B. Hydrophobic interactions. Plenum Press; New York: 1980. [Google Scholar]
- 8.Nicholas M, Arianna WR, Marshall NR, Augusta HT, Edward T. The Journal of chemical physics. 1953;21:1087–1092. [Google Scholar]
- 9.Palmer BJ, Liu J. Langmuir. 1996;12:746–753. [Google Scholar]
- 10.Aniket B, Mahanti SD, Amitabha C. The Journal of chemical physics. 1998;108:10281–10293. [Google Scholar]
- 11.Glotzer SC, Solomon MJ, Kotov NA. AIChE Journal. 2004;50:2978–2985. [Google Scholar]
- 12.S MJ, K NA, Glotzer SC. AIChE Journal. 2004;50:2978–2985. [Google Scholar]
- 13.Chandler D. Nature. 2005;437:640–647. doi: 10.1038/nature04162. [DOI] [PubMed] [Google Scholar]
- 14.Cooke IR, Kremer K, Deserno M. Physical review. 2005;72:011506. doi: 10.1103/PhysRevE.72.011506. [DOI] [PubMed] [Google Scholar]
- 15.Newman TJ. Mathematical Biosciences and Engineering. 2005;2:611–622. [Google Scholar]
- 16.Franzesi GT, Ni B, Ling Y, Khademhosseini A. Journal of the American Chemical Society. 2006;128:15064–15065. doi: 10.1021/ja065867x. [DOI] [PubMed] [Google Scholar]
- 17.Wu Y, Jiang Y, Kaiser D, Alber M. PLoS computational biology. 2007;3:e253. doi: 10.1371/journal.pcbi.0030253. [DOI] [PMC free article] [PubMed] [Google Scholar]
- 18.Cressman A, Togashi Y, Mikhailov AS, Kapral R. Physical review. 2008;77:050901. doi: 10.1103/PhysRevE.77.050901. [DOI] [PubMed] [Google Scholar]
- 19.Du Y, Lo E, Vidula MK, Khabiry M, Khademhosseini A. Cellular and Molecular Bioengineering. 2008;1:157–162. doi: 10.1007/s12195-008-0020-z. [DOI] [PMC free article] [PubMed] [Google Scholar]
- 20.Lund M, Jungwirth P, Woodward CE. Physical review letters. 2008;100:258105. doi: 10.1103/PhysRevLett.100.258105. [DOI] [PubMed] [Google Scholar]
- 21.Revalee JD, Laradji M, Sunil Kumar PB. The Journal of chemical physics. 2008;128:035102. doi: 10.1063/1.2825300. [DOI] [PubMed] [Google Scholar]
- 22.Wu Y, Jiang Y, Kaiser D, Alber M. Proceedings of the National Academy of Sciences of the United States of America. 2009;106:1222–1227. doi: 10.1073/pnas.0811662106. [DOI] [PMC free article] [PubMed] [Google Scholar]
- 23.Glotzer GS, Solomon MJ, Kotov NA. AIChE Journal. 2004;50:2978–2985. [Google Scholar]


