

Abstract
Six–coordinated heme groups are involved in a large variety of electron transfer reactions because of their ability to exist in both the ferrous (Fe2+) and ferric (Fe3+) state without any large differences in structure. Our studies on hemes coordinated by two histidines (bis–His) and hemes coordinated by histidine and methionine (His–Met) will be reviewed. In both of these coordination environments, the heme core can exhibit ferric low spin EPR signals with large gmax values (also called type I, highly anisotropic low spin, or highly axial low spin, HALS species) as well as rhombic EPR (type II) signals. In bis–His coordinated hemes rhombic and HALS envelopes are related to the orientation of the His groups with respect to each other such that (i) parallel His planes results in a rhombic signal and (ii) perpendicular His planes results in a HALS signal. Correlation between the structure of the heme and its ligands for heme with His–Met axial ligation and ligand–field parameters, as derived from a large series of cytochrome c variants, show, however, that for such a combination of axial ligandsthere is no clear–cut difference between the large gmax and the “small g–anisotropy” cases as a result of the relative Met–His arrangements. Nonetheless, a new linear correlation links the average shift <δ> of the heme methyl groups with the gmax values.
Keywords: Cytochrome, DFT calculation, EPR, 1H NMR, ligand–field anisotropy
INTRODUCTION
The iron containing heme group is found in nearly all organisms, where it carries out a great diversity of functions.1,2 The ability of the iron to exist in different oxidation states makes it ideal for functions like oxygen transport and storage (myoglobin and hemoglobin), catalysis (e.g. cytochrome P4503, hydroxylamine oxidoreductase4 with 24 hemes) and electron transfer. From the structural perspective, the iron ion in a hemeprotein is always coordinated by four nitrogen atoms provided by a porphyrin ring associated with the protein. Heme proteins involved in catalysis, oxygen transport or storage have an amino acid as one axial ligand to the iron, which is either five-coordinated or has a water molecule at (or close to) the sixth coordination site in the resting state.5–7 Some of these proteins can have a substrate(s) and oxygen/peroxide binding pocket accessible to the heme iron. Heme proteins that perform electron transfer reactions usually have both axial ligands donated by amino acid residues with the exception of some cytochromes c′ that have unknown functions.8,9 The most common biologically relevant axial ligating atoms for iron are nitrogen in histidine (His) residues (possibly lysine) or the polypeptide N–terminal amino group, sulfur in methionine (Met) or cysteine groups, and oxygen in tyrosine. Cytochromes are essential components in all organisms that possess a respiratory chain or a photosynthetic system, in which they act as electron–transfer proteins. Different types of such proteins have been discovered in Nature from the time when McMunn in 1886 described the colored substances in cells,10 addressed later on by Keilin with the term “cytochrome.”11 Cytochromes and heme proteins can be divided into classes according to the heme type (e.g., a, b, c, d, f, and o), heme iron coordination environment (e.g. heme a and a3) and sequence homologies. The iron metal ion in both oxidized (+3) and reduced (+2) states adopts a low–spin configuration (S = ½ and S = 0 respectively) in cytochromes (referring here to heme proteins with electron-transfer function) while in other heme proteins several different spin and redox states are possible. Therefore in cytochromes only the oxidation state of the metal changes, thus minimizing the reorganization energy associated with the electron transfer processes.12 Combination of spectroscopic techniques like electron paramagnetic resonance (EPR, e.g. X–band or HF–EPR, ENDOR, HYSCORE and ESEEM), Mössbauer, X–ray absorption, (resonance) Raman, infra-red, nuclear magnetic resonance (NMR) and magnetic circular dichroism (MCD), complemented by theoretical calculations and structural analyses (X–ray diffraction) aim to relate protein structure, electronic and magnetic properties to the protein function. Especially when structural information is absent, the spectroscopic fingerprints of the heme proteins can be used as blueprints to disclose the nature of heme axial ligands, their mutual orientation and dynamics with respect to the heme core.13 Here we summarize how and to what extent the ferric ligand field anisotropy is modulated in two cytochrome classes, those encompassing coordination with two His residues (bis–His) and those having Met and His (His–Met) as axial ligands. For both of these two types of coordination sets we see low spin ferric (Fe3+) EPR signals with large gmax and/or normal rhombic spectra. The edge of the heme group is often solvent exposed and surrounded by amino acids which are complementary to their partner proteins. The covalent attachment of heme seen in some cytochromes (designed as cytochromes c), guarantees that the heme group is retained in the protein and might help to fix the position.14–16 Note that cytochromes c proteins can have both His–Met and bis–His coordination, e.g. tetra-, hexa- and tetraicosa4 heme proteins can have bis–His iron coordination. Correlation of structures with the observed electronic and magnetic properties of the heme group show that for the bis–His heme proteins, the protein structural architecture, such as the relative orientation of the axial ligands and/or saddled–shaped versus ruffled heme structure, represent the dominating factors responsible for tuning the iron ligand–field. On the contrary, for cytochromes c with Met and His coordinated to heme iron, a clear assessment of the factors that steer the ligand–field strength are still unclear, since even small perturbations in one of the axial ligands (Met) induce alteration of the heme ligand field anisotropy (see for instance recent reviews by Bowman and Bren17 for cytochromes c and Berry and Walker18 for bis–His proteins). Therefore a better understanding how the iron electronic configuration is modulated by the heme surroundings and how much those effects contribute to alter the heme ligand field anisotropy will help to pave the way to uncover the subtilities that govern electronic structure and reactivity in this important class of molecules as well as explain the different origins of the large gmax EPR signals.
LIGAND FIELD ANISOTROPY IN LOW–SPIN HEME IRON
In a low–spin ferric heme system,19 the electronic ground state of the heme core is modulated by the effect of the ligand field acting on the d5 configuration20 of the ferric metal ion. Analyses of the protein molecular structure, when available, in combination with spectroscopic techniques such as electron paramagnetic resonance (EPR), nuclear magnetic resonance (NMR), near–infrared magnetic circular dichroism (NIR–MCD), vibrational/Raman techniques and in some cases with the aid of Mössbauer analyses, in fact demonstrate that ferric low–spin (S = ½) cytochromes exhibit different energy distribution of the dyz, dxz dxy orbitals, as shown in Figure 1. This spin–system has been addressed in the literature by using several different nomenclatures, e.g. the configuration with five electrons in the three t2g orbitals is called the 3–orbitals 1–hole system or (dxy)2(dxz,dyz)3 system. Here in Figure 1, the single unpaired electron is typically present in the dyz21 orbital (or dxz, depending on the orientation of the axial ligands) and the variation in energies among the t2g orbitals is expressed in terms of crystal field parameters, rhombic (V) and axial (Δ), according to the formalism introduced by Griffith22 and developed by Taylor.23 Therefore, depending on the strength of the rhombic versus axial field (V/Δ), the heme core can experience the whole spectrum of intermediate axial versus rhombic strained configurations, as shown in Figure 2 and Figure 3 for a set of representative EPR envelopes recorded for His–His and His–Met cytochrome proteins. Under the assumption that the following limiting conditions hold, V → 0 for a completely axial system, and V/Δ = 0.67 for a pure rhombic system,24 the difference in the ligand–field strengths between axial ligands and N–porphyrin ligands induces the splitting in energy of the three t2g orbitals (dyx, dxz and dyz) such that the S= ½ wavefunctions (|+ >, | − >) are described as admixture of the former three t2g orbitals through the spin–orbit coupling factor (ξ). The wavefunctions for the Kramer’s doublet are given by Eq. (1) and (2), where a, b and c are orbital coefficients:
| (1) |
| (2) |
FIGURE 1.
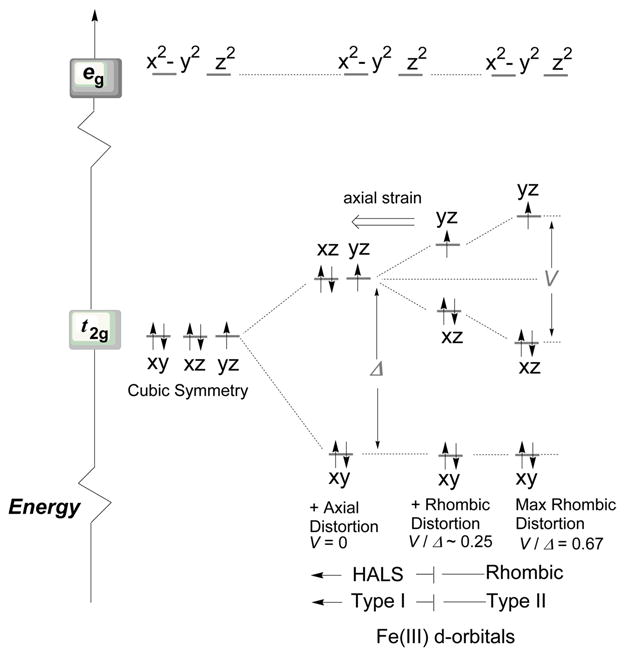
Energy diagram of the d–orbitals level for low–spin ferric ion with (dxy)2(dxz)2(dyz)1 orbital occupancy. Note that the iron eg orbitals are occupied when high spin and intermediate (e.g. S = 3/2) spin states are present in the system. Only type I and type II heme ground–state spin configurations are shown. Note that when the dxz orbital is higher in energy with respect to dyz, the system is represented in a similar manner ((dxy)2 (dyz)2 (dxz)1 orbital occupancy). The orbital coefficient a in the Taylor’s wavefunctions expressed by Eq. 3 (see text) is associated in such a case to the dxz orbital, b to the dyz and c to the dxy. The type III spin configuration, where the dxy orbital is higher in energy than dxz and dyz and with the ground–state spin configuration (dxz, dyz)4(dxy)1, has been omitted in the drawing. Similar figure has been drawn in Reference 36 and 52.
FIGURE 2.
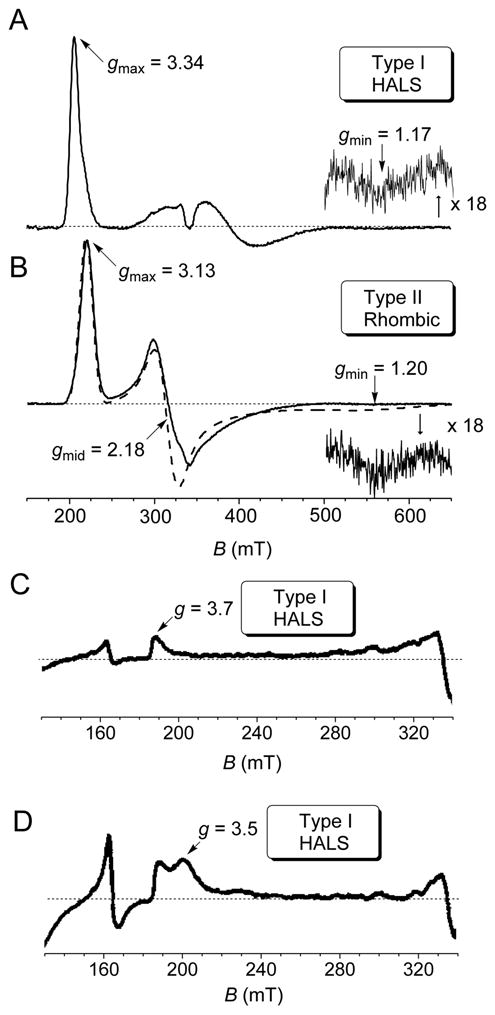
Prototypical EPR spectra, recorded at cryogenic temperature (T = 10 K). (A) HALS or type I species; Nitrosomonas europaea (Ne) cytochrome c–552. (B) Rhombic or type II species; N. europaea N64Δ mutant cytochrome. The dashed–line in panel B represents the spectrum simulation with g–tensor parameters given in the drawing. (C) Oxidized isolated Bacillus subtilis heme A synthase containing mainly heme b. (D) Oxidized isolated B. subtilis heme A synthase containing heme a and heme b.
FIGURE 3.
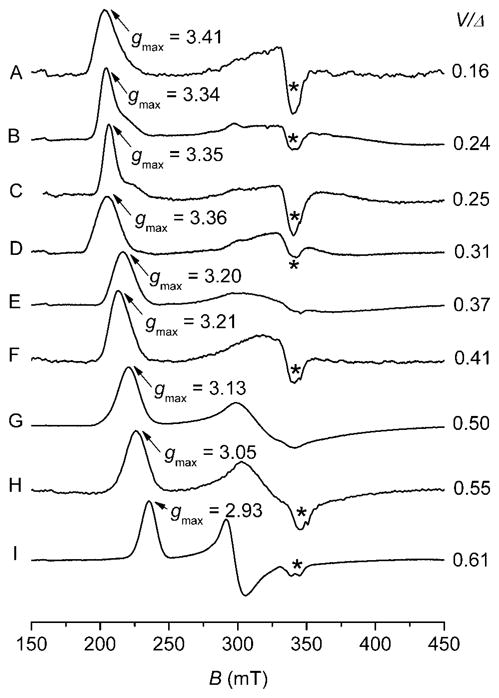
The X band (~ 9.66 GHz) EPR cytochrome c spectra recorded at T = 10 K of (A) Methylosinus trichosporium OB3b c–554, (B) Nitrosomonas europaea c–552, (C) N. europaea mutant V65Δ, (D) Bacillus pasteurii c–553, (E) Pseudomonas aeruginosa c–551, (F) P. aeruginosa mutant N64Q, (G) N. europaea mutant N64Δ, (H) P. aeruginosa mutant N64V, (I) Methylococcus capsulatus Bath c–555. The symbol Δ, included in the mutant labels, indicates deletion of an aminoacid. Note that the spectrum (H) is almost identical to that featured by Horse heart cytochrome c at neutral pH. The protein solutions were prepared in HEPES Buffer (50 mM, pH 7.5) and spectra recorded at T = 10 K, microwave power 1.0 mW, modulation amplitude 0.75 mT, modulation frequency 100 KHz, 55 dB gain, sweep time 168 sec, time constant 82.92 msec; 4–6 scans were accumulated and averaged. The asterisk (*) indicates Cu2+ signal as impurity. The symbolΔ indicates the axial term and V the rhombic term according to Griffith and Taylor’s formalism.
According to Taylor’s treatment, equations (1) and (2) are valid as long as the remaining two empty eg orbitals (|dx2–y 2> and |dz2>) lie sufficiently high in energy such that their contributions can be neglected. The g–tensor values experimentally found are then correlated with the mixing coefficients a, b and c through the following expressions:
| (3) |
Rearranged into:
In particular, the sum of the squared coefficients (a, b, c) is strictly equal to “one” only when the pure ionic (no covalency) orbital character is considered. This is known as the normalization condition. The g–tensor values are related to each other through Eq. (4):
| (4) |
when the normalization condition holds. The crystal field parameters V/ξ and Δ/ξ are then calculated from the g–tensor values according to Eq. (5) and (6):
| (5) |
| (6) |
where V represents the energy difference between the dxz and dyz orbitals, Δ the difference between the dxy and the averaged energy of the dxz and dyz orbitals and ξ the spin orbit coupling constant (~ 400 cm−1).25,26 The knowledge of all three g values is necessary in order to determine V/ξ and Δ/ξ. However, in many cases experimental observation of the gx (or gmin) component is difficult, because it falls at high field and is usually broad and weak. Therefore Eq. (4) can be used to calculate gx when gz (gmax) and gy (gmid) are known. Another relationship similar to Eq. (4) shows that the sum (gx)2+ (gy)2 + (gz)2 = 16 holds in many cases, but especially when gmax is large it might not be true, as discussed by Gadsby and Thomson.27 The complication concealed in Eq. (4) stems from the fact that the EPR measurements can provide only the magnitude but not the g–tensor signs.24,28 Two different solutions in term of crystal field parameters can be obtained, which correspond to a very different unpaired electron distribution. However, one constraint is to consider that the sum [gz + gy − gx] needs to be positive,23 and this additional condition limits the number of possible choices of signs for the g–tensor. Huynh and coworkers29 demonstrated that the product of the three principal g–tensor values was positive in the case of cytochrome c2 from Rhodospirillum rubrum through Mössbauer analyses. We have also determined the same positive g–tensor product in the cytochrome Nitrosomonas europaea c–552, which exhibits large gmax value, through Mössbauer spectroscopy.30 Therefore it is probable that for similar cytochromes this constitutes a “general case.” Eq. (4) fails when residual contributions from higher excited states are not negligible such as in the high temperature regime, or when the systems shift from a fairly pure (dxy)2(dxz)2(dyz)1 (or (dxy)2(dyz)2(dxz)1) ground state to a fairly pure (dxz)2(dyz)2(dxy)1 ground state,31–34 or finally in the absence of efficient spin–orbit ξ mixing among the t2g orbitals. It is worth noticing that from Eq. (3) the following special cases36 can be derived:
The unpaired electron is confined exclusively on dyz, then a = 1, b = c = 0 (i.e. (dxz, dxy)4 (dyz)1) thus gx = gy = gz = 2. Similarly, note that when the unpaired electron is confined exclusively on the dxz orbital, the largest coefficient (a) is associated to this orbital, b to the dyz and c to dxy. The g–tensor values will not change, gx = gy = gz = 2 and the ground–state is expressed as (dyz, dxy)4 (dxz)1.
The unpaired electron is shared equally by dyz, dxz, dxy such that (dyz, dxz, dxy)5, thus a = b = c = c √0.33, and gx = gy = gz = 2.
The limit of pure axial symmetry, where the contribution of dzy and dxz are equal (a2 ≡ b2, V = 0) corresponds to the (dxz)2(dyz,dxy)3 configuration. Here gz is defined solely by the coefficient a which is in turn controlled by Δ. WhenΔ approaches infinity then a2 → 0.5, c2 → 0 and gz → 4 while gy and gx → 0. However, this limiting condition has never been found experimentally;28 in fact |Δ|, in all low–spin Fe3+ heme protein known to date, it is always much lower than 10ζ, gmax ≤ 3.8, thus a2 is smaller than 0.5 and gmid and gmin becomes finite.
APPLICATION OF EPR SPECTROSCOPY TO THE ANALYSES OF LOW–SPIN HEME IRON
Blumberg and Peisach in the early 1970s13,35 carried out EPR analyses on a large number of ferric low–spin heme centers, demonstrating that this technique can be successfully employed to classify low–spin Fe3+ heme in terms of axial ligands bound to the heme core through analyses of their crystal–field parameters. The authors noted that the ligand–field data clustered into domains called C, H, B and O, defined by the ratio of the rhombic to axial component (V/Δ, ordinate axes) versus the axial field strength (Δ, abscissa axes). Here the heme centers include histidine as proximal ligand for the iron but vary in that the distal coordinating ligand-group is methionine (C, with ~ 2 < Δ/ξ < 2.5), neutral histidine (H, ~ 3.5 < Δ/ξ < 4.5), anionic histidine (B, ~ 2.8 < Δ/ξ < 3.3) or hydroxide/oxide (O, ~ 4.4 < Δ/ξ < 6.4). In the fifth domain (P, ~ 6.0 Δ/ξ), they included the class of cytochrome P450 heme enzymes having combination of cysteine–water as axial ligands for the heme core. The Blumberg and Peisach correlation, known in literature as “truth diagram”, has been extensively used to predict the nature of the axial ligands to the heme core in poorly characterized low-spin heme centers. However the particular form of the diagram, that used unconventional assignment of the experimentally measured g–values (gx = gmid, gy = −gmax, gz = gmin), showed many limitations; in fact the correlation only works well for V/Δ ratios that are quite large, but for some cytochromes it exceeds the theoretical upper limit of 0.67.36 Furthermore, the finding that a number of cytochromes with His–Met axial ligation exhibiting HALS EPR and other proteins with HALS EPR signals do not fit in the Blumberg and Peisach scheme, points to the poor understanding of the factors that control details of electronic structure in His–Met cytochromes. Experimentally, by looking at the set of EPR g–resonances observed in several low spin cytochomes, such as those shown for example in Figure 2 and Figure 3, two prototypical envelopes emerge that mirror the two usually encountered ground state configurations for the low–spin Fe3+ ion, as described bythe Griffithand Taylor’s formalism. Type I heme (Figure 2A, C and D and Figure 3A–D), according to the nomenclature introduced by Walker,28 are characterized by near degeneracy between dxz and dyz orbitals, with an energy difference ΔE (with ΔE = E(dyz) − E(dxz)) smaller than the spin–orbit coupling constant (ξ). In this scenario, the EPR spectrum exhibits large g– anisotropy, with gmax > 3.3 and gmid, gmin rather small and broad.37–39 Here the rhombic parameter V is small (e.g. ~1.0 ξ in cytochrome c with His–Met axial ligands, 0.28 ξ in the myoglobin–cyanide complex).27,28 Type I heme are also referred in literature to as highly anisotropic low spin heme40,41 or highly axial low spin heme (HALS).39 In these systems the EPR envelopes are typically observed only at cryogenic temperatures (< 30 K). In addition the gmax resonance line can be described as either a Gaussian–like line (e.g. Figure 3D) or as highly asymmetric (e.g. Figure 2A and 2C), as observed in many membrane bound proteins with bis–His iron coordination such as the heme b EPR spectrum with gmax at 3.7 (Figure 2C) which is very similar to the heme bL from complex III in mitochondria.42 The true origin of the different line–shapes along the gmax resonance in Type I heme is still matter of controversy; in fact the line shape–asymmetry has been interpreted either due to the presence of multiple components by de Vries and Albracht37 or arising from g–strain effects that are regarded as micro–heterogeneities in the protein conformation occurring upon freezing by Salerno.39 Type I heme EPR spectra have been observed in several different classes of cytochromes. These include membrane bound b–type proteins (bis-His axial iron ligands), such as the two hemes of cytochrome b558 (in succinate dehydrogenase, succinate:quinone reductase) from Bacillus subtilis,43,44 analogous to Complex II of the bovine mitochondrial respiratory chain (see below), cytochrome b562 and b566 in Complex III of the bovine mitochondrial respiratory chain (complex bc1),45,46 and in one of the three hemes from the cytochrome bf complex.47,48 HALS EPR signals are also observed in the myoglobin His64→Val/Val68→His double mutant protein,49 in horse cytochrome c–cyanide complex,27 cytochrome c peroxidase from Nitrosomonas europaea (His and Met)50 and cytochrome c–553 from Bacillus pasteurii (His and Met) (Figure 3D).30 A similar envelope is observed in cytochrome c–552 from Nitrosomonas europaea 51 (His and Met) (Figure 2A and Figure 3B), in some of its mutants such as NeV65Δ (Figure 3C) and NeG50N/V65Δ (Δ indicates the amino acid deletion, spectrum not shown)52 and in cytochrome c–554 from Methylosinus trichosporium OB3b (Figure 3A)53,54 and in several synthetic-heme complexes.21,24 When a large energy difference ΔE between the dxz and dyz orbitals is present, up to three times ξ (between 600–1200 cm−1),26 all three g values (gmax, gmid and gmin) can be resolved in the spectrum which are characterized by smaller g–anisotropy (gmax < 3.2). Furthermore the EPR resonance line can be observed at higher temperatures as compared to type I heme, sometimes up to liquid nitrogen temperature, especially with proteins containing thiolate axial coordination. In this case the heme is called type II or rhombic (Figure 2B) and the ratio V/Δ approaches the theoretical limiting value 0.67, as experimentally observed in the Metylococcus capsulatus (Bath) cytochrome c–555 (Figure 3I).53,54,55
DETERMINATION OF AXIAL LIGANDS IN HEME–PROTEINS THAT EXHIBITS HALS SIGNAL. EXAMPLES OF BIS–HIS LIGANDS
An observed ferric low spin large gmax/HALS/type EPR spectrum for an otherwise little characterized heme protein does not provide much information on the nature of the two axial ligands to the heme iron atom. For example, at the time when little molecular data was available for the cytochrome b–558 subunit of Bacillus subtilis succinate:menaquinone reductase, we described large gmax–type low spin EPR signals from the two b–hemes.44 The broadness of the signals with gmax at 3.38 and 3.46 for the respective hemes (Table 1) makes them difficult to detect compared to heme signals with gmax around 3.0 and usually only the gmax can be observed.44,56 In addition, quantification of HALS/type I Fe(3+) heme is also complicated in some cases, as shown for example by the cytochrome b6f complex where one of the heme groups was “missed” and which could be identified only after the 3D structure became known and the heme–heme interacting pair could be observed through integer spin EPR detection technique.48 One useful spectroscopic approach to retrieve information about possible axial ligands to heme iron is to combine EPR with near–infrared magnetic circular dichroism (NIR–MCD) at low temperatures. Different combinations of axial heme ligands give characteristic near NIR–MCD spectra.27 The two hemes in the B. subtilis cytochrome b-558 showed at 4.2 K and 5 Tesla an intense NIR–MCD charge transfer band at 1600 nm43 typical of bis–His ligation and near perpendicular orientation of the imidazole planes. Membrane–bound succinate:fumarate oxidoreductases, i.e., succinate:quinone reductases (SQRs) and fumarate:quinol reductases QFRs), in different organisms are rather unique among respiratory proteins in that the membrane–extrinsic part is very conserved in amino acid sequence, prosthetic group composition and three–dimensional structure whereas the membrane–intrinsic part shows extensive diversity.57 The membrane–extrinsic part harbors the enzyme dicarboxylic acid binding active site and consists of a flavoprotein and an iron–sulfur protein. The membrane intrinsic part functions to anchor the extrinsic part to the membrane and is important for quinone oxidation/reduction. It consists of one or two polypeptides with 5 or 6 transmembrane segments and contains one or two low spin hemes or lacks heme. For example, E. coli SQR and QFR both have two anchor polypeptides with 3 transmembrane segments each but only SQR contains heme (Table 1). Mammalian, avian and yeast mitochondrial SQR are similar to E. coli SQR. B. subtilis SQR and Wolinella succinogenes QFR contain one polypeptide with 5 transmembrane segments and two heme b groups. Comparative studies indicate that the anchor parts of all SQRs and QFRs are homologous, i.e. that they have evolved from a two polypeptide primordial variant containing two hemes.58 Based on a combined use of redox–coupled spectroscopic analysis (light absorption, EPR and NIR–MCD), well defined mutant variants, and the identification of invariant residues by multiple amino acid sequence comparisons, a three–dimensional model structure of the membrane–integral part of B. subtilis SQR was elucidated.59 Identification of the His residues acting as the axial ligands to the respective heme and the distribution of these four residues on four different transmembrane segments served as keys in the formulation of the model. Three–dimensional crystal structures are now available for several SQRs and QFRs from different organisms. The structural data demonstrate bis–His axial ligation of heme iron in all cases where heme is present (Figure 4 panel C shows avian SQR) and confirm the arrangement of heme within a four–helix bundle as originally proposed in the model. As in most other cytochromes, the N(3) atom of the imidazole ring binds the iron atom. The structures also confirm near perpendicular orientation of the planes of the two ligating imidazole groups as originally indicated by EPR combined with low temperature NIR–MCD spectroscopy. The mode of binding of menaquinone to diheme SQR or QFR and the mechanism of menaquinone reduction/oxidation by these enzymes have not been elucidated. For the B. subtilis SQR, menaquinone is thought to be reduced in proximity to the distal heme (bD) group located close to the outer side of the cytoplasmic membrane. Electron transfer from the proximal heme (bP), which has a high midpoint redox potential and is located close to the membrane–extrinsic part of the enzyme on the inner (cytoplasmic) side of the membrane, to heme bD (which has a low mid–point potential) is believed to be driven by the transmembrane electrochemical potential.60–62 2–n–heptyl–4–hydroxyquinoline–N–oxide (HQNO) is a mena–semiquinone analogue that binds to the membrane part of B. subtilis SQR and inhibits menaquinone reduction.63 Binding of HQNO shifts the gmax in the EPR spectrum of heme bD and also causes a negative shift in the redox potential of that heme.62 Residues His28 and His113 ligate heme bD.59,64 Experimental results from studies with His28 and His113 single substitution mutants and pseudo–revertants obtained with these mutants show that a Met residue at position 113 is functional, probably as the result of His–Met axial ligation of heme bD in the mutant.62 An increased midpoint redox potential of heme bD in that mutant compared to wild type is consistent with a change from bis–His to His–Met axial ligation.62 The His113Met variant reduces menaquinone and binds HQNO. The properties of heme in the His28Leu variant are seemingly not affected by HQNO and pseudo–revertants could not be found by selection indicating that a His28Met enzyme variant does not assemble properly or is enzymatically inactive. Similar to B. subtilis SQR, the membrane integral part of E. coli formate dehydrogenase–N (FDH–N) contains two hemes b with bis–His axial ligation. In the crystal structure of FDH–N one molecule of added HQNO was found close to one of the axial ligands (His169) of the distal heme.65 The porphyrin ring of the heme was seen in van der Waals contact with the hydroxyquinoline N–oxide ring and the N–oxide group of HQNO (corresponding to O1 of menaquinone) accept a hydrogen bond to the N(1) atom of the imidazole group His169. In analogy, it is possible that N(1) of the imidazole group of residue His28 in the membrane–intrinsic polypeptide of B. subtilis SQR via a hydrogen bond directly ligates menaquinone (and HQNO) while the N(3) atom ligates the heme bD iron atom. This would explain why functional His28Met pseudo–revertants could not be found; the sulphur atom of the Met binds to heme iron and cannot properly ligate menaquinone which renders the enzyme inactive.
TABLE 1.
Properties of heme in succinate:quinone oxidoreductases from various organisms.
| Enzyme | No of polypeptides in membrane anchor1 | No of hemes | Mid-point potential (mV) | EPR spectrum; gmax | NIR– MCD peak (nm) | Reference |
|---|---|---|---|---|---|---|
| B. subtilis SQR | 1 (5 TM) | 2 |
bP; +65 bD; −95 |
3.68 3.42 |
1600 | 43,56 |
| W. succinogenes QFR | 1 (5 TM) | 2 |
bH; +20 bL; −200 |
111 | ||
| Bovine heart SQR | 2 (3 TM each) | 1 | −185 | 3.46 | 1600 | 112,113 |
| E. coli SQR | 2 (3 TM each) | 1 | +36 | 3.63 | 1600 | 114,115 |
| E. coli QFR | 2 (3 TM each) | 0 |
TM indicates transmembrane segments
FIGURE 4.
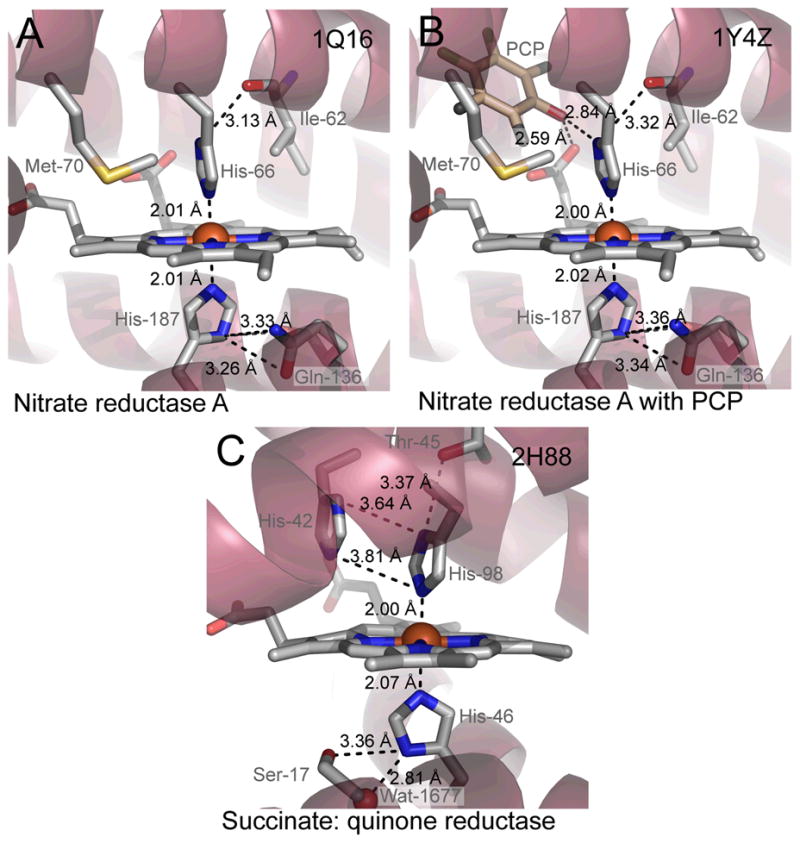
Crystal structures of two bis–His heme proteins. Shown is the heme region with key residues and distances for (A) nitrate reductase A from E. coli (resolution 1.9 Å, PDB code 1Q16)99, (B) nitrate reductase A from E. coli with pentachlorophenol (PCP) bound (resolution 2.0 Å, PDB code 1Y4Z)66 and (C) Succinate:quinone reductase from chicken (resolution 1.74 Å, PDB code 2H88)100. The figures were made with PyMOL101.
Another example involving a quinol model hydrogen-bonding to SQR and FDH–N, analogous to the N(1), is illustrated in the drawings reported in Figure 4A and 4B, which show the effects induced by the presence of the inhibitor pentachlorophenol (PCP).66 One possible role of some of the membrane–bound HALS–containing proteins that reacts with a quinone/quinol pair could be that the perpendicular His configuration could facilitate reactions with the quinone/quinol residue. In fact, the HALS signal increases (gmax shifts from 3.35 to 3.45 or 3.50) upon binding a quinol analogue PCP or the natural quinol, in Escherichia coli nitrate reductase A.66 In order to examine if such changes arise from significant perturbation of the electronic configuration of the heme or axial ligand core, we have used density functional theory (DFT) calculations7 based on the known crystal structure of E. coli nitrate reductase A (Table 2 and Figure 5). However, as Figure 5 shows, we could not observe any significant differences in the unpaired spin density distribution within the heme core with or without inhibitor (PCP) or phenol (Table 2) groups.
TABLE 2.
Effect of addition of phenol or inhibitor pentachlorophenol (PCP) mimicking quinol binding to bis–His membrane-bound heme through DFT models (Crystal structure was taken from PDB code 1Y4Z66), with single point calculation (SP) and after geometry optimisations (Opt). The DFT calculations were performed at the BP86 level107,108 with the def2–SV(P) basis sets109 and using the Turbomole 5.9 software package110.
| Fe–N distances | Spin density | ||||||||||
|---|---|---|---|---|---|---|---|---|---|---|---|
| No ligand | NE1 | NE2 | NP1 | NP2 | NP3 | NP4 | Fe | Im1 | Im2 | Por | Phe |
| SP | 2.00 | 2.02 | 1.99 | 2.02 | 2.10 | 2.01 | 1.03 | −0.01 | −0.01 | 0.01 | |
| Opt | 2.00 | 1.99 | 1.99 | 2.01 | 2.00 | 2.01 | 1.00 | −0.02 | −0.01 | 0.08 | |
| +Phenol SP | 2.00 | 2.02 | 1.99 | 2.02 | 2.10 | 2.01 | 1.03 | −0.01 | −0.01 | 0.01 | 0.00 |
| +Phenol Opt | 1.98 | 2.01 | 2.01 | 2.00 | 2.01 | 2.01 | 1.01 | −0.01 | −0.02 | 0.08 | 0.00 |
| +PCP SP | 2.00 | 2.02 | 1.99 | 2.02 | 2.10 | 2.01 | 0.93 | −0.01 | −0.02 | 0.02 | 0.11 |
| +PCP Opt | 1.99 | 1.99 | 1.99 | 2.02 | 2.00 | 2.02 | 0.99 | −0.01 | −0.01 | 0.03 | 0.00 |
FIGURE 5.
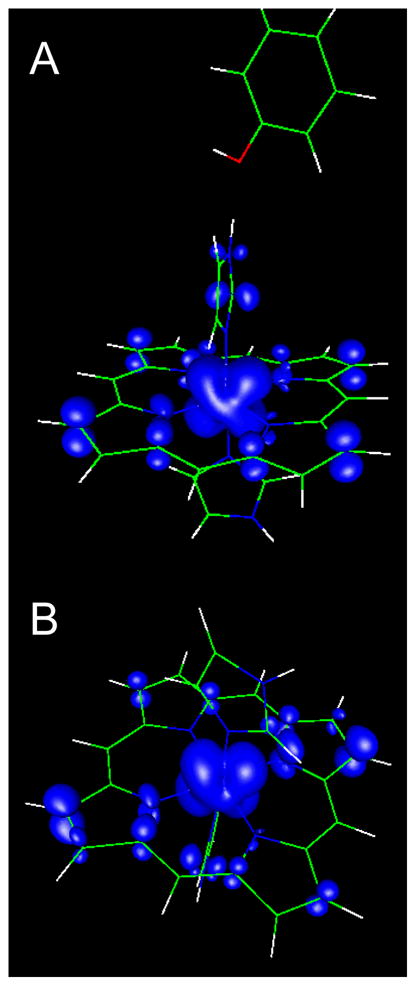
DFT calculation on a bis–His heme model with HALS EPR signal in the presence of phenol (A) and absence of phenol (B) (analog for quinol in the binding site) hydrogen bonded to His–N(1). The figures demonstrate that there is no unpaired spin density on the phenol. (Model based on the structure with PDB code 1Y4Z66.)
LIGAND FIELD ANISOTROPY IN HEME A SYNTHASE
Heme a synthase (HAS) is so far the only example of a protein with a ferric low-spin large gmax/HALS/type signal at gmax = 3.5 (Figure 2D) from ligated heme a.67 Heme a differs from heme b in that there is a hydroxylethyl–prenyl side group at position 2 of the porphyrin ring and a formyl group at position 8. As a prosthetic group, heme a is only found in terminal respiratory enzymes that reduce molecular oxygen to water, i.e. in a–type cytochromes. HAS catalyses the conversion of the methyl side group of heme o into a formyl group yielding heme a.68 This reaction is formally an oxygenation and dehydrogenation reaction which on the enzyme is believed to occur in three steps; two sequential monooxygenations resulting in a vicinal dihydroxy intermediate that in the third step spontaneously is dehydrated to form heme a.69,70 B. subtilis heme a synthase (CtaA) purified from recombinant E. coli or overproduced in B. subtilis cells contains heme b and different (depending on production strain) amounts of heme a.67 HAS of Aeropyrum pernix (a hyperthermophilic bacterium) produced in E. coli also contains heme b and a.71 The bound heme a is an enzyme product that has not been released from the enzyme due to lack of accepting proteins, i.e., apo–cytochrome a polypeptides. Heme b in HAS either functions as a prosthetic group or is an artifact caused by the experimental systems where in all cases the protein is overproduced. Heme a and heme b in HAS show HALS-type EPR signals, with gmax at 3.5 and 3.7, respectively.67 HAS is an integral membrane protein with several invariant His residues distributed on different transmembrane segments. Three of these residues (His60, His123 and His216 in B. subtilis CtaA) are important for activity as determined from studies with mutant protein variants.70,72 Based on available data it is thought that heme b and heme a in HAS have bis–His ligation, but this hypothesis needs to be supported by low temperature NIR MCD and ultimately crystal or NMR structural analysis.
BIS–HIS VERSUS MET–HIS HEME COORDINATIONATION. HOW STRUCTURAL FACTORS MODULATE THE HEME ELECTRONIC PROPERTIES
The correlations between EPR axial strain and axial ligand arrangements have been extensively investigated and well rationalized over the years for b–type cytochromes with bis–His heme axial ligation as well as for several of their mimicking complexes.21,28 In this type of heme center, HALS–type EPR spectra arise as a result of the mutual perpendicular orientation of the axial imidazole ligands (intra–ligand plane angle ~70°–90°) which induces a small rhombic distortion V/ξ. Hemes with an angle between two axial imidazole planes of less than 70° display rhombic EPR spectra.21 Furthermore, correlation of the protein structure and/or synthetic model molecular structures with the observed electronic properties of the heme group shows that also other aspects contribute to modulating the ligand–field strength. Those can be summarized as following: (i) the presence of strong axial ligands (strong σ–donors and weak π–acceptors) combined with (ii) a highly saddled–shaped heme plane, and/or (iii) electron withdrawing groups attached at the meso positions of the porphyrin cause the heme configuration to be stabilized towards the axial (dxy)2(dxz, dyz)3 state. In cytochromes c when Met and His are the fifth and sixth ligands for the heme iron, assessment of the leading factors that steer the ligand–field strength is unfortunately not so clear. A thorough analysis of those factors will provide crucial information for better understanding the correlation between structure/electronic properties/function of the membrane bound cytochrome c1 in the mitochondrial complex III, as well as many small and multiheme soluble proteins.39,42,73 EPR alone54 in many cases does not demonstrate presence of His–Met iron coordination and one must use other methods in combination for His–Met coordination characterization. For example, the bis-His NIR–MCD peak at 1600 nm is typical of near perpendicular orientation of the His planes, whereas the N. europaea c–552 with His–Met coordination features an intense NIR–MCD charge–transfer band at 1800 nm.51 NIR–MCD can also detect other combinations31 of axial ligands, including unusual ones like bis–Met (band at 2200 nm.) Met coordination to ferric hemes shows as a fingerprint a typical weak optical and CD/MCD band around 690–710 nm.51,54 Iron coordination with sulphur has larger involvement of covalent binding, therefore Mössbauer spectroscopy in combination with EPR analyses can be used to clearly asses the g–tensor and A–tensor parameters, as we earlier determined in N. europaea c–552.30
Figures 6 and 7 show structures of small bacterial His–Met coordinated cytochromes c, of which EPR spectra are discussed in this review. Figure 7 in particular shows the location of mutations in N. europaea c–552 and P. aeruginosa c–551 with corresponding EPR spectra illustrated in Figure 3. From a structural perspective, the small soluble mitochondrial cytochromes c have an intra–ligand angle (measured as the angle between the π nodal planes of the His and Met) of ~48° and display rhombic EPR spectra (gmax ~ 3.1 and V/Δ = 0.58).74 P. aeruginosa c–551, with an intra–ligand angle of ~54°, has a relatively more axial EPR spectrum with gmax of 3.2 and V/Δ = 0.37 (Figure 3E).27 However, the axial His and Met orientations for Bacillus pasteurii cytochrome c–553 are similar to those of the soluble mitochondrial cytochromes c (with an intra ligand angle of ~ 48°),75 but the protein exhibits a large gmax of 3.36 and V/Δ = 0.31 (Figure 3D).30 It thus appears that other factors (such as planarity of the heme core, dynamics of axial ligands, and interactions with axial ligands) contribute to tune the ligand field in a complicated manner. To assess the mutual orientation (and, in selected cases, dynamics) of the axial groups and their impact on heme ligand–field anisotropy, paramagnetic NMR serves as an essential complement to EPR spectroscopy. This technique gives direct information on the spin density distribution (ρiπ) residing on the porphyrin core and on the magnetic susceptibility anisotropy (Δχ) of the system and its axial (Δχax) and rhombic (Δχrh) components (vide infra).76–79 The heme group in ferricytochromes c (S = 1/2) displays an asymmetric allocation of the unpaired electron spin density among the heme pyrrole β–substituents,80 and this asymmetry can be associated with the orientations of the heme axial ligands, which, in the case of the proteins discussed in detail here, are His and Met. Unfortunately, in spite of the large amount of information gained through such analyses, a direct relationship between the magnitudes of axial and rhombic distortions (and thus the EPR g–values) versus relative configuration of His/Met ligand and Met dynamics has not been found. Furthermore, from EPR and Mössbauer studies carried out previously on N. europaea cytochrome c–552 and B. pasteurii cytochrome c–553 a pH-dependent conversion between type I and type II EPR species can additionally be present in the systems, rendering their analyses even more complex.30
FIGURE 6.

Four crystal structures (X–ray diffraction) and one NMR structure of His–Met c-type cytochromes with rhombic, weak HALS and HALS EPR signals. The heme regions with key residues and distances are shown. (A) and (B), cytochrome c from horse heart (resolution 1.9 Å, PDB code 1HRC)102, (C) cytochrome c–551 from Pseudomonas aeruginosa (resolution 1.6 Å, PDB code 351C)103, (D) cytochrome c–552 from Hydrogenobacter thermophilus (resolution 2.0 Å, PDB code 1YNR)104, (E) cytochrome c–553 from Bacillus pasteurii (resolution 0.97 Å, PDB code 1C75)75, (F) cytochrome c–552 from Nitrosomonas europaea (NMR structure, PDB code 1A56)105. The figures were made with PyMOL101.
FIGURE 7.

Structures of Nitrosomonas europaea c–552 (A) 105 and Pseudomonas aeruginosa c–551 (B) 104. Mutated and deleted residues are highlighted. The numbering (one–letter code) for N. europaea has been adjusted to the numbering of P. aeruginosa so Gly-50, Met-61, Asn-64 and Val-65 correspond to Gly–48, Met–59, Asn–62 and Val–63 in the PDB file. The figures were made with PyMOL101.
1H NMR ANALYSES OF CYTOCHROME C PROTEINS WHEN HIS–MET ACT AS AXIAL LIGANDS TO THE HEME IRON
The oxidized (S = ½) state of cytochromes c displays two to four well–resolved hyperfine–shifted resonances of relative intensity 3 which are relatively narrow for paramagnetic molecules and thus can be detected rather easily in 1–D NMR spectra.81,82 These resonances originate from the methyl groups on the heme macrocycle at positions 1, 3, 5, and 8, (Fisher numbering system) and are shown in Figure 8 for a representative set of cytochrome c proteins (N. europaea c–552, P. aeruginosa c–551 and H. thermophilus c–552) and their related mutants. The X–ray structures for these proteins are shown in Figure 6 while Figure 7(A and B) illustrates the positions in which mutations have been induced in N. europaea c–552 and P. aeruginosa c–551. The shifts of the heme methyls are determined by the heme electronic structure, which is linked to the structure of the heme and its axial ligands. Contributions to the observed shifts (δobs) are given by Eq. (7)
FIGURE 8.

High-frequency regions of 1H NMR spectra of oxidized (A) recombinant Pseudomonas aeruginosa c–551,88 (B) horse cytochrome c,106 (C) recombinant Hydrogenobacter thermophilus c–552,88 (D) recombinant Nitrosomonas europaea c–552,82 (E) P. aeruiginosa mutant N64V,52 (F) N. europaea mutant N64Δ,52 (G) N. europaea mutant V65Δ,52 (H) N. europea mutant G50N/V65Δ,52 (I) P. aeruginosa mutant N50G/V65ins,52 (J) P. aeruginosa mutant N64Q.92 The symbol Δ indicates deletion of the underlined residue, “ins” indicates an aminoacid insertion. Samples were 2–3 mM protein in 50 mM sodium phosphate buffer, pH 7.0, with 5× molar excess of K3[Fe(CN)6], T = 299 K. The heme methyl resonance assignments used the same numbering system indicated in the right part of the panel (enclosed boxes). The structural drawings in the box provide illustration of the heme axial Met orientations observed in cytochrome c. The Met side chain is shown in ball–and–stick format, and P indicates propionate group. Other shift patterns also are possible in case of fluxional Met (A+B) and will depend on the conformations sampled by the Met and the chemical shifts in those conformations.
| (7) |
where δdia and δpara represent respectively the shift of the nucleus in an isostructural diamagnetic molecule and the contribution to the shift from the unpaired electron–nucleus interaction.83–85 The term δpara is determined by two contributions: (i) the contact (through–bond, δcon) and pseudocontact (through–space, δpc) components. Assuming the existence of a single spin state, δcon is described by Eq. (8)82,83,85
| (8) |
where 2πA/h is the hyperfine coupling constant for the nucleus, g is the average g value, β represents the Bohr magneton, γ is the nuclear magnetogyric ratio, S is the total electron spin, k is the Boltzmann constant, and T the absolute temperature. The pseudocontact (or dipolar) contribution, as given by Eq. (9), to the hyperfine shift depends on the position of the nucleus (in polar coordinates, r, θ, Ω) with respect to the principal axes of the magnetic susceptibility tensor χ and the magnetic anisotropy (axial, Δχax, and rhombic, Δχrh) of the system: 82,85
| (9) |
The contact and pseudocontact shifts are closely related to the type and orientation of the heme axial ligands. Walker and Shokhirev86 have shown that the heme methyl shift patterns in low–spin ferriheme proteins, which are dominated by δcon, can be related to heme axial ligand orientations via simple Hückel calculations. Pseudocontact shifts are related to the heme axial ligand orientations via the “counterrotation rule.”74,77 Thus if the mean axial ligand plane is oriented at an angle Φ from a N–Fe–N axis in the heme plane, then the direction of the minimum χ value (χxx) lies at an angle κ = −Φ from that same axis (Figure 9). Looking at different structural families, focusing here on proteins with His–Met axial ligation, it appears that cytochromes c exhibit diverse heme methyl shift patterns. Eukaryotic cytochromes c typically display a pairwise ordering of heme methyl resonances87 such that methyls 8 and 3 appear at high frequency (at ~30–35 ppm) with respect to methyls 5 and 1 (at ~10 ppm) (Figure 8B). In contrast, bacterial cytochromes c structurally similar to P. aeruginosa cytochrome c–551 usually display a reversed resonance pattern, with methyls 5 and 1 featuring high frequency signals compared to methyls 8 and 3 (Figure 8A).87 These different fingerprints result from different orientations of the heme axial Met (vide infra). The axial His in cytochromes c, in fact, is structurally more rigid and tends to be constrained along the α–γ–meso axis.28 The Met orientation found in bacterial cytochromes c and eukaryotic cytochromes c differ essentially by inversion through the axial Met sulphur. This change in ligand conformation induces alteration of the Met ligand angle of ~56°.88 The net result is a remarkable modification of the unpaired electron delocalization pattern on the heme macrocycle, being accompanied by a change in the orientation of the magnetic axes, which is reflected in the pseudocontact shifts.88,89 Despite the advances made in relating hyperfine shifts to the details of heme–ligand interactions in cytochromes c, some of them display 1H NMR properties that cannot be readily understood under this framework. The inability to describe the behaviour of the hyperfine shifts in these proteins brought into question whether models relating heme ligation to electronic structure, and thus NMR spectra, are incomplete, or whether there are aspects of heme–ligand interactions not understood in some of these proteins.86,90,91 In particular, as shown in Figure 8C and 8D respectively, both cytochrome c–552 from N. europaea 88,91 and cytochrome c-552 from Hydrogenobacter thermophilus (Ht)88,91 exhibit anomalous and highly compressed heme methyl shift patterns, not readily interpreted in terms of a single orientation of the His and Met axial ligands. The same is true for a mutant of N. europaea c–552 (NeV65Δ, Figure 8G)52 and for a mutant of P. aeruginosa c–551 (PaN64Q, Figure 8J).52,92 Such an effect is now attributed to the ability of the Met axial group to undergo a rapid (on the NMR time scale) change in configuration (stereochemistry at sulphur) and has been referred to in the literature using the term “fluxionality.”81,88,93 The prototypical patterns of heme methyl shifts corresponding to the most frequently observed axial Met orientations are depicted graphically in Figure 8 (left boxes) as conformations A, B and A+B. In what will be referred to herein as orientation A, which is seen in the 1H NMR spectrum of P. aeruginosa c–551 (Figure 8A), the heme axial Met ε–CH3 is directed toward pyrrole IV. This structural arrangement causes the unpaired electron to be localized more on pyrroles I and III (3eg(πy)) rather than on pyrroles II and IV (3eg(πz)) yielding a heme methyl shift arrangement (δMe) of 5–CH3 > 1–CH3 > 8–CH3 > 3–CH3. Orientation B, which is seen in cytochrome c from horse heart (Figure 5B), corresponds to the axial Met ε–CH3 directed toward pyrrole I. This conformation induces the unpaired electron to be localized more on pyrroles II and IV with shift pattern of 8–CH3 > 3–CH3 > 5–CH3 > 1–CH3. In N. europaea c–552 and H. thermophilus c 552, the methyl shift spread is unusually small, only 4.2 ppm, indicating nearly equal unpaired electron spin–density at the four pyrrole groups. The compressed δMe is consistent with the averaging of the shifts for the two prototypical Met conformations (A+B). However, such compressed pattern itself does not ensure the presence of a fluxional ligand (see e.g. Figure 8H where N. europaea variant G50N/V65Δ adopts Met–configuration A) and thus additional evidence is needed to support the occurrence of Met fluxionality. The presence of significant line broadening for the heme methyl resonances as a function of temperature indicates the occurrence of a chemical exchange process impacting the heme methyl shifts, and thus those properties confirm the presence of a fluxional Met. The factors controlling Met fluxionality are as yet uncertain, although the mutation of amino acid residues which interact with the heme axial Met have been shown, as reported in Figure 7, to suppress or even induce Met dynamics, as well as alter Met orientation.79,92 A suggested hypothesis is that a weak Fe–Met bond combined with a large heme pocket that can accommodate multiple Met orientations results in Met fluxionality. However, as shall we see later on, the presence of Met fluxionality seems irrelevant as to the tuning of the ligand field anisotropy in the systems.
FIGURE 9.
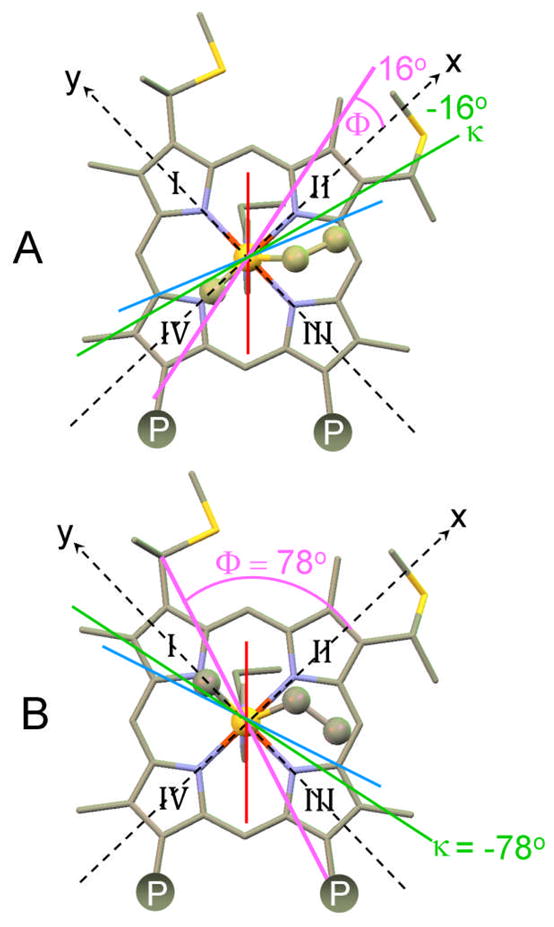
Representation of the counter rotation rule, which states that the effective axial ligand plane angle (Φ) is related to the orientation of the χxx axis (κ) according to κ = Φ. Here κ and Φ are angles of rotation from the molecular x–axis. The Φ and κ values calculated for (A) Pseudomonas aeruginosa cytochrome c–551 and (B) horse cytochrome c assuming that Φ is the mean angle of the two ligands are shown using κ = −Φ. Calculated values of κ are in general agreement with experimental values. The axial His orientation is shown with a red line, and the axial Met with a light–blue line. The bisector of these angles, the thick magenta line, defines Φ. The κ values predicted on the basis of this mean ligand angle is indicated with a thick green line. Note that the value of κ determined for Hydrogenobacter thermophilus cytochrome c–552, −47°, is approximately the average of the values in A and B, consistent with the axial Met sampling the conformations in A and B.
MODULATION OF THE HEME ANISOTROPY THROUGH SITE–DIRECTED MUTAGENESIS
The EPR and 1H NMR analyses performed recently on a series of mutants derived from P. aeruginosa c–551 and N. europaea c–552 disclosed that the ligand–field can be shifted from weakly axial (P. aeruginosa c–551) or moderately axial (N. europaea c–552) to nearly rhombic (P. aeruginosa N64V and N. europaea N64Δ) by modifying the sequence of the loop containing the axial Met.52 The induced modulation of the ligand–field is proposed to arise from both steric factors and perturbation of the electrostatic (polar) interaction between the axial ligand Met61 and Asn64. The residue Asn64 is structurally located on the axial Met–bearing loop in these proteins (Figure 7) and it has been shown to play an important role in determining the axial Met conformation relative to the heme for P. aeruginosa c–551. Upon substitution of Asn64 in P. aeruginosa c–551 with a group having similar polarity but slightly greater bulk such as glutamine residue (P. aeruginosa N64Q) only slightly modifies the original ligand field witnessed in the wild–type form. The same is true for N. europaea variant V65Δ, where the axial Met–bearing loop has been shortened by a valine residue. The N. europaea cytochrome c–552 double mutant G50N/V65Δ additionally substitutes the flexible G50 residue at the end of the loop with asparagine, the corresponding residue in P. aeruginosa c–551, in addition to deletion of Val65. Because N. europaea c–552 has one more residue in this loop, its greater length was proposed to alter its packing against the heme52 and this effect might account for the observed Met fluxionality in N. europaea c–552. In the expressed N. europaea variant G50N/V65Δ, the Met fluxionality was in fact hindered being accompanied by adoption of configuration A. However, the ligand–field strength did not change and remained moderately axial as in the wild type form. The complementary double mutant of P. aeruginosa c–551 (P. aeruginosa V65ins/N50G) was also prepared together with the P. aeruginosa N64V mutation which replaced the polar asparagine residue with the hydrophobic, isosteric side chain of valine. This mutation provided only a weak shift of the ligand–field towards increased rhombicity. From these studies, it became clear that when Met and His act as axial ligands, even minor electronic perturbations of the Met group are enough to trigger changes in ligand–field anisotropy from (weakly) axial to rhombic. However, for His/Met ligated systems, no clear–cut links have been found between ligand-field parameters and axial groups’ orientations. In fact, looking at the NMR and EPR results shown in Table 3, there is no direct relationship between the presence of axial Met dynamics and observation of axial EPR spectra, nor between Met orientation (A, B) (Figure 8) and g–tensor parameters, in contrast with cytochromes with bis–His axial ligation for which ligand orientation and g–tensor parameters are clearly correlated.93,94 On the other hand, as shown in Figure 11, a linear correlation stands between the observed gmax values (or their derived ligand–field anisotropy, V/Δ ratio) versus the averaged heme methyl chemical shift <δ> that can also accommodate the values taken from some other cytochromes c with His-Met axial ligation. The correlation shows that i) when the gmax signal increases, the average methyl chemical shift <δ> increases and ii) when the ligand field anisotropy V/Δ increases (from axial towards rhombic), the average methyl chemical shift <δ> decreases. This finding is reminiscent of the linear relationship observed earlier by Walker between gmax (or |gzz|) and V/Δ with Azz, as determined from Mössbauer data.28 In order to further test the generality of this correlation, data on the H. thermophilus c–552 protein (1H NMR, EPR), and from one of its mutants (HtQ64N) has been included here, since this protein share high sequence identity (57%)90 and structural homology with its mesophilic counterpart P. aeruginosa c–551, as shown by its X–ray structure (Figure 6D). The observed low–temperature X–band EPR spectra are depicted together in Figure 10. H. thermophilus c–552 (Figure 10A) exhibits an EPR envelope where the ligand–field anisotropy is slightly more axial than P. aeruginosa c–551. Here, substitution of the bulkier glutamine (Q64) with an asparagine group (N64), the same residue present in P. aeruginosa cytochrome c–551, yielded little change in the electronic properties of the system (Figure 10B). By including these values (wild-type H. thermophilus c–552 and mutant Q64N) in the trend gmax = f <δ> depicted in Figure 11, the linear correlation between gmax and the averaged <δ> methyl chemical shifts still holds fairly well. However when other combinations of axial heme ligands are considered, such as, for example, cytochrome f (N– terminal amine and His as axial iron ligands) with gmax at 3.51 and <δ> at 17.8 ppm, cytochrome b5 with gmax at 3.03 and <δ> at 11.1 ppm (bis-His as axial ligands) or myoglobin-cyanide with gmax at 3.45 and <δ> at 17.2 ppm (His and cyanide as axial ligands) these values are much far away from the linear trend reported in Figure 11 (see e.g. Supporting Information file on Ref. 52). Effects of freezing and low temperature for the EPR cytochrome c measurements in relation to the liquid phase NMR spectra has been discussed in ref 52 as well as in the Supporting Information file on Ref. 52. It is also interesting to note that among the cytochromes c with His-Met axial ligation the largest deviations from the linearity are seen for those proteins exhibiting the largest differences in reduction potential (E0′) with respect to those usually found in Class I cytochrome c, which normally vary from + 0.20 to ~+ 0.35 Volt (versus NHE).95 Those proteins are B. pasteurii c–553 which exhibits a much lower E0′ (+ 0.047 V)96, R. palustris c2 with a larger E0′ value (+ 0.350 V and/or + 0.365 V varying on conditions),97 and R. rubrum c2 (+ 0.310 V).98 Therefore it is anticipated that the potential for N. europaea cytochrome variant N64Δ should also be quite different from the wild-type c–552 form. Further analyses of how potential relates to electronic structure will aid in linking the variations in electronic structure of His/Met–ligated hemes with function.
TABLE 3.
The g–tensor values, axial (Δ/ξ) and rhombic (V/ξ) ligand–field parameters, the porphyrin methyl chemical shifts (δ) and the reduction potential (E0) for Pseudomonas aeruginosa cytochrome c–551, Nitrosomonas europaea cytochrome c–552, Hydrogenobacter thermophilus cytochrome c–552 derived from EPR (T = 10 ± 0.5 K), 1H NMR and E0 from cyclic voltammetry measurements (around neutral pH). Other relevant literature data for similar cytochrome c proteins are included in the table.
| Protein variant | g–tensora | Ligand–field | 1H NMR methyl shifts, ppm. | |||||||||||
|---|---|---|---|---|---|---|---|---|---|---|---|---|---|---|
| His–Met axial ligands | gmax | gmid | gmin | V/ξ | Δ/ξ | V/Δ | 1–CH3 | 3–CH3 | 5–CH3 | 8–CH3 | <δ> | Met– conformation | E0, mVoltb | Ref. |
| (1) P. aeruginosa c–551 | 3.20 | 2.06 | 1.23 | 1.28 | 3.45 | 0.37 | 26.5 | 13.2 | 31.5 | 16.0 | 21.8 | A | + 291 | 52,116 |
| (2) P. aeruginosa c–551 N64V | 3.05 | 2.23 | 1.31 | 1.53 | 2.80 | 0.55 | 12.9 | 25.6 | 17.7 | 28.1 | 21.1 | B | – | 52 |
| (3) N. europaea c–552 | 3.34 | 1.87 | 1.17 | 1.09 | 4.45 | 0.24 | 20.7 | 21.6 | 24.9 | 22.6 | 22.4 | A+B | + 250 | 52,30,116 |
| (4) N. europaea c–552 V65Δc | 3.35 | 1.87 | 1.14 | 1.06 | 4.30 | 0.25 | 21.9 | 20.6 | 26.1 | 21.9 | 22.6 | A+B | + 232 | 117 |
| (5) N. europaea c–552 N64Δ | 3.13 | 2.18 | 1.20 | 1.36 | 2.74 | 0.50 | 10.9 | 29.3 | 14.1 | 29.7 | 21.0 | B | – | 52 |
| (6) N. europaea c–552 G50N/V65Δc | 3.34 | 1.87 | 1.15 | 1.08 | 4.78 | 0.23 | 22.2 | 20.1 | 26.4 | 21.5 | 22.6 | A | – | 52 |
| (7) P. aeruginosa c–551 N64Q | 3.21 | 2.09 | 1.15 | 1.23 | 3.02 | 0.41 | 21.4 | 25.5 | 19.2 | 19.8 | 21.5 | A+B | + 250 | 52,92,116 |
| (8) P. aeruginosa c–551 N50G/V65ins | 3.18 | 2.11 | 1.26 | 1.34 | 3.31 | 0.40 | 22.9 | 15.9 | 29.3 | 19.2 | 21.8 | A | – | 52 |
| (9) Horse cytochrome c | 3.06 | 2.25 | 1.25 | 1.48 | 2.56 | 0.58 | 7.2 | 31.7 | 10.2 | 34.5 | 21.1 | B | + 262 | 80, 95 |
| (10) B. pasteurii c–553 | 3.36 | 1.94 | 0.98 | 1.00 | 3.18 | 0.31 | 14.8 | 28.8 | 20.9 | 29.8 | 23.6 | B | + 47 | 30,96 |
| (11) S. cerevisiae cytochrome c iso–1d | 3.06 | 2.25 | 1.25 | 1.48 | 2.56 | 0.58 | 8.0 | 31.3 | 11.0 | 34.8 | 21.3 | B | + 290 | 86,117 |
| (12) R. rubrum c2e | 3.13 | 2.11 | 1.23 | 1.33 | 3.08 | 0.43 | 10.8 | 29.9 | 15.0 | 33.2 | 22.2 | B | + 310 | 29,86 |
| (13) Rh. palustris c2 | 3.22 | 2.07 | 1.22 | 1.27 | 3.38 | 0.38 | 12.4 | 31.1 | 18.3 | 36.4 | 24.6 | B | + 362 | 95,118 |
| (14) P. ZoBell c–551 | 2.97 | 2.24 | ~1.40 | 1.69 | 2.95 | 0.57 | 21.2 | 13.6 | 30.3 | 17.6 | 20.7 | A | + 250 | 86,119 |
| (15) P. stutzeri c–551 | 2.96 | 2.27 | 1.62 | 2.01 | 3.86 | 0.52 | 21.3 | 13.7 | 30.5 | 18.0 | 20.9 | A | + 250–+260 | 86,120 |
| (16) H. thermophilus c–552 | 3.23 | 2.02 | 1.19 | 1.22 | 3.77 | 0.32 | 18.2 | 22.3 | 22.9 | 24.3 | 21.9 | A+B | + 215 | 81,116, g |
| (17) H. thermophilus c–552 Q64N | 3.24 | 2.06 | 1.16 | 1.21 | 3.51 | 0.34 | 26.6 | 12.9 | 32.4 | 17.3 | 22.3 | A | + 245 | 116, g |
| (18) B. halodenitrificans c–550f | 3.50 | – | – | – | – | – | 25.56 | 15.55 | 26.95 | 23.21 | 23.07 | A | + 138 | 121 |
Data obtained at cryogenic temperatures (T ≤ 10 K).
Data obtained at neutral pH.
g–tensor and ligand–field data for the dominant HALS (Type I) component only.
Major component, neutral pH.
From the 57Fe enriched protein (pH = 7) with values obtained by combination of EPR and Mössbauer data.
Data obtained at pH = 5.3.
This work.
The symbol (ξ) indicates the spin–orbit coupling constant (~ 400 cm−1).
FIGURE 11.

Correlation between gmax values versus the average heme methyl chemical shift <δ> in Nitrosomonas europaea cytochrome c–552, Pseudomonas aeruginosa cytochrome c–551, Hydrogenobacter thermophilus cytochrome c–552 and mutants together with other cytochrome c variants. The cytochrome numbers (1–18) correspond to those employed in Table 3. Color codes indicate Met-conformation as that employed in Figure 8 (Red, conformation A; Green, conformation B; Blue, fluxional Met (A+B)).
FIGURE 10.
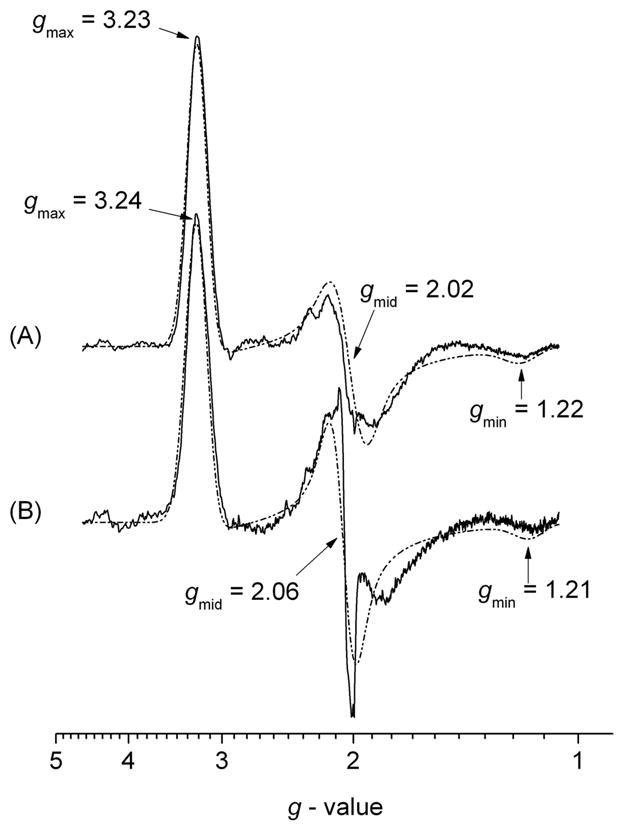
X–band EPR spectra of (A) wild type Hydrogenobacter thermophilus cytochrome c–552 (Ht c–552) and (B) Ht c–552 Q64N mutant, recorded at cryogenic temperature, T = 10 K, in HEPES buffer (50 mM, pH 7.5). The dashed–dotted lines represent the EPR computer simulation envelopes.
CONCLUSION
In this review we described some of our recent studies on bis–His as well as His–Met coordinated low-spin hemes. These two types of coordination environment for the low-spin Fe3+ metal-ion can generate EPR envelopes characterized by either large gmax values and large g anisotropy (gmax ≥ 3.3, type I, HALS species) or species with small gmax values and small g anisotropy (type II, gmax < 3.2, rhombic heme). In bis–His coordinated hemes these effects are linked directly to the orientation of the two His groups with respect to each other such that (i) parallel His planes results in rhombic signal and (ii) perpendicular His planes results in HALS signal. The observation of large gmax values (3.38 and 3.48) in the cytochrome b subunit of succinate:quinone reductase combined with the observation of a near–infrared magnetic circular dichroism charge transfer band at 1600 nm show that the two heme groups adopt bis–His ligation with perpendicular orientation. These studies allowed the building of a model of the transmembrane helices with the two His pair sites. The validity of the model was confirmed subsequently by crystal structure analyses. Similar bis–His coordination was suggested for both heme a and heme b in heme a synthase, possibly heme a has Met-His coordination. On the other hand, analyses of literature data complemented by studies on a novel series of cytochrome c mutants derived from N. europaea (c–552), P. aeruginosa (c–551) and H. thermophilus (c–552) demonstrated that when Met and His act as axial ligands, unfortunatelyno direct and simple correlation exists between the observation of a large gmax value and the mutual orientation of the Met and His axial ligands (configuration A, B or fluxional Met (A+B)). Even slight electronic perturbations of the Met ligand apparently are enough to trigger changes in the heme ligand field strength. While the ligand field present in bis–His systems can be made strong enough by the axial groups arrangements to induce V/Δ → 0, hence towards the strong axial case (V ~ 0, gmax→ 4, gmid ~ gmin→0) as described in Griffith and Taylor’s theory, for the His Met low spin heme, the larger covalency present in the S–Fe bonds renders these systems at best highly anisotropic (gmax ≫ gmid > gmin, V ≠ 0) but not really axial.
Acknowledgments
Contract grant sponsor/Contract grant number: This work was supported by the Research Council of Norway Grant 177661/V30 (K.K.A.) and Grant 157855 (E.H., and K.K.A.), and from The National Institute of Health (NIH) of the United States of America Grant GM63170 (K.L.B.). Research in the Lars Hederstedt and Ulf Ryde groups were supported by the Swedish Research Council. GZ thanks the support from the PEOPLE Marie Curie actions Intra European Fellowship within the 7th European Community Framework Programme (PIEF-GA-2009-235237).
Abbreviations
- EPR
electron paramagnetic resonance
- NMR
nuclear magnetic resonance
- NIR–MCD
near–infrared magnetic circular dichroism
- SQRs
succinate:quinone reductases
- QFRs
fumarate:quinol reductases
- FDH–N
formate dehydrogenase–N
- HQNO
2–n–heptyl–4–hydroxyquinoline–N–oxide
- HAS
Heme a synthase
Footnotes
In honor of Professor Lelio Mazzarella
References
- 1.Bikiel DE, Boechi L, Capece L, Crespo A, De Biase PM, Di Lella S, Lebrero MCG, Marti MA, Nadra AD, Perissinotti LL, Scherlis DA, Estrin DA. Phys Chem Chem Phys. 2006;8:5611–5628. doi: 10.1039/b611741b. [DOI] [PubMed] [Google Scholar]
- 2.Dolphin D, editor. The Porphyrins. Academic Press, Inc; London: 1979. [Google Scholar]
- 3.Poulos TL, Li HY, Raman CS. Curr Opin Chem Biol. 1999;3:131–137. doi: 10.1016/s1367-5931(99)80024-6. [DOI] [PubMed] [Google Scholar]
- 4.Igarashi N, Moriyama H, Fujiwara T, Fukumori Y, Tanaka N. Nat Struct Biol. 1997;4:276–284. doi: 10.1038/nsb0497-276. [DOI] [PubMed] [Google Scholar]
- 5.Hersleth HP, Varnier A, Harbitz E, Rohr AK, Schmidt PP, Sorlie M, Cederkvist FH, Marchal S, Gorren ACF, Mayer B, Uchida T, Schünemann V, Kitagawa T, Trautwein AX, Shimizu T, Lange R, Gorbitz CH, Andersson KK. Inorg Chim Acta. 2008;361:831–843. [Google Scholar]
- 6.Hersleth HP, Uchida T, Rohr AK, Teschner T, Schünemann V, Kitagawa T, Trautwein AX, Gorbitz CH, Andersson KK. J Biol Chem. 2007;282:23372–23386. doi: 10.1074/jbc.M701948200. [DOI] [PubMed] [Google Scholar]
- 7.Hersleth HP, Ryde U, Rydberg P, Gorbitz CH, Andersson KK. J Inorg Biochem. 2006;100:460–476. doi: 10.1016/j.jinorgbio.2006.01.018. [DOI] [PubMed] [Google Scholar]
- 8.Bertini I, Gori G, Luchinat C, Vila AJ. Biochemistry. 1993;32:776–783. doi: 10.1021/bi00054a006. [DOI] [PubMed] [Google Scholar]
- 9.La Mar GN, Jackson JT, Dugad LB, Cusanovich MA, Bartsch RG. J Biol Chem. 1990;265:16173–16180. [PubMed] [Google Scholar]
- 10.Margoliash E, Schejter A. Trends Biochem Sci. 1984;9:364–367. [Google Scholar]
- 11.Keilin D. Proc R Soc Lond B. 1925;98:312–339. [Google Scholar]
- 12.Sigfridsson E, Olsson MHM, Ryde U. J Phys Chem B. 2001;105:5546–5552. [Google Scholar]
- 13.Blumberg WE, Peisach J. Adv Chem Ser. 1971;100:271–291. [Google Scholar]
- 14.Allen JWA, Barker PD, Daltrop O, Stevens JM, Tomlinson EJ, Sinha N, Sambongi Y, Ferguson SJ. Dalton Trans. 2005:3410–3418. doi: 10.1039/b508139b. [DOI] [PubMed] [Google Scholar]
- 15.Hooper AB, Dispirito AA. Microbiol Rev. 1985;49:140–157. doi: 10.1128/mr.49.2.140-157.1985. [DOI] [PMC free article] [PubMed] [Google Scholar]
- 16.Wood PM. FEBS Lett. 1983;164:223–226. doi: 10.1016/0014-5793(83)80289-0. [DOI] [PubMed] [Google Scholar]
- 17.Bowman SEJ, Bren KL. Nat Prod Rep. 2008;25:1118–1130. doi: 10.1039/b717196j. [DOI] [PMC free article] [PubMed] [Google Scholar]
- 18.Berry EA, Walker FA. J Biol Inorg Chem. 2008;13:481–498. doi: 10.1007/s00775-008-0372-9. [DOI] [PMC free article] [PubMed] [Google Scholar]
- 19.Palmer G. Biochem Soc Trans. 1985;13:548–560. doi: 10.1042/bst0130548. [DOI] [PubMed] [Google Scholar]
- 20.McGarvey BR. Coord Chem Rev. 1998;170:75–92. [Google Scholar]
- 21.Walker FA. Chem Rev. 2004;104:589–615. doi: 10.1021/cr020634j. [DOI] [PubMed] [Google Scholar]
- 22.Griffith JS. Proc R Soc Lond A. 1956;235:23–36. [Google Scholar]
- 23.Taylor CPS. Biochim Biophys Acta. 1977;491:137–149. doi: 10.1016/0005-2795(77)90049-6. [DOI] [PubMed] [Google Scholar]
- 24.Alonso PJ, Martinez JI, Garcia-Rubio I. Coord Chem Rev. 2007;251:12–24. [Google Scholar]
- 25.Walker FA, Huynh BH, Scheidt WR, Osvath SR. J Am Chem Soc. 1986;108:5288–5297. [Google Scholar]
- 26.Scheidt WR, Kirner JF, Hoard JL, Reed CA. J Am Chem Soc. 1987;109:1963–1968. [Google Scholar]
- 27.Gadsby PMA, Thomson AJ. J Am Chem Soc. 1990;112:5003–5011. [Google Scholar]
- 28.Walker FA. Coord Chem Rev. 1999;185–6:471–534. [Google Scholar]
- 29.Huynh BH, Emptage MH, Munck E. Biochim Biophys Acta. 1978;534:295–306. doi: 10.1016/0005-2795(78)90012-0. [DOI] [PubMed] [Google Scholar]
- 30.Zoppellaro G, Teschner T, Harbitz E, Schünemann V, Karlsen S, Arciero DM, Ciurli S, Trautwein AX, Hooper AB, Andersson KK. Chem Phys Chem. 2006;7:1258–1267. doi: 10.1002/cphc.200500693. [DOI] [PubMed] [Google Scholar]
- 31.Cheesman MR, Greenwood C, Thomson AJ. Adv Inorg Chem. 1991;36:201–255. [Google Scholar]
- 32.Portis AM. Phys Rev. 1953;91:1071–1078. [Google Scholar]
- 33.Walker FA, Nasri H, TurowskaTyrk I, Mohanrao K, Watson CT, Shokhirev NV, Debrunner PG, Scheidt WR. J Am Chem Soc. 1996;118:12109–12118. [Google Scholar]
- 34.Rivera M, Caignan GA, Astashkin AV, Raitsimring AM, Shokhireva TK, Walker FA. J Am Chem Soc. 2002;124:6077–6089. doi: 10.1021/ja017334o. [DOI] [PubMed] [Google Scholar]
- 35.Peisach J, Blumberg WE, Adler A. Ann N Y Acad Sci. 1973;206:310–327. doi: 10.1111/j.1749-6632.1973.tb43219.x. [DOI] [PubMed] [Google Scholar]
- 36.Palmer G. In: Physical Methods in Bioinorganic Chemistry. LQ Jr, editor. University Sciences Books; Sausalito, California: 2000. pp. 121–184. [Google Scholar]
- 37.De Vries S, Albracht SPJ. Biochim Biophys Acta. 1979;546:334–340. doi: 10.1016/0005-2728(79)90050-1. [DOI] [PubMed] [Google Scholar]
- 38.De Vries S, Albracht SPJ, Leeuwerik FJ. Biochim Biophys Acta. 1979;546:316–333. doi: 10.1016/0005-2728(79)90049-5. [DOI] [PubMed] [Google Scholar]
- 39.Salerno JC. J Biol Chem. 1984;259:2331–2336. [PubMed] [Google Scholar]
- 40.Paul MA, Gadsby PMA, Thomson AJ. FEBS Lett. 1986;197:253–257. [Google Scholar]
- 41.Migita CT, Iwaizumi M. J Am Chem Soc. 1981;103:4378–4381. [Google Scholar]
- 42.Orme-Johnson NR, Hansen RE, Beinert H. Biochem Biophys Res Comm. 1971;45:871–878. doi: 10.1016/0006-291x(71)90419-0. [DOI] [PubMed] [Google Scholar]
- 43.Friden H, Cheesman MR, Hederstedt L, Andersson KK, Thomson AJ. Biochim Biophys Acta. 1990;1041:207–215. doi: 10.1016/0167-4838(90)90067-p. [DOI] [PubMed] [Google Scholar]
- 44.Hederstedt L, Andersson KK. J Bacteriol. 1986;167:735–739. doi: 10.1128/jb.167.2.735-739.1986. [DOI] [PMC free article] [PubMed] [Google Scholar]
- 45.Tsai AL, Palmer G. Biochem Biophys Acta. 1982;681:484–495. doi: 10.1016/0005-2728(82)90191-8. [DOI] [PubMed] [Google Scholar]
- 46.Tsai AL, Palmer G. Biochim Biophys Acta. 722:349–363. doi: 10.1016/0005-2728(83)90083-x. [DOI] [PubMed] [Google Scholar]
- 47.Schünemann V, Trautwein AX, Illerhaus J, Haehnel W. Biochemistry. 1999;38:8981–8991. doi: 10.1021/bi990080n. [DOI] [PubMed] [Google Scholar]
- 48.Zatsman AI, Zhang HM, Gunderson WA, Cramer WA, Hendrich MP. J Am Chem Soc. 2006;128:14246–14247. doi: 10.1021/ja065798m. [DOI] [PMC free article] [PubMed] [Google Scholar]
- 49.Dou Y, Admiraal SJ, Ikedasaito M, Krzywda S, Wilkinson AJ, Li TS, Olson JS, Prince RC, Pickering IJ, George GN. J Biol Chem. 1995;270:15993–16001. doi: 10.1074/jbc.270.27.15993. [DOI] [PubMed] [Google Scholar]
- 50.Arciero DM, Hooper AB. J Biol Chem. 1994;269:11878–11886. [PubMed] [Google Scholar]
- 51.Arciero DM, Peng QY, Peterson J, Hooper AB. FEBS Lett. 1994;342:217–220. doi: 10.1016/0014-5793(94)80504-0. [DOI] [PubMed] [Google Scholar]
- 52.Zoppellaro G, Harbitz E, Kaur R, Ensign AA, Bren KL, Andersson KK. J Am Chem Soc. 2008;130:15348–15360. doi: 10.1021/ja8033312. [DOI] [PMC free article] [PubMed] [Google Scholar]
- 53.Harbitz E. Master Thesis (Cand Scient Thesis) University of Oslo; Norway: 2003. [Google Scholar]
- 54.Brautigan DL, Feinberg BA, Hoffman BM, Margoliash E, Peisach J, Blumberg WE. J Biol Chem. 1977;252:574–582. [PubMed] [Google Scholar]
- 55.Ambler RP, Dalton H, Meyer TE, Bartsch RG, Kamen MD. Biochem J. 1986;233:333–337. doi: 10.1042/bj2330333. [DOI] [PMC free article] [PubMed] [Google Scholar]
- 56.Hägerhäll C, Aasa R, von Wachenfeldt C, Hederstedt L. Biochemistry. 1992;31:7411–7421. doi: 10.1021/bi00147a028. [DOI] [PubMed] [Google Scholar]
- 57.Hägerhäll C. Biochim Biophys Acta. 1997;1320:107–141. doi: 10.1016/s0005-2728(97)00019-4. [DOI] [PubMed] [Google Scholar]
- 58.Hederstedt L. Science. 1999;284:1941–1942. doi: 10.1126/science.284.5422.1941. [DOI] [PubMed] [Google Scholar]
- 59.Hägerhäll C, Hederstedt L. FEBS Lett. 1996;389:25–31. doi: 10.1016/0014-5793(96)00529-7. [DOI] [PubMed] [Google Scholar]
- 60.Schirawski J, Unden G. Eur J Biochem. 1998;257:210–215. doi: 10.1046/j.1432-1327.1998.2570210.x. [DOI] [PubMed] [Google Scholar]
- 61.Schnorpfeil M, Janausch IG, Biel S, Kroger A, Unden G. Eur J Biochem. 2001;268:3069–3074. doi: 10.1046/j.1432-1327.2001.02202.x. [DOI] [PubMed] [Google Scholar]
- 62.Matsson M, Tolstoy D, Aasa R, Hederstedt L. Biochemistry. 2000;39:8617–8624. doi: 10.1021/bi000271m. [DOI] [PubMed] [Google Scholar]
- 63.Smirnova IA, Hägerhäll C, Konstantinov AA, Hederstedt L. FEBS Lett. 1995;359:23–26. doi: 10.1016/0014-5793(94)01442-4. [DOI] [PubMed] [Google Scholar]
- 64.Hägerhäll C, Friden H, Aasa R, Hederstedt L. Biochemistry. 1995;34:11080–11089. doi: 10.1021/bi00035a013. [DOI] [PubMed] [Google Scholar]
- 65.Jormakka M, Tornroth S, Byrne B, Iwata S. Science. 2002;295:1863–1868. doi: 10.1126/science.1068186. [DOI] [PubMed] [Google Scholar]
- 66.Bertero MG, Rothery RA, Boroumand N, Palak M, Blasco F, Ginet N, Weiner JH, Strynadka NCJ. J Biol Chem. 2005;280:14836–14843. doi: 10.1074/jbc.M410457200. [DOI] [PubMed] [Google Scholar]
- 67.Svensson B, Andersson KK, Hederstedt L. Eur J Biochem. 1996;238:287–295. doi: 10.1111/j.1432-1033.1996.0287q.x. [DOI] [PubMed] [Google Scholar]
- 68.Mogi T, Saiki K, Anraku Y. Mol Microbiol. 1994;14:391–398. doi: 10.1111/j.1365-2958.1994.tb02174.x. [DOI] [PubMed] [Google Scholar]
- 69.Brown KR, Allan BA, Do P, Hegg EL. Biochemistry. 2002;41:10906–10913. doi: 10.1021/bi0203536. [DOI] [PubMed] [Google Scholar]
- 70.Hederstedt L, Lewin A, Throne-Holst M. J Bacteriol. 2005;187:8361–8369. doi: 10.1128/JB.187.24.8361-8369.2005. [DOI] [PMC free article] [PubMed] [Google Scholar]
- 71.Lewin A, Hederstedt L. FEBS Lett. 2006;580:5351–5356. doi: 10.1016/j.febslet.2006.08.080. [DOI] [PubMed] [Google Scholar]
- 72.Lewin A, Hederstedt L. FEBS Lett. 2008;582:1330–1334. doi: 10.1016/j.febslet.2008.03.015. [DOI] [PubMed] [Google Scholar]
- 73.Orme-Johnson NR, Hansen RE, Beinert H. J Biol Chem. 1974;249:1928–1939. [PubMed] [Google Scholar]
- 74.Shokhirev NV, Walker FA. J Am Chem Soc. 1998;120:981–990. [Google Scholar]
- 75.Benini S, Gonzalez A, Rypniewski WR, Wilson KS, Van Beeumen JJ, Ciurli S. Biochemistry. 2000;39:13115–13126. doi: 10.1021/bi000402j. [DOI] [PubMed] [Google Scholar]
- 76.Banci L, Bertini I, Luchinat C, Pierattelli R, Shokhirev NV, Walker FA. J Am Chem Soc. 1998;120:8472–8479. [Google Scholar]
- 77.Turner DL. Eur J Biochem. 1995;227:829–837. doi: 10.1111/j.1432-1033.1995.tb20208.x. [DOI] [PubMed] [Google Scholar]
- 78.Turner DL. Eur J Biochem. 1993;211:563–568. doi: 10.1111/j.1432-1033.1993.tb17583.x. [DOI] [PubMed] [Google Scholar]
- 79.Bertini I, Luchinat C, Parigi G. Eur J Inorg Chem. 2000:2473–2480. doi: 10.1021/ic010161j. [DOI] [PubMed] [Google Scholar]
- 80.Walker FA. Inorg Chem. 2003;42:4526–4544. doi: 10.1021/ic026245p. [DOI] [PubMed] [Google Scholar]
- 81.Bren KL, Kellogg JA, Kaur R, Wen X. Inorg Chem. 2004;43:7934–7944. doi: 10.1021/ic048925t. [DOI] [PubMed] [Google Scholar]
- 82.La Mar GN, Satterlee JD, de Ropp JS, editors. Academic Press. New York: 2000. [Google Scholar]
- 83.Bertini I, Luchinat C, Aime S. Coord Chem Rev. 1996;150:1–293. [Google Scholar]
- 84.McConnell HM, Robertson RE. J Chem Phys. 1958;29:1361–1365. [Google Scholar]
- 85.Kurland RJ, McGarvey BR. J Mag Res. 1970;2:286–301. [Google Scholar]
- 86.Shokhirev NV, Walker FA. J Biol Inorg Chem. 1998;3:581–594. [Google Scholar]
- 87.Senn H, Wüthrich K. Quart Rev Biophys. 1985;18:111–134. doi: 10.1017/s0033583500005151. [DOI] [PubMed] [Google Scholar]
- 88.Zhong LH, Wen X, Rabinowitz TM, Russell BS, Karan EF, Bren KL. Proc Natl Acad Sci USA. 2004;101:8637–8642. doi: 10.1073/pnas.0402033101. [DOI] [PMC free article] [PubMed] [Google Scholar]
- 89.Santos H, Turner DL. Magn Reson Chem. 1993;31:S90–S95. [Google Scholar]
- 90.Karan EF, Russell BS, Bren KL. J Biol Inorg Chem. 2002;7:260–272. doi: 10.1007/s007750100292. [DOI] [PubMed] [Google Scholar]
- 91.Timkovich R, Cai ML, Zhang BL, Arciero DM, Hooper AB. Eur J Biochem. 1994;226:159–168. doi: 10.1111/j.1432-1033.1994.tb20037.x. [DOI] [PubMed] [Google Scholar]
- 92.Wen X, Bren KL. Inorg Chem. 2005;44:8587–8593. doi: 10.1021/ic050976i. [DOI] [PubMed] [Google Scholar]
- 93.Neese F. Curr Opin Chem Biol. 2003;7:125–135. doi: 10.1016/s1367-5931(02)00006-6. [DOI] [PubMed] [Google Scholar]
- 94.Teschner T, Yatsunyk L, Schünemann V, Paulsen H, Winkler H, Hu CJ, Scheidt WR, Walker FA, Trautwein AX. J Am Chem Soc. 2006;128:1379–1389. doi: 10.1021/ja056343k. [DOI] [PMC free article] [PubMed] [Google Scholar]
- 95.Battistuzzi G, Borsari M, Sola M. Antioxid Redox Signal. 2001;3:279–291. doi: 10.1089/152308601300185232. [DOI] [PubMed] [Google Scholar]
- 96.Benini S, Borsari M, Ciurli S, Dikiy A, Lamborghini M. J Biol Inorg Chem. 1998;3:371–382. [Google Scholar]
- 97.Geremia S, Garau G, Vaccari L, Sgarra R, Viezzoli MS, Calligaris M, Randaccio L. Prot Sci. 2002;11:6–17. doi: 10.1110/ps.ps.13102. [DOI] [PMC free article] [PubMed] [Google Scholar]
- 98.Salemme FR. Annu Rev Biochem. 1977;46:299–329. doi: 10.1146/annurev.bi.46.070177.001503. [DOI] [PubMed] [Google Scholar]
- 99.Bertero MG, Rothery RA, Palak M, Hou C, Lim D, Blasco F, Weiner JH, Strynadka NCJ. Nat Struct Biol. 2003;10:681–687. doi: 10.1038/nsb969. [DOI] [PubMed] [Google Scholar]
- 100.Huang LS, Shen JT, Wang AC, Berry EA. Biochim Biophys Acta. 2005;1757:1073–1083. doi: 10.1016/j.bbabio.2006.06.015. [DOI] [PMC free article] [PubMed] [Google Scholar]
- 101.DeLano WL. DeLano Scientific; San Carlos, CA, USA: 2002. http://www.pymol.org. [Google Scholar]
- 102.Bushnell GW, Louie GV, Brayer GD. J Mol Biol. 1990;214:585–595. doi: 10.1016/0022-2836(90)90200-6. [DOI] [PubMed] [Google Scholar]
- 103.Matsuura Y, Takano T, Dickerson RE. J Mol Biol. 1982;156:389–409. doi: 10.1016/0022-2836(82)90335-7. [DOI] [PubMed] [Google Scholar]
- 104.Travaglini-Allocatelli C, Gianni S, Dubey VK, Borgia A, Di Matteo A, Bonivento D, Cutruzzola F, Bren KL, Brunori M. J Biol Chem. 2005;280:25729–25734. doi: 10.1074/jbc.M502628200. [DOI] [PubMed] [Google Scholar]
- 105.Timkovich R, Bergmann D, Arciero DM, Hooper AB. Biophys J. 1998;75:1964–1972. doi: 10.1016/S0006-3495(98)77637-4. [DOI] [PMC free article] [PubMed] [Google Scholar]
- 106.Russell BS, Melenkivitz R, Bren KL. Proc Natl Acad Sci USA. 2000;97:8312–8317. doi: 10.1073/pnas.150239397. [DOI] [PMC free article] [PubMed] [Google Scholar]
- 107.Becke AD. Phys Rev A. 1988;38:3098–3100. doi: 10.1103/physreva.38.3098. [DOI] [PubMed] [Google Scholar]
- 108.Perdew JP. Phys Rev B. 1986;33:8822–8824. doi: 10.1103/physrevb.33.8822. [DOI] [PubMed] [Google Scholar]
- 109.Weigend F, Ahlrichs R. Phys Chem Chem Phys. 2005;7:3297–3305. doi: 10.1039/b508541a. [DOI] [PubMed] [Google Scholar]
- 110.Ahlrichs R, Bär M, Häser M, Horn H, Kölmel C. Chem Phys Lett. 1989;162:165–169. [Google Scholar]
- 111.Unden G, Hackenberg H, Kroger A. Biochim Biophys Acta. 1980;591:275–288. doi: 10.1016/0005-2728(80)90159-0. [DOI] [PubMed] [Google Scholar]
- 112.Crouse BR, Yu CA, Yu L, Johnson MK. FEBS Lett. 1995;367:1–4. doi: 10.1016/0014-5793(95)00522-b. [DOI] [PubMed] [Google Scholar]
- 113.Yu L, Xu JX, Haley PE, Yu CA. J Biol Chem. 1987;262:1137–1143. [PubMed] [Google Scholar]
- 114.Kita K, Vibat CRT, Meinhardt S, Guest JR, Gennis RB. J Biol Chem. 1989;264:2672–2677. [PubMed] [Google Scholar]
- 115.Peterson J, Vibat C, Gennis RB. FEBS Lett. 1994;355:155–156. doi: 10.1016/0014-5793(94)01189-3. [DOI] [PubMed] [Google Scholar]
- 116.Ye T, Kaur R, Wen X, Bren KL, Elliott SJ. Inorg Chem. 2005;44:8999–9006. doi: 10.1021/ic051003l. [DOI] [PubMed] [Google Scholar]
- 117.Brautigan DL, Feinberg BA, Hoffman BM, Margoliash E, Peisach J, Blumberg WE. J Biol Chem. 1977;252:574–582. [PubMed] [Google Scholar]
- 118.Bertini I, Luchinat C, Macinai R, Martinuzzi S, Pierattelli R, Viezzoli MS. Inorg Chim Acta. 1998;269:125–134. [Google Scholar]
- 119.Cheesman MR, Ferguson SJ, Moir JWB, Richardson DJ, Zumft WG, Thomson AJ. Biochemistry. 1997;36:16267–16276. doi: 10.1021/bi971677a. [DOI] [PubMed] [Google Scholar]
- 120.van Wonderen JH, Knight C, Oganesyan VS, George SJ, Zumft WG, Cheesman MR. J Biol Chem. 2007;282:28207–28215. doi: 10.1074/jbc.M701242200. [DOI] [PubMed] [Google Scholar]
- 121.Saraiva LM, Denariaz G, Liu MY, Payne WJ, Legall J, Moura I. Eur J Biochem. 1992;204:1131–1139. doi: 10.1111/j.1432-1033.1992.tb16738.x. [DOI] [PubMed] [Google Scholar]