

Abstract
Quantitative MRI measures of multi-exponential T2 relaxation (MET2) and magnetization transfer (qMT) were acquired from six samples of excised and fixed rat spinal cord and compared with quantitative histology. MRI and histology data were analyzed from six white matter tracts, each of which possessed unique micro-anatomical characteristics (axon diameter and myelin thickness, in particular) but a relatively constant volume fraction of myelin. The results indicated that MET2 characteristics varied substantially with variation of microanatomy while the qMT characteristics remained close to constant. The most-often cited MET2 metric, myelin water fraction (MWF) varied by almost a factor of 2 between two regions with myelin volume fractions that differed by only ≈ 12 %. Based on the quantitative histology, the proposed explanation for this variation was inter-compartmental water exchange, which caused the underestimation of MWF and T2 values and is, presumably, a greater factor in white matter regions where axons are small and myelin is thin. In contrast to the MET2 observations, qMT metrics were relatively constant across white matter tracts and concluded to be relatively insensitive to inter-compartmental water exchange.
Keywords: MRI, multiexponential T2, magnetization transfer, histology, myelin
INTRODUCTION
Multi-exponential T2 (MET2) and quantitative magnetization transfer (qMT) have been proposed as potential MRI-derived reporters of myelin content in white matter (WM) and nerve. With MET2, the relative size of short-lived T2 component (typically, T2 = 8 - 50 ms, depending on B0) has been defined as the myelin water fraction (MWF) and interpreted as a direct measure of myelin content (1,2). Similarly, in WM, the macromolecular protons that exchange magnetization with water protons are thought to be substantially constituents of myelin (3,4). That is, the qMT measure of this macromolecular pool size relative to the total water signal, sometimes called the pool-size-ratio (PSR) (5), is believed to be a measure of relative myelin content. While both MWF and PSR have been found to correlate with myelin content when comparing normal myelinated tissue with demyelinated or dysmyelinated tissue (6-11, and many others), the exact relationship between these measures and myelin content is not well understood.
The interpretation of MWF as a measure of myelin content is predicated on the assumption of slow exchange between myelin water and water in the intra- and inter-axonal spaces – referred to herein as other water. If the rate of exchange between myelin water and other water is dependent upon the dimensions of these compartments (i.e., axon diameter, myelin thickness, inter-axonal distance), then the slow exchange model may be more suitable in some myelinated tissues than others. For example, peripheral nerve tends to have relatively large diameter (≈ 10 μm), loosely-spaced myelinated axons with thick myelin while WM tends to have relatively small diameter (≈ 1 μm), densely packed axons that vary in dimension across the central nervous system. Similarly, the interpretation of PSR as a relatively specific measure of myelin may also be dependent upon assumptions of inter-compartmental water exchange. If macromolecules in myelin were the only contributions to magnetization transfer (MT) contrast in myelinated tissues, then inter-compartmental water exchange would be necessary to explain such contrast at echo times much longer than the T2 of myelin water. In fact, studies in excised WM (12) and nerve (13) have shown magnetization transfer contrast to be relatively independent of echo time. Of course, myelin macromolecules are not likely the exclusive source of magnetization transfer in WM, because PSR drops by only ≈ 50% from white to grey matter, but the question of the effect of inter-compartmental water exchange on PSR measurement remains.
Although there have been many studies involving normal or pathological myelinated tissue that relate metrics of the MET2 and/or MT to each other and/or to histological observations (6-11,14,15, and others), most studies have used histology only to confirm the presence of lesions and/or to qualitatively or spatially evaluate the presence of myelin. A few studies present quantitative estimates of myelin content using optical densitometry of Luxol Fast Blue stained tissue and quantitatively correlated these measures with MWF (10) and PSR (14). Optical densitometry is practical for measuring myelin content in white matter but cannot incorporate morphometric characteristics such as axon diameter and myelin thickness. A series of studies in peripheral nerve (16, and references therein) has utilized high resolution light microscopy of Toluidine Blue stained sections to provide direct cross-sectional area measurements of myelin. This approach provides visualization of axons in cross section and has also been used to investigate morphometric correlates of spinal white matter to apparent diffusion coefficients of water (17,18). Because axons serving different functions/parts of the body are grouped into tracts in the spinal cord (see Fig 1), different tracts have different micro-anatomical characteristics, making this an enticing model tissue to study the effects of micro-anatomical variations on quantitative MRI measures. The present study utilizes this model tissue to investigate the relationships between WM micro-anatomy (especially the features that may affect water exchange) and various metrics derived from MRI measures of MET2 and qMT.
Fig. 1.
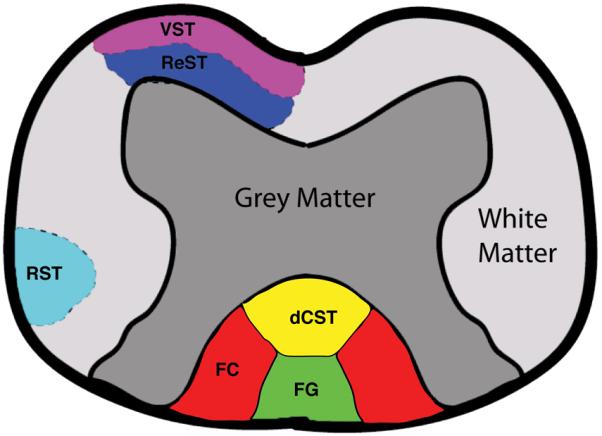
Schematic of rat spinal cord, identifying grey matter and six white matter tracts: Vestibulospinal (VST), Funiculus Cuneatus (FC), Rubrospinal (RST), Reticulospinal (ReST), Funiculus Gracilis (FG), and dorsal corticospinal (dCST).
MATERIALS AND METHODS
Tissue Preparation
Spinal cord samples were obtained (one each) from six male Sprague Dawley rats (300 - 420 g). The animals were sacrificed with inhaled CO2, the head and caudal regions were quickly removed and the spinal cord was extracted using pressure applied with a saline filled syringe at the caudal end of the vertebral column. Cervical sections, ≈ 1 cm in length, were cut and immediately placed in 0.5% paraformaldehyde/4% gluteraldehyde in phosphate buffer for 48 hours, then post-fixed for an additional 24 hours in 1% osmium tetroxide in cacodylate buffer. Samples were processed quickly and fixed (into fixative ≈ 5 min after sacrifice) to avoid effects of autolysis. The samples were then washed in phosphate-buffered saline solution for at least 3 days prior to NMR study. After NMR measurements, samples were dehydrated in graded ethanol, embedded in epoxy resin, and 1-μm thick axial sections were cut and stained with 1% Toluidine blue solution.
Microscopy
Light microscopy was performed with a Leica DM IRB inverted microscope (Meyer Instruments, Inc., Houston, TX) using a 40 × 0.55 N Plan DIC air lens. Photomicrographs were captured using a DXM1200C (Nikon, Japan) with a 1024 × 1372 pixel resolution representing a 256 μm × 343 μm tissue area. A total of six images were taken for each spinal cord sample, one of each white matter tract shown in Fig 1.
Each image was analyzed to generate estimates of myelin fraction (MF), mean myelin thickness (MyTh), and mean axon diameter (AxD). The measures of myelin thickness and axon diameter were performed manually on 40-100 randomly selected axons in each image. Axon diameters were defined as the mean of the longest and shortest distances crossing the inside of the axon through its center (manually defined). Fig 2 shows example MyTh and AxD measurements from typical images of VST and FG tracts. Myelin fraction calculation was performed semi-automatically. Each image was contrast enhanced using a combination of unsharp masking and histogram equalization, then converted to a binary image using Otsu’s thresholding as implemented in MATLAB 7.7. (Examples of small regions of the resulting binary images are shown in Fig 2). From this binary image, a relatively uniform sub-region (typically 400 × 400 pixels) was manually selected to avoid areas that included sectioning or staining artifact, the perimeter of the spinal cord, or boundaries between white matter tracts. The mean MF for each image was then defined as the fraction of black pixels in each sub-region.
Fig. 2.

top) Light microscopic images (75 μm × 55 μm) from (left-to-right) dCST, FG, ReST, RST, FC, and VST. bottom) Example quantitative histology from FG and VST tracts: filtered and thresholded images for myelin fraction (MF) calculation, and manually defined myelin thickness (MyTh) and axon diameter (AxD) measurements.
Magnetic Resonance Imaging
All imaging was performed on a 7 Tesla 16 cm bore Varian Inova scanner using an in-house built 10-mm diameter loop gap coil for radio frequency transmission and signal reception. For both MET2 and qMT imaging, a 2-mm thick slice was chosen transverse to the long-axis of the spinal cord. Images were encoded using a 64 × 64 sampling over a 5 × 5 mm2 field of view then zero-filled to 128 × 128 prior to reconstruction resulting a nominal in-plane resolution of ≈ 40 μm in each direction. For MET2 imaging, 48 spin echoes were acquired with the first echo time at 8 ms, echo spacing of 9.2 ms up to 32 echoes, then echo spacing of 50 ms for the last 16 echoes. Refocusing was achieved with 500 μs duration 90x-180y-90x composite hard pulses, each surrounded by a pair of amplitude-modulated spoiler gradients to remove signal from unwanted coherence pathways, and phase encode gradients were not rewound (19). The repetition time (TR) was 6 sec and 12 excitations were averaged, resulting in a total acquisition time of approximately 77 min.
For qMT imaging, a selective inversion-recovery prepared fast spin echo sequence (5) was used with 16 echoes, 5.6 ms echo spacing, and centric phase encoding. The selective inversion-recovery preparation was achieved with a 1 ms square pulse, which inverted the mobile water spins while leaving the macromolecular spin pool near thermal equilibrium. This sequence was repeated with 25 different inversion times pseudo-log-spaced between 3.5 ms and 10 sec. The repetition pre-delay was 3.5 s and 4 excitations were averaged, resulting in a total acquisition time of approximately 30 min.
Data Analysis
Prior to analysis, each echo image was filtered using a 3 × 3 median filter, and low SNR data were corrected for a Rician noise bias as described previously (20). For each voxel within the spinal cord, a T2 spectrum was estimated by fitting 200 decaying exponential functions (time constants ranging logarithmically between 8 ms and 500 ms) to the 48 echo magnitudes in a nonnegative least-squares (NNLS) sense and regularized with a minimum curvature constraint (21). The regularizing parameter was automatically adjusted using the generalized cross validation approach (22).
A region-of-interest (ROI) for each white matter tract was defined manually based on the schematic shown in Fig 1; an example spinal cord image (12th echo) with manually defined ROIs is shown in Fig 3a. For each sample and ROI, an average T2 spectrum was computed as the mean spectrum across voxels and the nadir between the two dominant T2 components of this spectrum was defined as the boundary between the myelin water and other water for this ROI and sample. This boundary was then used to divide myelin and other water in each spectrum (i.e., from each voxel) within the ROI and four metrics were extracted: myelin water fraction (MWF), other water fraction (OWF), myelin water T2 (MWT2) and other water T2 (OWT2). These values were then tabulated across ROIs then across samples.
Fig. 3.

a) Typical T2-weighted image showing manually drawn ROIs in grey matter and each of the six white matter tracts. b) MWF map. c) PSR map. The scale-bar on the right applies to both MWF and PSR.
For qMT processing, echo magnitudes from the 25 inversion times were fitted with a five parameter bi-exponential function
| [1] |
using a Levenberg-Marquardt method of non-linear least squares fitting. These fitted parameters were then related to the PSR and macromolecular-to-free spin transfer rate (kmf) using
| [2] |
where td (= 3.5 s) was the acquisition pre-delay and Sm ( = 0.83) was a numerically derived estimate of the macromolecular longitudinal magnetization fraction at ti = 0 (5). Finally, PSR and kmf were tabulated across ROIs then across samples.
RESULTS
Example micrographs for each of the six white matter tracts examined are shown in Fig 2. For reference, each frame displays a field of view of ≈ 55 × 75 μm2. It is apparent that the axon and myelin dimensions vary considerably between regions, with the VST region at one extreme being comprised of predominantly large axons with thick myelin and the dCST region at the other extreme having relatively small axons with thin myelin. Table 1 presents this variation quantitatively, showing the mean (± inter-sample standard deviation) of myelin fraction (MF), axon diameter (AxD), and myelin thickness (MyTh) for each tract. Note that some axons in the dCST were small enough to be poorly resolved in the optical microscopy. Because of this, it is likely that the MF in the dCST tract is under-estimated and that AxD and MyTh are slightly overestimated.
TABLE 1.
| MF | MyTh (μm) |
AxD (μm) |
MWF | MWT2 (ms) |
OWT2 (ms) |
PSR |
kmf (s−1) |
|
|---|---|---|---|---|---|---|---|---|
| VST | 0.57 (0.01) |
1.16 (0.08) |
4.47 (0.51) |
0.36 (0.06) |
13.6 (2.2) | 60.9 (4.5) | 0.23 (0.01) |
25.2 (2.5) |
| FC | 0.57 (0.02) |
1.02 (0.05) |
3.73 (0.36) |
0.34 (0.04) |
14.0 (2.1) | 56.3 (4.3) | 0.22 (0.02) |
25.2 (1.6) |
| RST | 0.58 (0.03) |
0.95 (0.03) |
3.39 (0.47) |
0.29 (0.05) |
13.0 (1.2) | 52.1 (3.2) | 0.23 (0.01) |
25.0 (1.4) |
| ReST | 0.56 (0.03) |
0.80 (0.07) |
2.22 (0.21) |
0.31 (0.05) |
12.7 (1.3) | 49.8 (3.7) | 0.24 (0.01) |
25.3 (2.1) |
| FG | 0.61 (0.02) |
0.75 (0.05) |
1.80 (0.13) |
0.31 (0.03) |
13.0 (1.2) | 50.7 (3.7) | 0.24 (0.01) |
25.0 (2.6) |
| dCST | 0.51 (0.006) |
0.52 (0.04) |
1.16 (0.10) |
0.19 (0.02) |
12.3 (0.9) | 43.9 (3.9) | 0.24 (0.01) |
24.0 (1.8) |
| GM | - | - | - | 0.03 (0.01) |
10.8 (0.6) | 48.4 (4.5) | 0.16 (0.004) |
23.6 (2.0) |
Mean (standard deviation) across samples for each white matter tract and gray matter (GM). From histology: MF, myelin fraction; MyTh, myelin thickness; AxD, axon diameter. From multi-exponential T2: MWF, myelin water fraction; MWT2, myelin water T2; OWT2, other water T2. From quantitative magnetization transfer: PSR, macromolecular pool-size ratio; kmf, macromolecular to free water magnetization transfer rate.
An example spinal cord image and the corresponding MWF and PSR maps are shown in Fig 3b and c, respectively. As expected, these images demonstrate well-defined contrast between white and grey matter in both MWF and PSR maps. The absolute contrast is greater in the MWF map, but the PSR map has greater contrast-to-noise ratio (and was acquired in less than half the time). Figure 4 shows representative T2 spectra for three different ROIs (VST, FG, and dCST), demonstrating a marked variation in the characteristics of the T2 spectrum between tracts. Extracted metrics from the T2 spectra (mean component fractions and T2s from each ROI, plus measures of inter-sample standard deviation) and the qMT analysis (PSR and kmf) are summarized in Table 1 along with measures of inter-sample variation. The relationships between various MRI-derived and histology-derived measures for each WM tract are also presented graphically in Fig 5. In frames a) and b) the ratio of MWF/MF and PSR/MF, respectively, are plotted versus both mean axon diameter and mean myelin thickness. Frames c) and d) present similar plots of MWT2 and OWT2, and frame e) shows a product of ratios, (MWF/MF)×(OF/MWF) (discussed further below) also plotted versus mean axon diameter and mean myelin thickness. Finally, although Table 1 data clearly indicate that there is no correlation between mean values of MWF and PSR across tracts, Fig 6 presents voxel-by-voxel scatter plots of MWF and PSR and linear correlation information for each WM tract.
Fig. 4.

Typical T2 spectra from 3 WM tracts (VST, FG, and dCST). Fine traces are spectra from 10 randomly chosen voxels from a given tract and the bold traces are the average of T2 spectra from every voxel in a given WM tract.
Fig. 5.

From top to bottom are plotted measures of: a) MWF/MF, b) PSR/MF, c) MWT2, d) OWT2, and e) (MWF/MF)×(OF/MWF) vs both axon diameter and myelin thickness. In each frame, triangle markers indicate the plots vs axon diameter and the top axis defines the appropriate scale. Similarly, diamond markers indicate plots vs and myelin thickness and the bottom axis defines the scale. Data from each tract are plotted with the color corresponding to their identification in Fig 1. In all cases, error bars are standard deviations across samples.
Fig. 6.
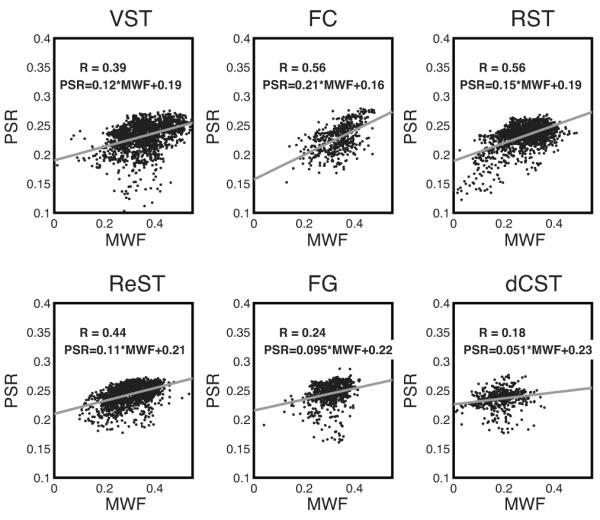
Scatter plots of PSR vs MWF for all WM tract voxels from all six spinal cord samples, presented by WM tract. In each frame is shown the best fit linear function and correlation coefficient. In all cases, linear correlations were highly significant (p << 0.01) owing to the large number of data point (≈ 1000).
The MET2-derived metrics vary considerably between the six white matter tracts: MWF range of 0.19 - 0.37, MWT2 range of 12.3 ms -14.0 ms and OWT2 range of 43.9 ms - 60.9 ms. Note that the MWFs are higher than typically seen in cerebral white matter, but comparable to a recently published study of rat spinal white matter, also at 7T (23). Note also that, although not shown in Table 1, the proton densities – the integral sum of the entire T2 spectrum – in WM, averaged across animals and tracts, was 86.7% of that in grey matter and ranged by 0.7% across tracts. That is, the proton density was essentially constant across tracts and was in close agreement with a literature value of 87.8% (24). Also shown in Fig 3 is a typical PSR map and values of PSR and kmf for each white matter tract are summarized in Table 1. The values of kmf are similar to previously published (5), but the PSR values are about 50% higher than recently reported human spinal WM (25). It is possible that the differences are due to chemical fixation; Schmierer et al. found that PSR increased ≈ 50% due to formalin fixation but remained well correlated with myelin content, as determined by histology (15). Note that, in contrast to the metrics from the T2 spectra, the PSR and kmf values are relatively constant across all white matter tracts. Neither the MWF nor the PSR was significantly correlated with MF across tracts (p = 0.76 and 0.46, respectively) but Fig 5 demonstrates a more prominent relationship between MET2 metrics and axon diameter and myelin thickness. Each frame in Fig 5 except b) (PSR/MF) demonstrates linear trends (p < 0.05) between mean MRI metrics and mean histological measures.
DISCUSSION
Spinal cord is an attractive model tissue for investigating the relationship between white matter micro-anatomy and contrast in MRI. Qualitative differences between different white matter tracts are readily apparent in the micrographs shown in Figure 2 and these images are similar to previously published histology of rat spinal cord (17,18). The quantitative measurements derived from the micrographs and presented in Table 1 demonstrate the same relative dimensions and densities of axons and myelin between white matter tracts as the previous studies, although there is some variation in the absolute values of these measurements. For example, Chin et al. (17) found average axon diameters of 1.1 μm and 2.7 μm in the FG and FC tracts, respectively, compared to 1.8 μm and 3.7 μm in the present study. Measurements such as these are prone to bias resulting from numerous sources, such a tissue shrinkage during preparation for histology, variation in optical image contrast and threshold, and axon sampling bias. For the analysis herein, the absolute values of axon diameter and myelin thickness are less important than the relative values of these metrics between different white matter tracts, which are consistent with the previous work.
Comparing the MF derived from histology to the MWF and PSR measurements did not reveal a positive correlation as one might expect; however the variation of MF across WM tracts was relatively small and perhaps not enough to result in significant variation in MWF or PSR. Previous studies have quantitatively correlated the MWF and/or PSR with measured MF and found significant positive correlations (6,10,14-16,26,27), but these studies also included regions/samples of demyelination or dysmyelination. Inspection of data from one such study (16, cf 3) reveals that amongst measures from normal tissue, no correlation is seen between MWF or PSR and myelin content. Also, while MWF and PSR are both thought to report on myelin content, a previous study did not find a high correlation between these (or related) metrics in WM (6). These observations all point to the possibility that MWF and/or PSR variation is due to more than simply variation in myelin content. Sled et al. postulated that the differences between observed values of MWF and PSR in a study of human brain might be due to regional variation in axon diameter and, consequently, inter-compartmental water exchange rates (28). More recently, this same group has presented a simulation study demonstrating the differential influences of exchange on MET2 and qMT measurements (29).
The properties of MET2 are well known to be affected by inter-compartmental water exchange (30). The components of a T2 spectrum derived from a two-pool model reflect intrinsic pool sizes and relaxation times in the absence of inter-compartmental water exchange; however, when exchange cannot be neglected, all components of the T2 spectrum shift to shorter T2 values and the pool sizes of the short- and long-T2 components under- and over-estimate the water pool sizes, respectively. Fig 7 depicts this effect in a hypothetical model system, consisting of two pools with volumes = 0.55 and 0.45 ml, (based on the data in Table 1), water proton densities of 0.44 and 0.82 g/ml (based on estimate of water density in white matter myelin and non-myelin regions (24) and resulting equilibrium magnetizations proportional to 0.24 and 0.37 g of water), and intrinsic T2s of 15 ms and 65 ms (based on data in Table 1). With these model parameters and a mean short-T2 pool water lifetime chosen between 40 ms and 500 ms, Bloch-McConnell equations were solved to generate transverse magnetization decays, from which T2 spectra and MWF values were estimated, as shown in the Fig 7. Note, that this mathematical treatment of a two-pool system assumes that each pool is well-mixed at all times, which may be a significant over-simplification for tissues such as myelin with relatively slow intrinsic water diffusion characteristics (31). Nonetheless, in the context of myelinated tissue, it is reasonable to postulate that water in smaller compartments — smaller axons and thinner myelin — will have a shorter average lifetime within these compartments, which is equivalent to faster inter-compartmental exchange rates. Alternative mathematical treatments that explicitly include characteristics of water diffusion and tissue geometry (32) offer the potential for a more sophisticated analysis, but will lead to the same general outcome: smaller compartments will result in a more mono-exponential relaxation. Thus, the T2 spectrum from white matter with small, densely packed axons and thin myelin may underestimate the myelin content and report short T2 times for both myelin and other water.
Fig. 7.
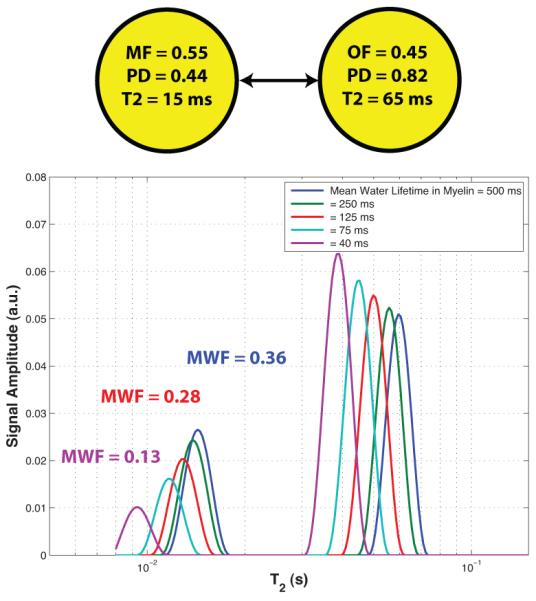
top) A model two-pool system with volumes = 0.55 and 0.45, water proton densities of 0.44 and 0.82, intrinsic T2s of 15 ms and 65 ms, and exchange defined by mean lifetimes in the short-lived pool (representing myelin) ranging from 40 ms to 500 ms. bottom). The T2 spectra for five different mean myelin water lifetimes and the MWF values extracted from three of these spectra (indicated by matching color with legend).
The observations herein, Table 1 and Fig 5, in particular, are consistent with exchange-mediated variation in the T2 spectrum across different WM tracts. This is true not simply for the trend of reduced MWF and MWF/MF ratio in tracts with smaller axons and thinner myelin, but also with the trend of reduced T2 times – particularly noticeable for OWT2 – with the same decreasing dimensions. These observations do not provide sufficient information to completely invert a two-pool model of WM water including exchange, but from the data we can make some estimates of the axon and myelin dimensions necessary to satisfy a slow exchange model. Consider the WM water proton NMR signal to be proportional to ρmνm + ρoνo, where ρ and ν are water density and volume, respectively, and subscripts, m and o, indicate the myelin and other water compartments. From this, in the slow exchange limit, MWF = ρmνm/(ρmνm + ρoνo), MF = νm/(νm + νo), and likewise for OWF and OF. From here it is easy to see that (MWF/MF)×(OWF/OF) = ρm/ρo, which has been reported ≈ 0.5 from chemical analysis (24). Figure 5e shows the values of (MWF/MF)×(OWF/OF) for each of the six WM tracts plotted against myelin thickness and axon diameter. The dashed line indicates the value of 0.5 expected in a tissue described by a slow exchange model, and observations from all six WM tracts fall below this line. If we assume that water density in the myelin and other tissue compartments is approximately constant, the reduced apparent values of ρm/ρo can be explained by the effects of exchange causing an underestimation of MWF. The WM tract with the larges axons (AxD = 4.47 μm) and myelin (MyTh = 1.16 μm) show an apparent ρm/ρo ≈ 0.42, indicating that this tract is close to satisfying a slow exchange model, and from the data trend in the graph one can estimate that the apparent ρm/ρo would reach the theoretical value of 0.5 for AxD > ≈ 5 μm.
While the data support the interpretation that exchange mediates transverse relaxation in WM tracts of excised and fixed rat spinal cord, the relationship between these observations and WM water relaxation in-vivo is less clear. Two factors that are likely to effect observations presented herein are temperature and chemical fixation. Between mammalian temperature in vivo (≈ 37 °C) and bore temperature for the present studies (≈ 18 °C), the diffusion coefficient of free water drops by ≈ 40 %. Although the exact impact of this temperature dependence on water dynamics in tissue is not clear, it is reasonable to postulate that inter-compartmental water exchange rates are up to ≈ 50% lower in the present studies compared to in vivo. Indeed, studies of freshly excised bovine white matter at 37 °C and 24 °C, concluded that there was approximately a 2-fold difference in water exchange rates (33). If this were the only factor, one would conclude that water exchange must bias MET2 estimates of MWF in vivo to an even greater extent than observed herein. Indeed, in rat spinal cord, Kozlowski et al. found MWF of 32-35 % in vitro and 24 % in vivo, which may reflect and increased influence of exchange on the T2 spectrum in vivo (23). However, other studies of T2 and/or MET2 between in vitro have found similar MWF values to those typically seen in vivo (10,34).
In addition to temperature, the effects of chemical fixation may also alter both intrinsic T2s and water exchange rates. Chemical fixation is well known to reduce T2, but this effect is largely reversed if the fixative is washed out of the sample prior to NMR investigation (35,36). The effects of fixation on water diffusion and membrane permeability is less clear in the literature, but a recent well-controlled study presents diffusion-weighted imaging of rat cortical slices in a fresh state, and chemical fixed with three different chemical preparations (36). This study concluded that intra-/extra-cellular exchange rate increased by ≈ 240 % due to fixation with 4% formaldehyde but did not change significantly due to 4% glutaraldehyde fixation. The present work used 0.5% formaldehyde with 4% glutaraldehyde, which may have resulted in an intermediate increase in water exchange rates. Thus, although the exact effects of both temperature and chemical fixation are not known, they are expected to result in competing effects of roughly similar magnitude. We postulate that the net effect is that the fixed tissue studied herein had similar or perhaps slower inter-compartmental water exchange rate compared to normal tissue in vivo.
Given this interpretation, it may be that MWF values from human cerebral white matter (typically ≈ 0.11) are substantial underestimates of the actual myelin water fraction. Minty et al. raised this possibility, when they observed much higher MWF in spinal cord compared to cerebral white matter and noted that axons are more densely packed in the corpus callosum than in spinal white matter (37) (and references therein). In human cerebral WM, Whittall et al. found MWF of 0.11 on average, with significant variation across regions (38). This study showed significantly higher MWF and longer OWT2 in the splenium as compared to the genu, and postmortem histology of human brains has found larger median axon diameter in splenium (1.0 μm) than in the genu (0.6 μm) (39). The same histology study, however, also found more unmyelinated fibers in the genu, which may also contribute its lower MWF. Also, the interpretation that the difference between MWF in cerebral and spinal WM is entirely due to exchange is somewhat in contrast to two in vitro experimental studies that modeled white matter with four-pools and concluded that exchange resulted in MWF underestimation by only ≈ 20% in fresh bovine white matter at 37 °C (33) and ≈ 25 % in fresh bovine optic nerve at 20 °C (40).
In contrast to the MET2 observations, the qMT observations exhibit essentially no sensitivity to the micro-anatomical variation between WM tracts in the spinal cord. Again, in agreement with the aforementioned simulation study (29), these observations indicate that PSR and other qMT metrics are not particularly sensitive to the rate of inter-compartmental water exchange, at least over the range of apparent rates covered by the different WM tracts of the rat spinal cord. This difference in sensitivity between qMT and MET2 may explain the relatively poor correlation between PSR or MTR and MWF in previous work (6) (and references therein). Indeed, Table 1 data demonstrate that the correlation between PSR and MWF is relatively poor when looking between WM tracts, but, as seen in Fig 6, stronger on a pixel-by-pixel basis when looking within a given tract. This observation is in accord with voxel-by-voxel comparison of MTR and MWF across regions of cerebral WM presented by Laule et al. (41). We postulate that for a given tract, the axon and myelin dimensions dictate the inter-compartmental water exchange rate and, in-turn, the slope of the PSR-MWF correlation. This observation suggests that PSR, although apparently less specific for myelin, may be a more robust metric than MWF for measuring changes in myelin content within a tissue or differences in myelin content between tissues. Conversely, MET2 and derivative metrics including MWF and OWT2, has the potential to be more informative than qMT of the micro-anatomical characteristics of white matter, such as axon diameter and myelin thickness.
CONCLUSIONS
Two quantitative MRI methods for characterizing neural tissue and, in particular, measuring myelin content, MET2 and qMT, exhibit distinctly different sensitivity to the dimensions of microstructure in spinal white matter. In comparing measures across six WM tracts, MET2 characteristics varied substantially while the qMT characteristics remained close to constant. In tracts with smaller axons and thinner myelin, MET2 exhibited shorter T2 values and a smaller myelin water fraction than it did in tracts with larger axons and thicker myelin but similar myelin content. These observations indicate that inter-compartmental water exchange mediates transverse relaxation in spinal white matter. The extension of these finding to clinical imaging is unclear, but indications are that exchange may be an equal or greater factor in human cerebral white matter in vivo. In contrast, qMT appears relatively insensitive to micro-anatomical variation in healthy spinal white matter, making it a potentially more robust measure of myelin content, although perhaps a less informative measure of white matter microstructure, in general.
Acknowledgments
Grant Sponsor: NIH #EB001744, #EB001452, and NSF # 0448915.
Footnotes
This work was presented, in part, at the 17th Scientific Meeting and Exhibition of the ISMRM, Honolulu, 2009.
REFERENCES
- 1.MacKay A, Whittall K, Adler J, Li D, Paty D, Graeb D. In vivo visualization of myelin water in brain by magnetic resonance. Magn Reson Med. 1994;31(6):673–677. doi: 10.1002/mrm.1910310614. [DOI] [PubMed] [Google Scholar]
- 2.Menon RS, Rusinko MS, Allen PS. Proton relaxation studies of water compartmentalization in a model neurological system. Magn Reson Med. 1992;28(2):264–274. doi: 10.1002/mrm.1910280208. [DOI] [PubMed] [Google Scholar]
- 3.Koenig SH, Brown RD, Spiller M, Lundbom N. Relaxometry of Brain - Why White Matter Appears Bright in Mri. Magnetic Resonance in Medicine. 1990;14(3):482–495. doi: 10.1002/mrm.1910140306. [DOI] [PubMed] [Google Scholar]
- 4.Kucharczyk W, Macdonald PM, Stanisz GJ, Henkelman RM. Relaxivity and Magnetization-Transfer of White-Matter Lipids at Mr-Imaging - Importance of Cerebrosides and Ph. Radiology. 1994;192(2):521–529. doi: 10.1148/radiology.192.2.8029426. [DOI] [PubMed] [Google Scholar]
- 5.Gochberg DF, Gore JC. Quantitative magnetization transfer imaging via selective inversion recovery with short repetition times. Magn Reson Med. 2007;57(2):437–441. doi: 10.1002/mrm.21143. [DOI] [PMC free article] [PubMed] [Google Scholar]
- 6.Tozer DJ, Davies GR, Altmann DR, Miller DH, Tofts PS. Correlation of apparent myelin measures obtained in multiple sclerosis patients and controls from magnetization transfer and multicompartmental T2 analysis. Magn Reson Med. 2005;53(6):1415–1422. doi: 10.1002/mrm.20479. [DOI] [PubMed] [Google Scholar]
- 7.Stewart WA, MacKay AL, Whittall KP, Moore GR, Paty DW. Spin-spin relaxation in experimental allergic encephalomyelitis. Analysis of CPMG data using a non-linear least squares method and linear inverse theory. Magn Reson Med. 1993;29(6):767–775. doi: 10.1002/mrm.1910290608. [DOI] [PubMed] [Google Scholar]
- 8.Stanisz GJ, Midha R, Munro CA, Henkelman RM. MR properties of rat sciatic nerve following trauma. Magn Reson Med. 2001;45(3):415–420. doi: 10.1002/1522-2594(200103)45:3<415::aid-mrm1054>3.0.co;2-m. [DOI] [PubMed] [Google Scholar]
- 9.Ou XW, Sun SW, Liang HF, Song SK, Gochberg DF. Quantitative Magnetization Transfer Measured Pool-Size Ratio Reflects Optic Nerve Myelin Content in Ex Vivo Mice. Magnetic Resonance in Medicine. 2009;61(2):364–371. doi: 10.1002/mrm.21850. [DOI] [PMC free article] [PubMed] [Google Scholar]
- 10.Laule C, Leung E, Lis DK, Traboulsee AL, Paty DW, MacKay AL, Moore GR. Myelin water imaging in multiple sclerosis: quantitative correlations with histopathology. Mult Scler. 2006;12(6):747–753. doi: 10.1177/1352458506070928. [DOI] [PubMed] [Google Scholar]
- 11.Does MD, Snyder RE. Multiexponential T2 relaxation in degenerating peripheral nerve. Magn Reson Med. 1996;35(2):207–213. doi: 10.1002/mrm.1910350212. [DOI] [PubMed] [Google Scholar]
- 12.Harrison R, Bronskill MJ, Henkelman RM. Magnetization transfer and T2 relaxation components in tissue. Magn Reson Med. 1995;33(4):490–496. doi: 10.1002/mrm.1910330406. [DOI] [PubMed] [Google Scholar]
- 13.Does MD, Beaulieu C, Allen PS, Snyder RE. Multi-component T1 relaxation and magnetisation transfer in peripheral nerve. Magn Reson Imaging. 1998;16(9):1033–1041. doi: 10.1016/s0730-725x(98)00139-8. [DOI] [PubMed] [Google Scholar]
- 14.Schmierer K, Tozer DJ, Scaravilli F, Altmann DR, Barker GJ, Tofts PS, Miller DH. Quantitative magnetization transfer imaging in postmortem multiple sclerosis brain. J Magn Reson Imaging. 2007;26(1):41–51. doi: 10.1002/jmri.20984. [DOI] [PMC free article] [PubMed] [Google Scholar]
- 15.Schmierer K, Wheeler-Kingshott CAM, Tozer DJ, Boulby PA, Parkes HG, Yousry TA, Scaravilli F, Barker GJ, Tofts PS, Miller DH. Quantitative magnetic resonance of postmortem multiple sclerosis brain before and after fixation. Magnetic Resonance in Medicine. 2008;59(2):268–277. doi: 10.1002/mrm.21487. [DOI] [PMC free article] [PubMed] [Google Scholar]
- 16.Odrobina EE, Lam TY, Pun T, Midha R, Stanisz GJ. MR properties of excised neural tissue following experimentally induced demyelination. NMR Biomed. 2005;18(5):277–284. doi: 10.1002/nbm.951. [DOI] [PubMed] [Google Scholar]
- 17.Chin CL, Wehrli FW, Fan Y, Hwang SN, Schwartz ED, Nissanov J, Hackney DB. Assessment of axonal fiber tract architecture in excised rat spinal cord by localized NMR q-space imaging: simulations and experimental studies. Magn Reson Med. 2004;52(4):733–740. doi: 10.1002/mrm.20223. [DOI] [PubMed] [Google Scholar]
- 18.Schwartz ED, Chin CL, Shumsky JS, Jawad AF, Brown BK, Wehrli S, Tessler A, Murray M, Hackney DB. Apparent diffusion coefficients in spinal cord transplants and surrounding white matter correlate with degree of axonal dieback after injury in rats. AJNR Am J Neuroradiol. 2005;26(1):7–18. [PMC free article] [PubMed] [Google Scholar]
- 19.Poon CS, Henkelman RM. Practical T2 quantitation for clinical applications. J Magn Reson Imaging. 1992;2(5):541–553. doi: 10.1002/jmri.1880020512. [DOI] [PubMed] [Google Scholar]
- 20.Bonny JM, Renou JP, Zanca M. Optimal measurement of magnitude and phase from MR data. Journal of Magnetic Resonance Series B. 1996;113(2):136–144. doi: 10.1006/jmrb.1996.0166. [DOI] [PubMed] [Google Scholar]
- 21.Whittall KP, MacKay AL. Quantitative interpretation of NMR relaxation data. J Magn Reson. 1989;84(1):134–152. [Google Scholar]
- 22.Golub GH, Heath M, Wahba G. Generalized Cross-Validation as a Method for Choosing a Good Ridge Parameter. Technometrics. 1979;21(2):215–223. [Google Scholar]
- 23.Kozlowski P, Liu J, Yung AC, Tetzlaff W. High-resolution myelin water measurements in rat spinal cord. Magnetic Resonance in Medicine. 2008;59(4):796–802. doi: 10.1002/mrm.21527. [DOI] [PubMed] [Google Scholar]
- 24.Knaap MSvd, Valk J, Barkhof F. Magnetic resonance of myelination and myelin disorders. xvi. Springer; Berlin ; New York: 2005. p. 1084. [Google Scholar]
- 25.Smith SA, Golay X, Fatemi A, Mahmood A, Raymond GV, Moser HW, van Zijl PCM, Stanisz GJ. Quantitative Magnetization Transfer Characteristics of the Human Cervical Spinal Cord In Vivo: Application to Adrenomyeloneuropathy. Magnetic Resonance in Medicine. 2009;61(1):22–27. doi: 10.1002/mrm.21827. [DOI] [PMC free article] [PubMed] [Google Scholar]
- 26.Webb S, Munro CA, Midha R, Stanisz GJ. Is multicomponent T2 a good measure of myelin content in peripheral nerve? Magn Reson Med. 2003;49(4):638–645. doi: 10.1002/mrm.10411. [DOI] [PubMed] [Google Scholar]
- 27.Stanisz GJ, Webb S, Munro CA, Pun T, Midha R. MR properties of excised neural tissue following experimentally induced inflammation. Magn Reson Med. 2004;51(3):473–479. doi: 10.1002/mrm.20008. [DOI] [PubMed] [Google Scholar]
- 28.Sled JG, Levesque I, Santos AC, Francis SJ, Narayanan S, Brass SD, Arnold DL, Pike GB. Regional variations in normal brain shown by quantitative magnetization transfer imaging. Magn Reson Med. 2004;51(2):299–303. doi: 10.1002/mrm.10701. [DOI] [PubMed] [Google Scholar]
- 29.Levesque I, Pike GB. Characterizing Healthy and Diseased White Matter Using Quantitative Magnetization Transfer and Multicomponent T2 Relaxometry: A Unified View via a Four-Pool Model. Magn Reson Med. 2009 doi: 10.1002/mrm.22131. [DOI] [PubMed] [Google Scholar]
- 30.Zimmerman JR, Brittin WE. Nuclear Magnetic Resonance Studies in Multiple Phase Systems: Lifetime of a Water Molecules in an Adsorbing Phase on Silica Gel. Journal of Physical Chemistry. 1957;61:1328–1333. [Google Scholar]
- 31.Andrews TJ, Osborne MT, Does MD. Diffusion of myelin water. Magn Reson Med. 2006;56(2):381–385. doi: 10.1002/mrm.20945. [DOI] [PubMed] [Google Scholar]
- 32.Brownstein KR, Tarr CE. Importance of Classical Diffusion in Nmr-Studies of Water in Biological Cells. Physical Review A. 1979;19(6):2446–2453. [Google Scholar]
- 33.Bjarnason TA, Vavasour IM, Chia CL, MacKay AL. Characterization of the NMR behavior of white matter in bovine brain. Magn Reson Med. 2005;54(5):1072–1081. doi: 10.1002/mrm.20680. [DOI] [PubMed] [Google Scholar]
- 34.Moore GR, Leung E, MacKay AL, Vavasour IM, Whittall KP, Cover KS, Li DK, Hashimoto SA, Oger J, Sprinkle TJ, Paty DW. A pathology-MRI study of the short-T2 component in formalin-fixed multiple sclerosis brain. Neurology. 2000;55(10):1506–1510. doi: 10.1212/wnl.55.10.1506. [DOI] [PubMed] [Google Scholar]
- 35.D’Arceuil HE, Westmoreland S, de Crespigny AJ. An approach to high resolution diffusion tensor imaging in fixed primate brain. Neuroimage. 2007;35(2):553–565. doi: 10.1016/j.neuroimage.2006.12.028. [DOI] [PubMed] [Google Scholar]
- 36.Shepherd TM, Thelwall PE, Stanisz GJ, Blackband SJ. Aldehyde fixative solutions alter the water relaxation and diffusion properties of nervous tissue. Magn Reson Med. 2009;62(1):26–34. doi: 10.1002/mrm.21977. [DOI] [PMC free article] [PubMed] [Google Scholar]
- 37.Minty EP, Bjarnason TA, Laule C, MacKay AL. Myelin Water Measurement in the Spinal Cord. Magnetic Resonance in Medicine. 2009;61(4):883–892. doi: 10.1002/mrm.21936. [DOI] [PubMed] [Google Scholar]
- 38.Whittall KP, MacKay AL, Graeb DA, Nugent RA, Li DK, Paty DW. In vivo measurement of T2 distributions and water contents in normal human brain. Magn Reson Med. 1997;37(1):34–43. doi: 10.1002/mrm.1910370107. [DOI] [PubMed] [Google Scholar]
- 39.Aboitiz F, Scheibel AB, Fisher RS, Zaidel E. Fiber Composition of the Human Corpus-Callosum. Brain Research. 1992;598(1-2):143–153. doi: 10.1016/0006-8993(92)90178-c. [DOI] [PubMed] [Google Scholar]
- 40.Stanisz GJ, Kecojevic A, Bronskill MJ, Henkelman RM. Characterizing white matter with magnetization transfer and T(2) Magn Reson Med. 1999;42(6):1128–1136. doi: 10.1002/(sici)1522-2594(199912)42:6<1128::aid-mrm18>3.0.co;2-9. [DOI] [PubMed] [Google Scholar]
- 41.Laule C, Vavasour IM, Paty D, Li D, Arnold DL, MacKay A. Correlation between magnetization transfer and myelin water content in normal white matter and MS lesions. Honolulu, HI: 2002. [Google Scholar]