Abstract
MR acoustic radiation force imaging (MR-ARFI) provides a promising method to monitor therapeutic ultrasound treatments. By measuring the displacement induced by the acoustic radiation force, MR-ARFI can locate the focal spot without a significant temperature rise. In this work, the encoding gradient for MR-ARFI is optimized to achieve an enhanced accuracy and precision of the displacement measurement. By analyzing the sources of artifacts, bulk motion and eddy currents are shown to introduce errors to the measurement, and heavy diffusion-weighting is shown to result in noisy displacement maps. To eliminate these problems, a new encoding scheme is proposed which utilizes a pair of bipolar gradients. Improved precision is achieved with robustness against bulk motion and background phase distortion, and improved accuracy is achieved with reduced diffusion-weighting and optimized encoding pulse width. The experiment result shows that the signal-to-noise ratio can be enhanced by more than two fold. These significant improvements are obtained at no cost of scan time or encoding sensitivity, enabling the detection of a displacement less than 0.l µm in a gel phantom with MR-ARFI.
Keywords: HIFU, acoustic radiation force imaging, magnetic resonance, MR-ARFI
Introduction
High intensity focused ultrasound (HIFU) has shown to be effective in the treatment of solid masses such as uterine fibroids (1–3). Additionally, it is under investigation for the treatment of a number of other diseases, such as prostate cancer (4, 5), and breast cancer (6–8). For these thermal treatments, the role of imaging is threefold: targeting, temperature monitoring, and post-treatment verification. Magnetic resonance imaging can fill all three roles with exquisite soft tissue contrast. Another class of HIFU treatments is under investigation in which the ultrasound is applied with relatively high power and low duty cycle, in order to mechanically interact with the target, without the intention of heating the tissue. Examples include opening the blood-brain barrier (9–11), sonoporation (12, 13), and targeted drug delivery via liposomes (14, 15). Here, the use of MRI in monitoring has been limited. However, acoustic radiation force imaging (ARFI) is a promising new method that may provide a means for monitoring low duty cycle pulsed HIFU with MRI. Recently, radiation force induced displacement was used to correct the phase aberration in rat brain (16–18).
ARFI relies on the fact that when high intensity focused ultrasound (HIFU) is applied to tissue, the acoustic radiation force will result in a displacement at the focal spot (19). A substantial amount of work has been performed with ultrasound imaging based on ultrasonic correlation, where both spatial and temporal tissue responses can be monitored (20–27). As a method to map mechanical tissue properties, ultrasound ARFI has been used for a variety of clinical imaging applications, including assessing ablated tissue (25, 26), and visualizing abdominal malignancies (27). On the other hand, focused ultrasound has been used to generate shear waves in MR elastography studies, and the induced displacement at the focus has been measured (28–32). Subsequently, McDannold, developed a magnetic resonance version (MR-ARFI) (33), based on previous work by Plewes et. al. (34). This used a pair of Stejskal-Tanner gradients to encode the displacement into the phase (33). With a displacement on the order of microns, it is necessary to use sensitizing gradients of large amplitude and duration, with significant diffusion-weighting. Unfortunately, the large gradients render the method susceptible to bulk motion, loss of signal-to-noise ratio (SNR), and eddy current artifacts. The latter artifacts are manifested as a nonlinear background phase perturbing the displacement measurement (33).
In this paper, we optimize the encoding gradients for MR-ARFI to improve the precision and accuracy of the displacement measurement. We first investigate the possible causes of several artifacts in MR-ARFI. With the knowledge obtained, we then provide a solution to eliminate those artifacts. The uncertainty of the displacement is analyzed, and the enhanced image quality is demonstrated in theoretical simulation and phantom experiments.
Methods and Theory
Image Acquisition
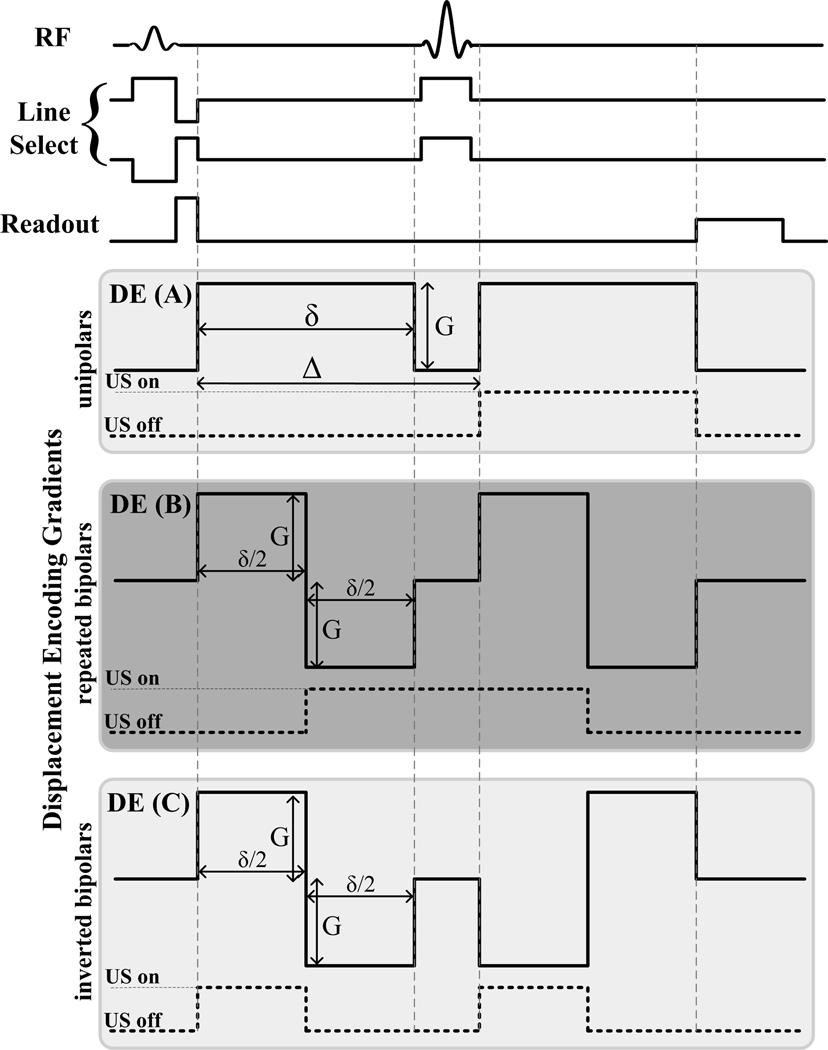
A line scan diffusion-weighted imaging (LSDI) sequence was used as the MR-ARFI pulse sequence (35), shown in Fig.1. Imaging was performed on a 3T GE Signa MR scanner (GE Healthcare, Milwaukee, WI, USA) equipped with an MR-compatible HIFU system (InSightec, Israel). Three different sets of displacement encoding gradients (DE) were used. The first set was similar to that used by McDannold et. al. and used in the first set of experiments to evaluate image artifacts. This set consisted of a pair of Stejskal-Tanner (unipolar) gradients placed around the 180° refocusing pulse, with an amplitude G of 40 mT/m and the pulse width of 18 ms, as illustrated in Fig. 1. The body coil was used to transmit and a 5-inch circular surface coil was used to receive the signal. The following imaging parameters were used: TE/TR = 69/500 ms, FOV = 24×3 cm, matrix size = 256×31, slice thickness = 5 mm, bandwidth = 7.81 kHz, NEX = 5. The raw data were reconstructed offline into a magnitude image and a phase image using Matlab (Mathworks, Natick, MA). Images were acquired in pairs, with identical pulse timing and imaging parameters, but with opposite polarity of the displacement encoding gradients.
Figure 1.
Illustration of the three displacement encoding (DE) gradient sets used and the timing of the sonications.
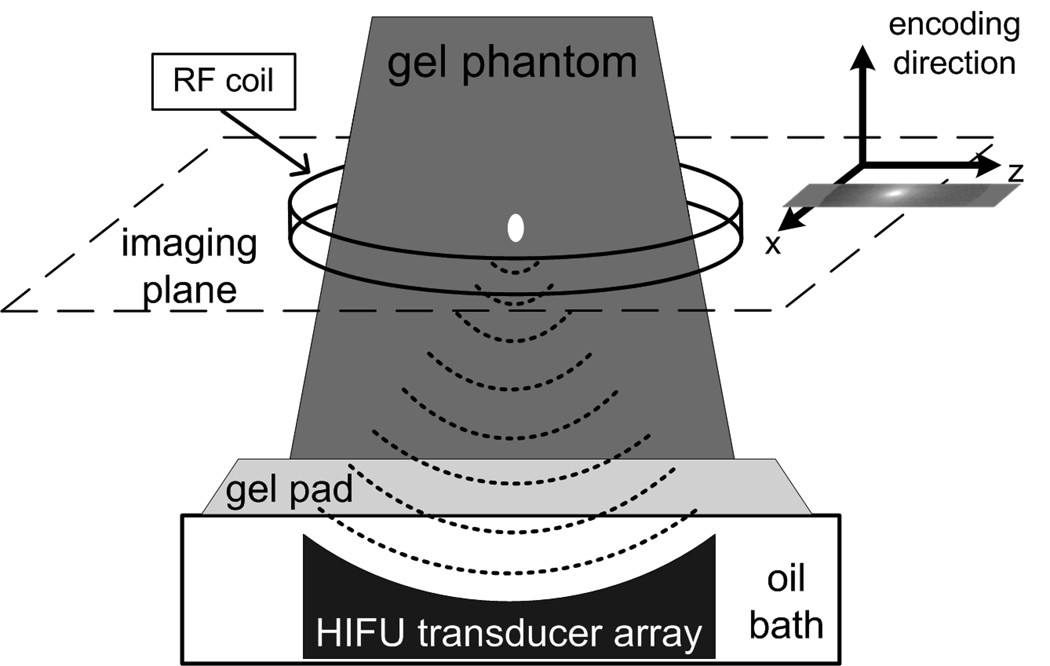
A trigger signal was generated by the imaging sequence and fed to the HIFU system. The trigger synchronized the HIFU system to emit ultrasound pulses coincident with the encoding gradient, as plotted by the dashed lines in Fig.1. The experimental setup is illustrated in Fig. 2. For experiments with sound on, the 1.0 MHz HIFU transducer was focused at a depth of 12 cm in a gel phantom (DQA Gel Phantom, ATS Laboratories, Bridgeport, CT) with mode 0. In mode 0, there is no phase shift over the sectors of the transducer array, creating a single concentrated focus. The ultrasound duty cycle was kept at less than 5% by keeping the TR at 500 ms.
Figure 2.
MR-ARFI experimental setup. A coronal plane is acquired through the center of the focal spot, with the encoding gradient applied along the direction of the acoustic wave propagation.
To test the temperature change due to sonication, SPGR images (TE/TR=13/26 ms, bandwidth = 31.5 kHz, matrix size = 256×128, slice thickness = 2 mm, NEX = 1) were obtained before and immediately after acquisition of the MR-ARFI images.
Displacement Map Reconstruction
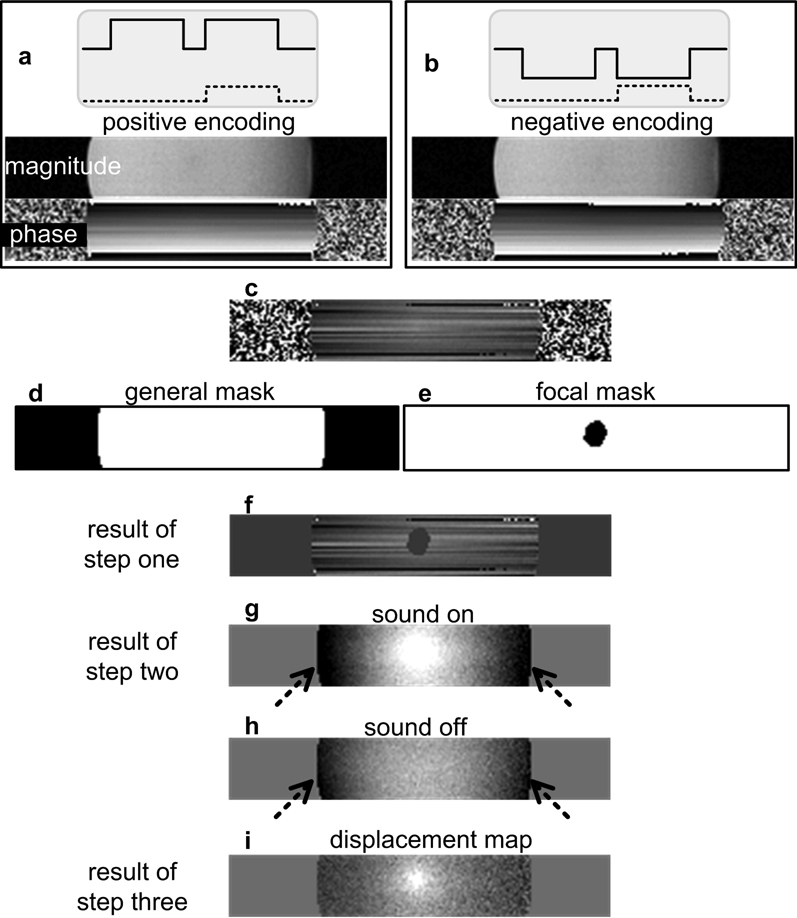
To extract the displacement map from the phase image, a three-step algorithm is performed on the pairs of images acquired with opposite displacement encoding polarity, as shown in Fig. 3.
Figure 3.
The outcome of the 3-step reconstruction on the acquisition using unipolar gradients (solid lines) with the corresponding sonication scheme (dashed lines). (a) and (b) are a pair of images acquired with opposite polarity of the encoding gradient, and (c) is the phase difference of (a) and (b). A faint focal spot in (c) is almost hidden by the linear phase artifact caused by the bulk motion. Applying the general mask (d) and the focal mask (e) to (c), and the result (f) is processed in step two. After removing the constant and linear terms from each line, the sonication induced displacement presents on (g) on top of the background phase (arrows). The background phase appears to be second order variation with position. Subtracting the baseline image (h) which is obtained with the sound off yields the displacement map (i).
Step one
The difference of each pair of phase images is taken. Two masks are applied to the phase difference. The first one is a general mask, which is obtained by thresholding the magnitude image to segment the phantom from the background air. Another mask, called the focal mask, is generated by manually selecting a region slightly larger than the focal spot.
Step two
A linear regression is performed on the doubly-masked phase difference image. The regression is done line-by-line in the readout direction using least-squares curve fitting. The resulting constant and linear phase terms are then removed from each line.
Optional Step three
Phase data acquired with the sound off are used as the baseline, and subtracted from phase data acquired with sound on.
The residual phase (φ) is the displacement map, which is proportional to the acoustic radiation force induced displacement with sensitivity of α µm/radian. Assuming that the displacement (d) is instantaneous, thus stationary during the encoding gradient, α is given by
| [1] |
where γ is the gyromagnetic ratio, given by γ / 2π= 42.57 MHz/Tesla, and G and δ are the amplitude and pulse width of the encoding gradient, respectively.
Elucidation of Background Phase Artifact
To elucidate the contribution of bulk motion to background phase artifacts in MR-ARFI, an experiment was designed to isolate the phantom from the table vibration during the scan. The “motion-free” system included hanging the phantom from a wood board suspended through the magnet, between two aluminum platforms on either end of the magnet. The platforms were not touching the magnet or the table. The gel phantom was positioned in a similar part of the magnet as during the other experiments. Due to the restriction of the setup, the body coil was used for transmit and receive. The image acquired using the “motion-free” system was compared to the one acquired with conventional setup to illustrate the effect of bulk motion.
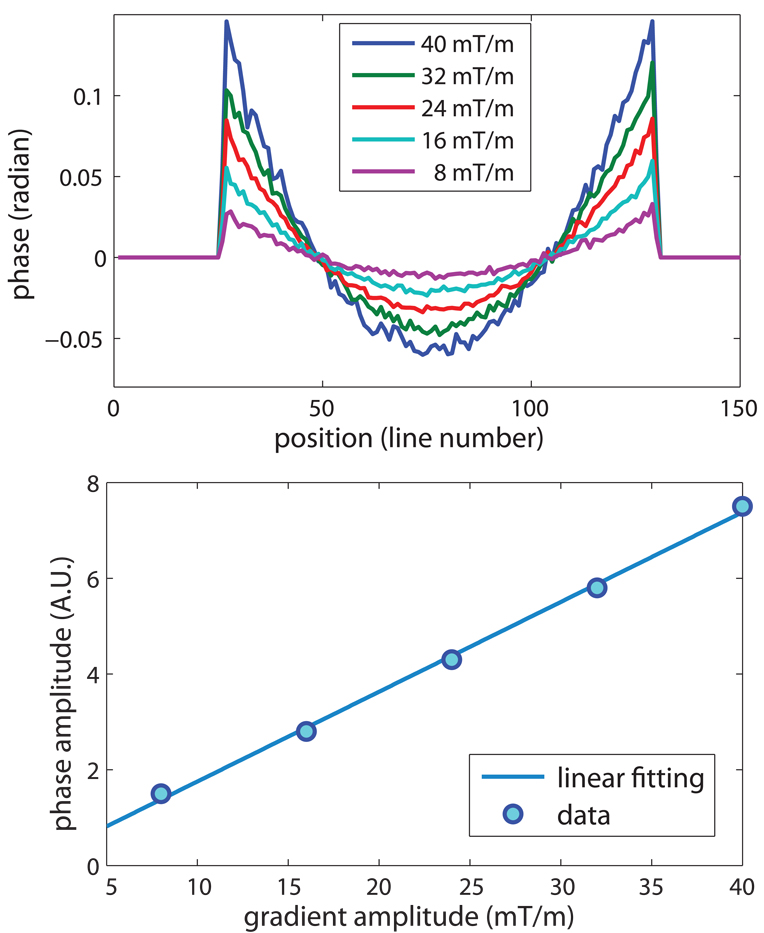
To demonstrate the influence of eddy currents to the background phase artifacts, phase difference maps were acquired with the amplitude of the unipolar gradient stepped from 8 mT/m to 40 mT/m. The timing of the gradients was fixed, so the gradient slew rate changed from 8.7 T/m/s to 43.48 T/m/s, and all other imaging parameters were the same as described before. Steps one and two of the reconstruction were performed, but not step three, to yield the baseline images. The background phase was then measured and correlated with the gradient amplitude.
Optimized displacement-encoding gradients
To reduce the eddy-current-induced contribution to the phase artifact, two different sets of encoding gradients were investigated: the repeated bipolar, as plotted in Fig. 1 DE(B), and the inverted bipolar in DE(C). The sonication trigger was modified as shown by the dashed lines in Fig. 1. For the repeated bipolar gradients, the sound was on through the 180° refocusing pulse. For the inverted bipolar gradients, the sonication was triggered twice. For all three encoding sets, the total effective encoding time was maintained at 18 ms. Therefore, all three sets had the same displacement sensitivity and total scan time.
Signal-to-Noise Ratio
All of the three encoding gradient sets are diffusion-weighted. Approximating the trapezoid gradient as a rectangular gradient, the b value of the unipolar gradient set is
| [2] |
where each lobe has a duration of δ, and the center of the two lobes are separated by a time interval of Δ. In this study, Δ is kept as small as possible, and is approximated as δ+5 ms. For the repeated bipolar set and the inverted bipolar set, the b values are given by
| [3] |
Here, δ is the duration of each bipolar gradient, and each lobe of it has a duration of δ/2. Taking the b value and minimal T2 weighting into account, the SNR of the magnitude image can be expressed as
| [4] |
where A is the signal intensity in the absence of noise, diffusion-weighting, and T2 decay, σ is the standard deviation of the Gaussian noise in that channel, and D is the apparent diffusion coefficient of the voxel. The TE depends on the pulse width δ plus some constant time, which can be approximated as TEmin = 2δ const . Based on a reasonable duration for the other sequence components, const is taken as 15 ms. The phase image is reconstructed by calculating the arctangent of the real and imaginary amplitude ratio. Assuming A >> σ, the distribution of the noise (Δφ) in the phase images can be approximated by (36)
| [5] |
which is a zero mean Gaussion distribution with the standard deviation σ φ = 1/ SNRm.
Since the displacement map was calculated by taking the difference of a pair of phase maps, the SNR of the acquired displacement map is
| [6] |
where d is the real displacement. From Eq. 6, it is clear that the SNR of the displacement map depends on the encoding sensitivity α and the b value. The higher the sensitivity, the higher is the measured phase signal. However, higher sensitivity requires a larger area for both the unipolar and the bipolar gradient sets, which increases the b value and echo time, resulting in a lower signal intensity. Since the gradients are played with maximum strength available, the SNR of the displacement map could be expressed as a function of δ by the following for the unipolar gradients,
| [7] |
and for the bipolar gradients,
| [8] |
Thus, the two competing effects result in an optimal duration for the encoding gradient, which is demonstrated by a simulation. In the simulation of the displacement SNR of the white matter, an apparent diffusion coefficient (ADC) of 1.5×10⁻³ mm2/s and T2 of 92 ms were used (37, 38).
Results
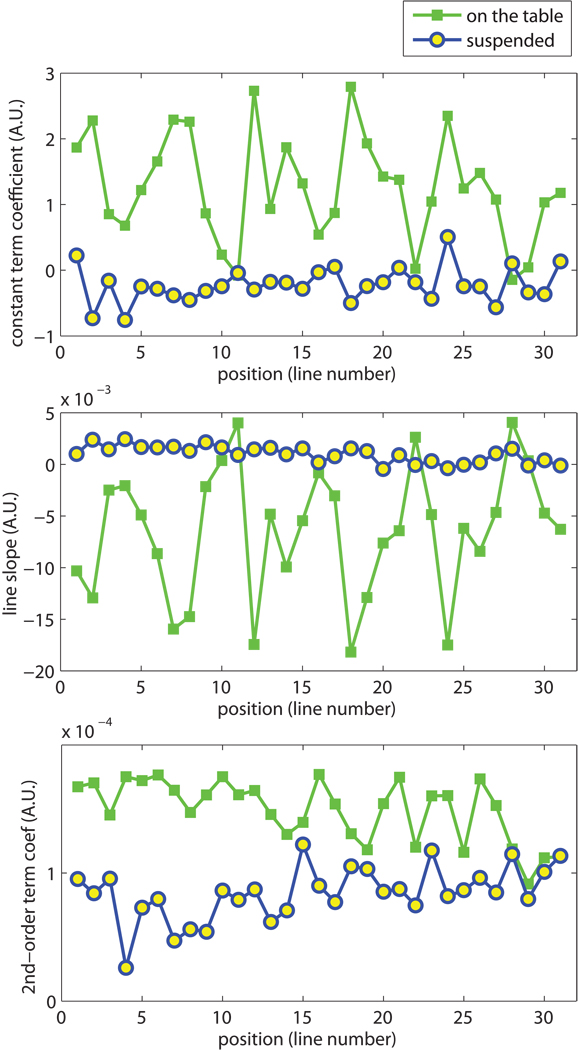
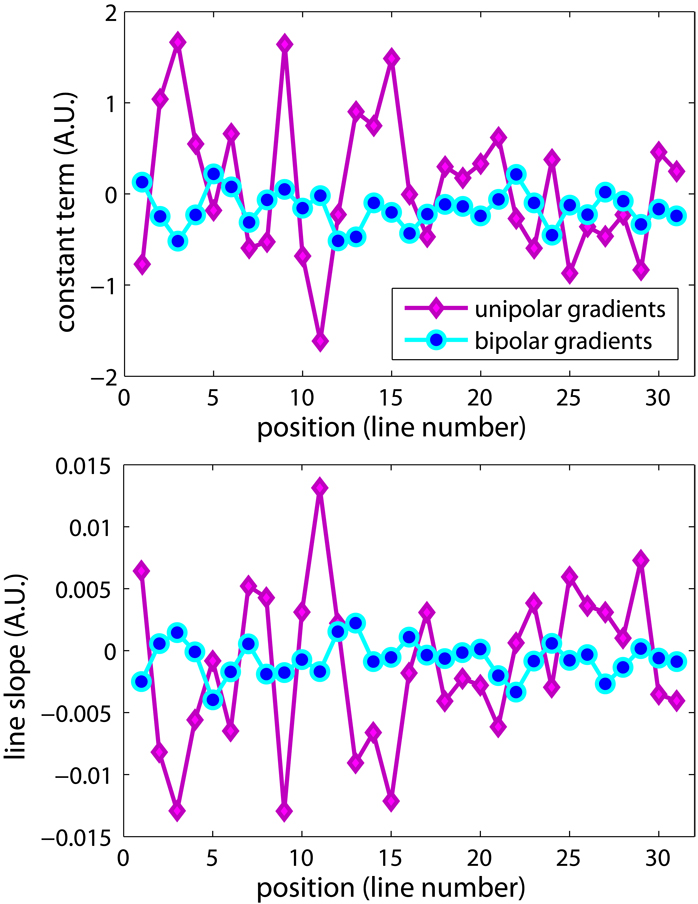
The results of the motion-free study shown in Fig. 4 demonstrate that the constant and linear phase terms are reduced in the “motion-free” case. When the phantom was suspended from the table with the “motion-free” system, the linear phase was decreased significantly. For a FOV consisting of 31 lines, the constant terms had a distribution 1.27±0.81 when the phantom was on the table, compared to −0.22±0.27 with the phantom suspended. For the linear terms, the coefficient decreased from (−6.5±6.2)×10−3 to (0.99±0.81)×10−3. The decrease was statistically significant (P<0.0001) as tested by the Student’s t test. The constant and linear terms can be easily corrected, as described in step two of the displacement map reconstruction.
Figure 4.
Comparison between the images acquired with “motion free” setup and the conventional “on the table” setup, both using DE(A) gradients shown in Fig.1. The fitting results of each line are plotted here. With the reduction of table vibration, the constant and first order term coefficients decreased dramatically. However, the quadratic shape of the background phase was not affected, as shown by the non-zero second order term coefficients.
After correction for the constant and linear phase terms, an additional phase artifact is seen at the edge of the phantom (dashed arrows in Fig. 3 g and h), when the images are acquired with DE(A) gradients shown in Fig.1. Since it is in the image with the sound off, this artifact was not related to the ultrasound application. Complex motions are unlikely to be the cause, since the form of the background phase is similar with and without table vibration, as shown in Fig. 4 (c) that the second order phase term persists with the “motion-free” system. One way to correct for this artifact is via the acquisition and subtraction of a baseline image with the sound off (optional step 3 of the reconstruction), as described in Fig. 3i.
The phase of one line of the baseline image along the readout direction is shown in Fig. 5 for several amplitudes of the unipolar encoding gradients. The background phase appears to be a spatially quadratic function and increases linearly with the amplitude of the encoding gradient.
Figure 5.
The amplitude of the encoding gradient versus the background phase of images acquired with the unipolar gradients. All the pulse timings were fixed while the gradient amplitude changed from 8 mT/m to 40 mT/m, therefore, the slew rate of the encoding gradients changed accordingly from 8.3 T/m/s to 41.6 T/m/s. The background phase was reduced with lower gradient amplitude, but the quadratic shape was maintained. The range of the background phase is linearly dependent on the amplitude of the encoding gradient.
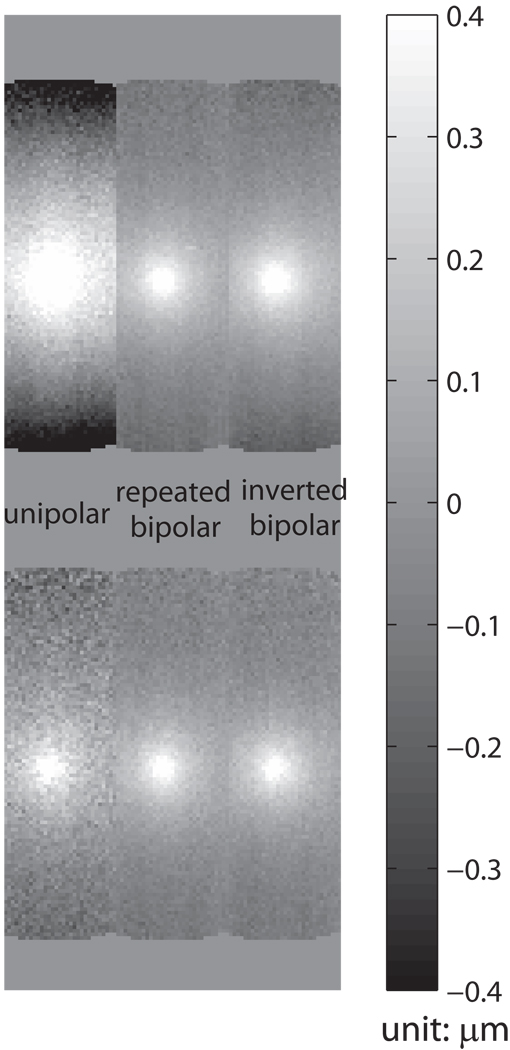
The results of the background phase distortion for each of the three encoding gradients are shown in the first row of Fig. 6. Optional Step 3 of the reconstruction was not performed for these images. The unipolar encoding gradient has the largest background phase, with the repeated bipolar having the smallest background phase. The background phase acquired with the repeated bipolars appeared to be flat throughout the 12 cm phantom, such that a baseline subtraction is not necessary.
Figure 6.
The displacement map comparison. The images in the first row are the results before background correction, and the ones in the second row are corrected by the optional step three of the reconstruction, the baseline subtraction, for a fair comparison. In the displacement map acquired with unipolar gradients, the severe background phase significantly distorts the displacement measurement. The repeated bipolar gradient set significantly reduces the background phase, and the optional baseline subtraction is not required. Omitting the baseline subtraction can further improve the SNR of the displacement map.
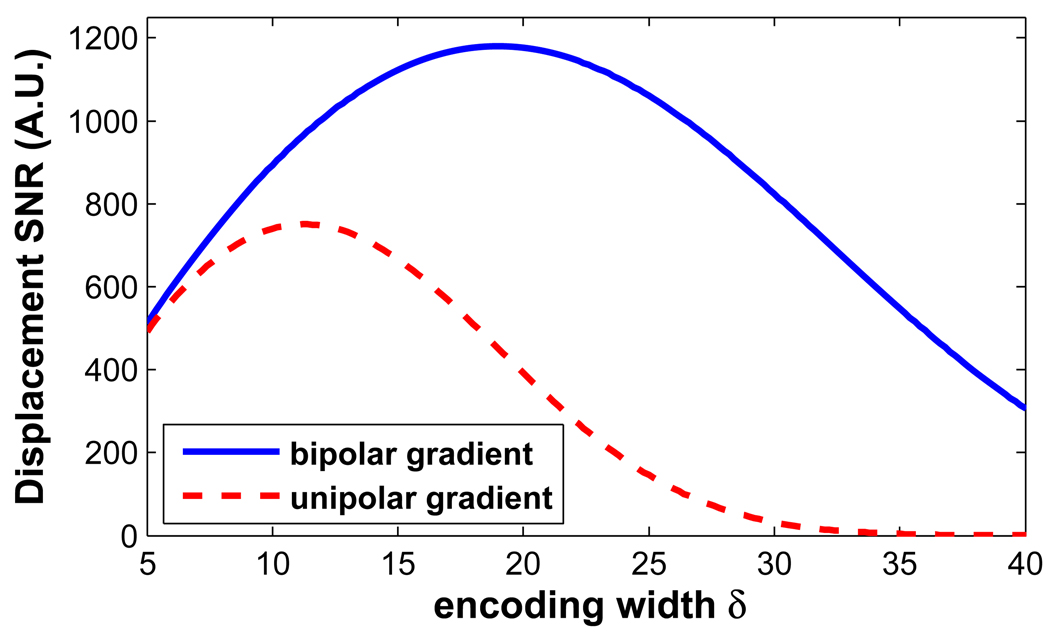
The results of the SNR analysis are shown in Fig. 7. Increasing the encoding width initially provides more phase sensitivity. However, as shown in the figure, the loss of SNR with increasing b-value overcomes the phase sensitivity, producing a maximum, as shown. The bipolar encoding gradients show an advantage over the unipolar gradients when the pulse width is longer than 5 ms. The simulation demonstrates the optimized pulse width is 19 ms for white matter when the bipolar gradients are used for encoding. The displacement maps acquired with the three different encoding gradients are demonstrated in the second row of Fig. 6. A pulse width of 18 ms was used, and a significant SNR enhancement (SNRd ,bi / SNR d ,uni = 2.54) with the bipolar encoding set can be appreciated. This measured enhancement ratio is close to the theoretical ratio 2.84, which is calculated by Eq.7 and Eq.8. This SNR improvement was achieved at no cost of scan time or encoding sensitivity. For these images, the displacement maps were corrected for the background phase in the optional step three of the reconstruction.
Figure 7.
SNR comparison of the bipolar gradients and the unipolar gradients. The bipolar gradient set improves the SNR compared to the unipolar set when the pulse width is longer than 5 ms. Simulation shows that the SNR of the displacement map is optimized with a pulse width of 19 ms for the white matter.
The simulation was applied to other tissue types, including kidney, liver, and prostate, to look for the optimized encoding pulse width. The optimized δ is a function of tissue type based on their T2 and ADC (37–39). The recommended values for different tissue types are listed in Table 1.
Table 1. Optimized Encoding Pulse Width.
Encoding the displacement with repeated bipolar gradients, the optimal encoding width in terms of SNR is specified for four different tissue types.
| Tissue Type | T2 (ms) | ADC (10−3 mm2/s) | Optimized δ (ms) |
|---|---|---|---|
| White matter | 92 | 1.5 (parallel dir) | 19 |
| Kidney | 58 | 1.63 | 16.6 |
| Liver | 43 | 0.69 | 17.2 |
| Prostate | 74 | 1.64 | 17.8 |
Acquisitions with the repeated bipolar gradients are more robust against bulk motion, as shown by the reduction in the constant and linear phase terms shown in Fig. 8. For these images, the phantom was imaged on the scanner bed. The linear artifacts on the image acquired with the repeated bipolars were less severe compared to the ones on the image acquired with the unipolar gradients.
Figure 8.
Linear fitting result of each line of the phase difference image, acquired with either the unipolar gradients or the repeated bipolar gradients. The phantom was placed on the scanner table, and the vibration during the scanning caused less phase distortion with the bipolar gradients.
To assess the heat accumulation, an SPGR sequence was implemented immediately upon the completion of a 5-min MR-ARFI experiment with an electrical power of 80 W with a duty cycle of 3.8%. A temperature increase less than 1°C was observed.
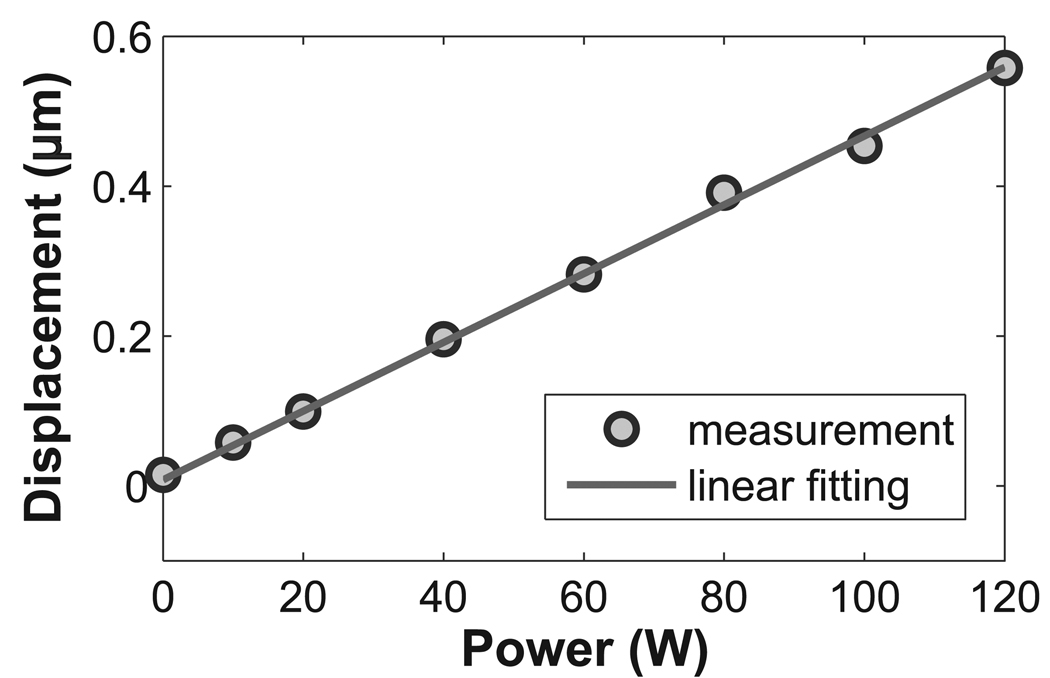
The measured displacement changed as the sonication power changed. As illustrated in Fig.9, the electrical power of the HIFU system stepped from 0 W to 120 W, and a linear dependence between the power and the displacement at the focal spot was observed. The data were measured by the optimized repeated bipolar gradients, and a displacement less than 0.1 µm was detected.
Figure 9.
The displacement measurement was linearly dependent on the applied power. Using the repeated bipolars as the encoding gradient, a displacement less than 0.1 µm was observed at the electrical power level of 10 W.
Discussion and Conclusion
By analyzing sources of artifacts in MR acoustic radiation force imaging, we have shown that accuracy was reduced by the nonlinear background phase distortion caused by the eddy currents, and nonlinear phase artifacts induced by the bulk motion. In addition, precision was reduced by noise when heavy diffusion-weighting is applied. We have proposed using repeated bipolar gradients for MR-ARFI. An improved accuracy was achieved with the robustness against bulk motion and background phase distortion, and an improved precision was achieved with reduced diffusion-weighting and optimized encoding pulse width.
There are many possible contributors to image phase artifacts. These include the phase induced by B0 field inhomogeneities, RF coil sensitivities, concomitant-field, bulk motion, and eddy currents. Since the first two factors are not related to the polarity of the encoding gradient, contributions from these sources will be canceled by the phase subtraction in step one of the displacement map reconstruction. The concomitant-field phase artifacts will be nulled because the encoding gradients before and after the refocusing pulse are symmetric (40). This leaves bulk motion and eddy currents as sources of image phase artifact.
Eddy currents are generated during the time-varying part of the gradient. Since they are proportional to the gradient slew rate (41, 42), the phase accrued by the eddy-current gradient is additive in the subtraction of the phase image pair. Eddy current can be decomposed into B0 eddy current, linear eddy current, and higher-order terms. With line scan imaging, the first two terms would cause linear phase accumulation along the readout direction, and could be corrected by step two of the reconstruction. In this work, the higher-order terms are reduced by the repeated bipolar gradients. A computational approach to remove the phase artifacts induced by the higher-order terms is to use polynomial fitting outside of the focal spot to subtract the background from the whole phantom (33).
In the displacement reconstruction, the focal mask removed the displacement-induced phase from each line before the linear phase fit, to prevent it from biasing the estimation of the constant term. This step is important for quantifying the displacement accurately. The mask was manually selected by visually inspecting the result of step one and pre-knowledge of approximate location of the focal spot. As shown in Fig. 3c, the magnitude of the radiation force induced displacement was smaller than the bulk motion from table vibration and other factors. Therefore, this step could be improved by an automated iterative reconstruction. If no focal mask is assumed (the focal mask is initially set to a null matrix), then the result of step two would show the focal displacement in addition to a non-zero DC offset. An edge detection algorithm could then detect the focal spot and use that as the the focal mask. Step two would be repeated to eliminate the erroneous DC offset.
With the application of HIFU, the temperature could change in MR-ARFI. Although the duty cycle was kept at lower than 5%, heat could accumulat after a long experiment. Since the line scan sequence is a spin echo sequence, the temperature change would not affect the phase measurement. But the Young’s modulus is a function of temperature, thus the displacement might change when the temperature changes significantly. Since the temperature increase was less than 1°C after a 5-min experiment, the change of Young’s modulus is neglected in this work. For the experiment of stepping the applied power from 0 W to 120 W, the data points were randomly acquired instead of changing the power monotonically.
Potentially, MR-ARFI is promising for guiding many HIFU treatments. Firstly, it can map the displacement at the focal spot before any significant heat could be generated, it could noninvasively visualize the ultrasound beam pattern in vivo and calibrate the HIFU system before and during the treatments. Secondly, MR-ARFI might potentially be useful to calculate the energy dose deposited at the focal spot, thus providing a way to monitor mechanical mode HIFU treatments. In order to do that, the displacement measurement must be precise and accurate.
In this work, MR-ARFI is optimized by improving the encoding scheme with repeated bipolar gradients. The displacement is measured with an enhanced accuracy and precision at no cost of scan time or encoding sensitivity. These improvements may lead to novel applications of MR acoustic radiation force imaging.
Acknowledgment
The authors would like to thank Nathan McDannold, Ph.D., and Scott Hinks, Ph.D., for helpful discussions, and Yoav Medan, Ph.D., for technical support with the HIFU system.
Funded by: NIH RO1 CA111981, RO1 CA121163, P41 RR009784
References
- 1.Stewart EA, Gedroyc WMW, Tempany CMC, Quade BJ, Inbar Y, Ehrenstein T, Shushan A, Hindley JT, Goldin RD, David M, Sklair M, Rabinovici J. Focused ultrasound treatment of uterine fibroid tumors: Safety and feasibility of a noninvasive thermoablative technique. Am J Obstet Gynecol. 2003;189:48–54. doi: 10.1067/mob.2003.345. [DOI] [PubMed] [Google Scholar]
- 2.Tempany CMC, Stewart EA, McDannold N, Quade BJ, Jolesz FA, Hynynen K. MR imaging-guided focused ultrasound surgery of uterine leiomyomas: A feasibility study. Radiology. 2003;226:897–905. doi: 10.1148/radiol.2271020395. [DOI] [PubMed] [Google Scholar]
- 3.Hindley J, Gedroyc WM, Regan L, Stewart E, Tempany C, Hynyen K, Hynnen K, Mcdannold N, Macdanold N, Inbar Y, Itzchak Y, Rabinovici J, Kim HS, Kim K, Geschwind JF, Hesley G, Gostout B, Gostout B, Ehrenstein T, Hengst S, Sklair-Levy M, Shushan A, Jolesz F. MRI guidance of focused ultrasound therapy of uterine fibroids: Early results. AJR Am J Roentgenol. 2004;183:1713–1719. doi: 10.2214/ajr.183.6.01831713. [DOI] [PubMed] [Google Scholar]
- 4.Uchida T, Ohkusa H, Yamashita H, Shoji S, Nagata Y, Hyodo T, Satoh T. Five years experience of transrectal high-intensity focused ultrasound using the Sonablate device in the treatment of localized prostate cancer. Int J Urol. 2006;13:228–233. doi: 10.1111/j.1442-2042.2006.01272.x. [DOI] [PubMed] [Google Scholar]
- 5.Poissonnier L, Chapelon JY, Rouvire O, Curiel L, Bouvier R, Martin X, Dubernard JM, Gelet A. Control of prostate cancer by transrectal HIFU in 227 patients. Eur Urol. 2007;51:381–387. doi: 10.1016/j.eururo.2006.04.012. [DOI] [PubMed] [Google Scholar]
- 6.Hynynen K, Pomeroy O, Smith DN, Huber PE, McDannold NJ, Kettenbach J, Baum J, Singer S, Jolesz FA. MR imaging-guided focused ultrasound surgery of fibroadenomas in the breast: A feasibility study. Radiology. 2001;219:176–185. doi: 10.1148/radiology.219.1.r01ap02176. [DOI] [PubMed] [Google Scholar]
- 7.Huber PE, Jenne JW, Rastert R, Simiantonakis I, Sinn HP, Strittmatter HJ, von Fournier D, Wannenmacher MF, Debus J. A new noninvasive approach in breast cancer therapy using magnetic resonance imaging-guided focused ultrasound surgery. Cancer Res. 2001;61:8441–8447. [PubMed] [Google Scholar]
- 8.Gianfelice D, Khiat A, Boulanger Y, Amara M, Belblidia A. Feasibility of magnetic resonance imaging-guided focused ultrasound surgery as an adjunct to tamoxifen therapy in high-risk surgical patients with breast carcinoma. J Vasc Interv Radiol. 2003;14:1275–1282. doi: 10.1097/01.rvi.0000092900.73329.a2. [DOI] [PubMed] [Google Scholar]
- 9.Hynynen K, McDannold N, Vykhodtseva N, Jolesz FA. Noninvasive MR imaging-guided focal opening of the blood-brain barrier in rabbits. Radiology. 2001;220:640–646. doi: 10.1148/radiol.2202001804. [DOI] [PubMed] [Google Scholar]
- 10.McDannold N, Vykhodtseva N, Hynynen K. Use of ultrasound pulses combined with Definity for targeted blood-brain barrier disruption: A feasibility study. Ultrasound Med Biol. 2007;33:584–590. doi: 10.1016/j.ultrasmedbio.2006.10.004. [DOI] [PMC free article] [PubMed] [Google Scholar]
- 11.Treat LH, McDannold N, Vykhodtseva N, Zhang Y, Tam K, Hynynen K. Targeted delivery of doxorubicin to the rat brain at therapeutic levels using MRI-guided focused ultrasound. Int J Cancer. 2007;121:901–907. doi: 10.1002/ijc.22732. [DOI] [PubMed] [Google Scholar]
- 12.Miller DL, Pislaru SV, Greenleaf JE. Sonoporation: mechanical DNA delivery by ultrasonic cavitation. Somat Cell Mol Genet. 2002;27:115–134. doi: 10.1023/a:1022983907223. [DOI] [PubMed] [Google Scholar]
- 13.van Wamel A, Kooiman K, Harteveld M, Emmer M, ten Cate FJ, Versluis M, de Jong N. Vibrating microbubbles poking individual cells: Drug transfer into cells via sonoporation. J Control Release. 2006;112:149–155. doi: 10.1016/j.jconrel.2006.02.007. [DOI] [PubMed] [Google Scholar]
- 14.Huang SL, MacDonald RC. Acoustically active liposomes for drug encapsulation and ultrasound-triggered release. Biochim Biophys Acta. 2004;1665:134–141. doi: 10.1016/j.bbamem.2004.07.003. [DOI] [PubMed] [Google Scholar]
- 15.Tartis MS, McCallan J, Lum AFH, LaBell R, Stieger SM, Matsunaga TO, Ferrara KW. Therapeutic effects of paclitaxel-containing ultrasound contrast agents. Ultrasound Med Biol. 2006;32:1771–1780. doi: 10.1016/j.ultrasmedbio.2006.03.017. [DOI] [PubMed] [Google Scholar]
- 16.Larrat B, Pernot M, Aubry JF, Sinkus R, Tanter M, Fink M. Radiation force localization of HIFU therapeutic beams coupled with Magnetic Resonance Elastography treatment monitoring; Proceedings of IEEE International Ultrasonics Symposium; Beijing, China. 2008. pp. 451–454. [Google Scholar]
- 17.Herbert E, Pernot M, Larrat B, Montaldo G, Tanter M, Fink M. Energy-based adaptive focusing of waves: Application to ultrasonic imaging and therapy; Proceedings of IEEE International Ultrasonics Symposium; Beijing, China. 2008. pp. 875–878. [Google Scholar]
- 18.Larrat B, Pernot M, Souilah A, Aubry JF, Fink M, Tanter M. MR guidance, monitoring and control of brain HIFU therapy in small animals: In vivo demonstration in rats at 7T; Proceedings of the 9th International Symposium on Therapeutic Ultrasound; Aix-en-Provence, France. 2009. [Google Scholar]
- 19.Starritt HC, Duck FA, Humphrey VF. Forces acting in the direction of propagation in pulsed ultrasound fields. Phys Med Biol. 1991;36:1465–1474. doi: 10.1088/0031-9155/36/11/006. [DOI] [PubMed] [Google Scholar]
- 20.Sugimoto T, Ueha S, Itoh K. Tissue hardness measurement using the radiation force of focused ultrasound; Proc of the 1990 Ultrasonics Symposium; pp. 1377–1380. [Google Scholar]
- 21.Dymling SO, Persson HW, Hertz TG, Lindström K. A new ultrasonic method for fluid property measurements. Ultrasound Med Biol. 1991;17:497–500. doi: 10.1016/0301-5629(91)90186-z. [DOI] [PubMed] [Google Scholar]
- 22.Sarvazyan AP, Rudenko OV, Swanson SD, Fowlkes JB, Emelianov SY. Shear wave elasticity imaging: a new ultrasonic technology of medical diagnostics. Ultrasound Med Biol. 1998;24:1419–1435. doi: 10.1016/s0301-5629(98)00110-0. [DOI] [PubMed] [Google Scholar]
- 23.Walker WF, Fernandez FJ, Negron LA. A method of imaging viscoelastic parameters with acoustic radiation force. Phys Med Biol. 2000;45:1437–1447. doi: 10.1088/0031-9155/45/6/303. [DOI] [PubMed] [Google Scholar]
- 24.Nightingale K, Soo MS, Nightingale R, Trahey G. Acoustic radiation force impulse imaging: in vivo demonstration of clinical feasibility. Ultrasound Med Biol. 2002;28:227–235. doi: 10.1016/s0301-5629(01)00499-9. [DOI] [PubMed] [Google Scholar]
- 25.Fahey BJ, Nightingale KR, Stutz DL, Trahey GE. Acoustic radiation force impulse imaging of thermally- and chemically-induced lesions in soft tissues: preliminary ex vivo results. Ultrasound Med Biol. 2004;30:321–328. doi: 10.1016/j.ultrasmedbio.2003.11.012. [DOI] [PubMed] [Google Scholar]
- 26.Fahey BJ, Nightingale KR, McAleavey SA, Palmeri ML, Wolf PD, Trahey GE. Acoustic radiation force impulse imaging of myocardial radiofrequency ablation: initial in vivo results. IEEE Trans Ultrason Ferroelectr Freq Control. 2005;52:631–641. doi: 10.1109/tuffc.2005.1428046. [DOI] [PubMed] [Google Scholar]
- 27.Fahey BJ, Nelson RC, Bradway DP, Hsu SJ, Dumont DM, Trahey GE. In vivo visualization of abdominal malignancies with acoustic radiation force elastography. Phys Med Biol. 2008;53:279–293. doi: 10.1088/0031-9155/53/1/020. [DOI] [PMC free article] [PubMed] [Google Scholar]
- 28.Muthupillai R, Lomas DJ, Rossman PJ, Greenleaf JF, Manduca A, Ehman RL. Magnetic resonance elastography by direct visualization of propagating acoustic strain waves. Science. 1995;269:1854–1857. doi: 10.1126/science.7569924. [DOI] [PubMed] [Google Scholar]
- 29.Fatemi M, Greenleaf JF. Ultrasound-stimulated vibro-acoustic spectrography. Science. 1998;280:82–85. doi: 10.1126/science.280.5360.82. [DOI] [PubMed] [Google Scholar]
- 30.Wu T, Felmlee JP, Greenleaf JF, Riederer SJ, Ehman RL. MR imaging of shear waves generated by focused ultrasound. Magn Reson Med. 2000;43:111–115. doi: 10.1002/(sici)1522-2594(200001)43:1<111::aid-mrm13>3.0.co;2-d. [DOI] [PubMed] [Google Scholar]
- 31.Wu T, Felmlee JP, Greenleaf JF, Riederer SJ, Ehman RL. Assessment of thermal tissue ablation with MR elastography. Magn Reson Med. 2001;45:80–87. doi: 10.1002/1522-2594(200101)45:1<80::aid-mrm1012>3.0.co;2-y. [DOI] [PubMed] [Google Scholar]
- 32.Yuan L, Glaser KJ, Rouviere O, Gorny KR, Chen S, Manduca A, Ehman RL, Felmlee JP. Preliminary assessment of one-dimensional MR elastography for use in monitoring focused ultrasound therapy. Phys Med Biol. 2007;52:5909–5919. doi: 10.1088/0031-9155/52/19/012. [DOI] [PubMed] [Google Scholar]
- 33.McDannold N, Maier SE. Magnetic resonance acoustic radiation force imaging. Med Phys. 2008;35:3748–3758. doi: 10.1118/1.2956712. [DOI] [PMC free article] [PubMed] [Google Scholar]
- 34.Plewes DB, Betty I, Urchuk SN, Soutar I. Visualizing tissue compliance with MR imaging. J Magn Reson Imaging. 1995;5:733–738. doi: 10.1002/jmri.1880050620. [DOI] [PubMed] [Google Scholar]
- 35.Gudbjartsson H, Maier SE, Mulkern RV, Mrocz IA, Patz S, Jolesz FA. Line scan diffusion imaging. Magn Reson Med. 1996;36:509–519. doi: 10.1002/mrm.1910360403. [DOI] [PubMed] [Google Scholar]
- 36.Gudbjartsson H, Patz S. The Rician distribution of noisy MRI data. Magn Reson Med. 1995;34:910–914. doi: 10.1002/mrm.1910340618. [DOI] [PMC free article] [PubMed] [Google Scholar]
- 37.Nishimura DG. Principles of magnetic resonance imaging. Stanford University, EE 369B course notes. 1996 [Google Scholar]
- 38.Tien RD, Felsberg GJ, Friedman H, Brown M, MacFall J. MR imaging of high-grade cerebral gliomas: Value of diffusion-weighted echoplanar pulse sequences. AJR Am J Roentgenol. 1994;162:671–677. doi: 10.2214/ajr.162.3.8109520. [DOI] [PubMed] [Google Scholar]
- 39.Namimoto T, Yamashita Y, Sumi S, Tang Y, Takahashi M. Focal liver masses: Characterization with diffusion-weighted echo-planar MR imaging. Radiology. 1997;204:739–744. doi: 10.1148/radiology.204.3.9280252. [DOI] [PubMed] [Google Scholar]
- 40.Zhou XJ, Tan SG, Bernstein MA. Artifacts induced by concomitant magnetic field in fast spin-echo imaging. Magn Reson Med. 1998;40:582–591. doi: 10.1002/mrm.1910400411. [DOI] [PubMed] [Google Scholar]
- 41.van Vaals J, Bergman A. Optimization of eddy-current compensation. Journal of Magnetic Resonance. 1990;90:52–70. [Google Scholar]
- 42.Jehenson P, Westphal M, Schuff N. Analytical method for the compensation of eddy-current effects induced by pulsed magnetic field gradients in NMR systems. Journal of Magnetic Resonance. 1990;90:264–278. [Google Scholar]


