Abstract
BACKGROUND:
The use of neuraminidase inhibitors (oseltamivir and zanamivir) for the treatment of ill individuals has been an important intervention during the 2009 H1N1 pandemic. However, the emergence and spread of drug resistance remains a major concern and, therefore, optimizing antiviral strategies is crucial to retain the long-term effectiveness of these pharmaceutical interventions.
METHODS:
A dynamic model of disease transmission was developed to investigate optimal scenarios for the use of a secondary drug (eg, zanamivir). Considering both small and large stockpiles, attack rates were projected by simulating the model to identify ‘tipping points’ for switching to zanamivir as resistance to oseltamivir develops.
RESULTS:
The use of a limited stockpile of zanamivir can substantially reduce the overall attack rate during pandemic outbreaks. For a reasonably large stockpile of zanamivir, it is optimal to delay the use of this drug for a certain amount of time during which oseltamivir is used as the primary drug. For smaller stockpiles, however, earlier use of zanamivir will be most effective in reducing the overall attack rate. Given a limited stockpile of zanamivir (1.8% in the Canadian plan) without replenishment, and assuming that the fraction of ill individuals being treated is maintained below 60%, the results suggest that zanamivir should be dispensed as the primary drug for thresholds of the cumulative number of oseltamivir resistance below 20%.
INTERPRETATION:
Strategic use of a secondary drug becomes crucial for pandemic mitigation if vaccination and other interventions fail to sufficiently reduce disease transmission in the community. These findings highlight the importance of enhanced surveillance and clinical monitoring for rapid identification of resistance emergence and its population incidence, so that optimal timing for adaptation to the use of drugs can be achieved.
Keywords: Antiviral treatment, Drug resistance, Epidemic modelling, Pandemic influenza
Abstract
HISTORIQUE :
L’utilisation des inhibiteurs de la neuraminidase (oseltamivir et zanamivir) pour le traitement des malades a été une intervention importante durant la pandémie de grippe AH1N1 de 2009. Toutefois, l’émergence et la propagation de la résistance aux médicaments reste très préoccupante c’est pourquoi il faut optimiser les stratégies antivirales de manière à maintenir long terme l’efficacité de ces interventions pharmaceutiques.
MÉTHODES :
Un modèle dynamique de transmission de la maladie a été mis au point pour analyser les scénarios optimaux d’utilisation des agents secondaires (p. ex. zanamivir). En tenant compte des petites et de grandes réserves, les taux d’attaque ont été projetés au moyen d’un modèle de simulation afin d’identifier les seuils à partir desquels passer au zanamivir à mesure que la résistance à l’oseltamivir s’installe.
RÉSULTATS :
L’utilisation de réserves limitées de zanamivir peut substantiellement réduire le taux d’attaque global durant les éclosions pandémiques. En présence de réserves raisonnablement abondantes de zanamivir, il est optimal d’en retarder l’utilisation pendant un certain temps et d’utiliser plutôt l’oseltamivir comme agent principal. En présence de réserves plus faibles, toutefois, l’utilisation plus précoce du zanamivir sera plus efficace à réduire le taux d’attaque global. Avec des réserves limitées de zanamivir (1,8 % selon le Plan canadien) sans renouvellement et en supposant que la fraction de malades traités est maintenue à moins de 60 %, les résultats donnent à penser que le zanamivir doit être dispensé comme médicament de première intention en présence de seuils cumulatifs de résistance à l’oseltamivir inférieurs à 20 %.
INTERPRÉTATION :
L’utilisation stratégique d’un agent de seconde intention devient cruciale pour réduire la pandémie si la vaccination et les autres interventions ne permettent pas de réduire suffisamment la transmission de la maladie dans la communauté. Ces résultats rappellent l’importance d’une surveillance et d’un monitorage clinique accrus pour reconnaître rapidement l’émergence de la résistance et son incidence sur la population afin d’intervenir au bon moment et d’adapter l’emploi des médicaments.
A novel triple-assortment influenza A virus (nH1N1) has spread worldwide since its initial appearance in North America in March/April 2009, and caused the first pandemic of the 21st century (1). Public health responses to this pandemic have included vaccination, antiviral treatment and social distancing mechanisms. While early results of clinical trials indicate that one dose of nH1N1 vaccine likely provides adequate protection in most healthy adults and older children (2–4), the timelines of vaccination, poor uptake among target groups (5) and insufficient vaccine supply in several affected countries, could all increase the demand for antiviral drugs.
Precise planning for antiviral use is confounded by several factors, in particular, the transmissibility of the disease (determined by characteristics of the virus and the susceptibility of individuals), the effectiveness of antiviral treatment in reducing severe morbidity and mortality and, more importantly, the evolutionary responses of the virus that may result in the generation of transmissible drug-resistant mutants (6,7). Furthermore, most countries have limited stockpiles of neuraminidase inhibitors and, therefore, targeted strategies are needed to optimize the use of available supplies of antiviral drugs and minimize unintended adverse consequences.
Although initial investigations demonstrated the susceptibility of nH1N1 to the antiviral agents oseltamivir and zanamivir (8), the emergence of oseltamivir resistance in treated H1N1 patients has raised concerns about the prudent use of neuraminidase inhibitors for treatment of ill individuals, and the effectiveness of these drugs in the long term. Furthermore, evidence is accumulating that such resistance sustains person-to-person transmission. In addition to isolated oseltamivir resistance in patients not treated with the drug in Hong Kong (July 3, 2009) and Japan (August 22, 2009), a Centers for Disease Control and Prevention (USA) report (9) provides further evidence for transmission of oseltamivir-resistant strains among individuals receiving a mass oseltamivir prophylaxis program during an outbreak of influenza-like illnesses at a summer camp. A recent study (7) of a community cluster of oseltamivir-resistant cases also indicated that nH1N1-resistant viruses are transmissible and can replicate and cause illness in healthy people in the absence of drug treatment.
In the present study, antiviral strategies for the use of oseltamivir and zanamivir were evaluated in the presence of transmissible drug resistance. A dynamic population model was developed for treatment of clinically infected individuals, with oseltamivir and zanamivir as the primary and secondary measures, respectively. In the context of limited stockpiles, the model was used to address two policy-relevant issues: identifying the thresholds of oseltamivir resistance, above which zanamivir should be prescribed as the primary treatment measure; and determining the optimal time for switching to zanamivir to reduce the overall attack rate (fraction of the population infected). The model was simulated using parameter estimates published in the literature to address these issues in the Canadian pandemic influenza plan, in which antiviral drugs were stockpiled for treatment of approximately 17% of the population (10).
METHODS
The model
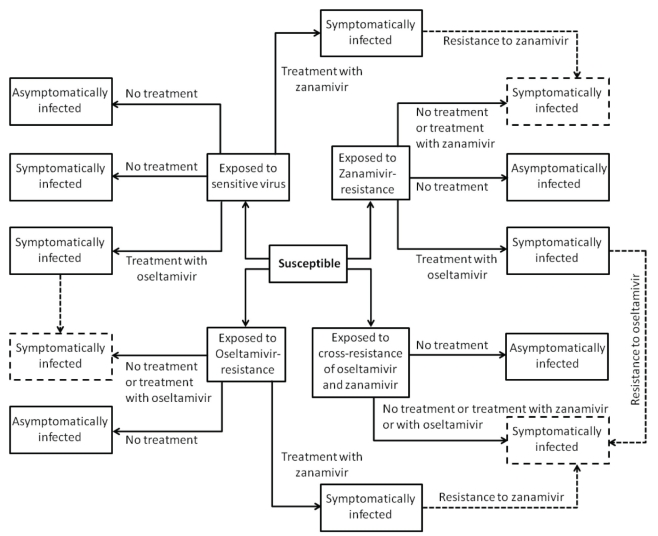
For the design of the model structure, four strains of the virus were included. The strains were sensitive to both oseltamivir and zanamivir, sensitive to zanamivir only, sensitive to oseltamivir only, or resistant to both drugs. It was assumed that resistance was absent at the onset of the outbreak, and initially emerged in treated patients. In the model, individuals were identified by their status as susceptible, exposed (infected, but not yet infectious), symptomatically infectious and asymptomatically infectious; treatment was applied during symptomatic infection. It was assumed that recovery from infection caused by a strain of the virus conferred immunity to all sensitive and resistant strains, preventing reinfection (Figure 1). The model and its technical aspects are presented in the Appendix.
Figure 1).
Model diagram for the transmission dynamics of disease with treatment and emergence of drug resistance. Dashed arrows show the development of resistance during treatment, and dashed boxes show symptomatic infections with resistance to oseltamivir, zanamivir or both (cross-resistance)
Baseline values of model parameters
A population of 100,000 susceptible individuals was considered, and it was assumed that the outbreak was triggered by the introduction of 10 individuals who were exposed to the sensitive virus. In the model, the exposed individuals experienced, on average, a latent period of 1.25 days (11–13). An exposed individual became infectious after the latent period. An infectious patient can shed the virus without showing clinical symptoms. This is referred to as asymptomatic infection with a mean infectious duration of 4.1 days (12–15). The probability of developing symptomatic infection was assumed to be 60% (the remaining 40% of exposed individuals were asymptomatic) (13,15). Individuals who developed clinical symptoms could transmit the disease for an average infectious period of 5.1 days, which lies within the estimated range for the duration of the infectiousness (3.06 to 5.69 days) due to nH1N1 illness (12–15), and includes a one-day period of infectiousness before the onset of symptoms (16). Asymptomatic infection was assumed to be 50% less transmissible than symptomatic infection (14). Antiviral drugs were used only for the treatment of symptomatic infection, and were effective against infection by strains sensitive to the drug. It was assumed that effective treatment reduced infectiousness by 60% (reflected as the reduced transmission rate in the model) (12,17,18). During oseltamivir clinical trials, 1% to 4% of treated adults (19) and 5% to 6% of treated children were found to shed resistant viruses (20), although more recent studies (21,22) have reported resistance in 16% to 18% of oseltamivir-treated children. Emergence of resistance was considered during treatment of symptomatic infection, with the rate of 0.0072 per day for oseltamivir (13,18), which resulted in de novo resistance in approximately 4% of treated patients. Recent analysis of seasonal influenza A (H1N1) viruses isolated between 2006 and early 2008 (from Australasia and Southeast Asia) revealed zanamivir resistance in 2.3% of treated patients, with markedly reduced susceptibility to the drug (23). In the model, treatment with zanamivir was assumed to be 50% less prone to generating resistance, with the rate of 0.0036 per day accounting for less than 2% of zanamivir resistance (23). It was also assumed that resistant virus strains remained transmissible (as indicated by a recent report on community cluster of oseltamivir-resistant 2009 H1N1 infection in Vietnam [7]), albeit at 80% transmissibility of the sensitive virus. In simulating the model, it was assumed that oseltamivir is used for treatment of a minimum of 2% of treated patients.
Simulations and sensitivity analyses
For the simulations presented in the current study, both small and large stockpiles of zanamivir were considered, and the optimal use of two drugs with oseltamivir as the primary drug was investigated. For the limited stockpile of zanamivir, the capacity of antiviral drugs in the Canadian pandemic influenza plan (including national emergency stockpiles) without replenishment was used, which held 5.1 million doses of zanamivir (enabling treatment of approximately 1.8% of the total population), with 50.7 million doses of oseltamivir (covering approximately 15.2% of Canada’s population). A baseline value of 1.6 was assumed to be the basic reproduction number (R0) of the sensitive strain, which lies within the range (1.3 to 1.7) estimated by epidemiological analyses of data collected during the early stages of the 2009 H1N1 pandemic (24,25). The R0 represents the number of new infections that a single infected case generates during the course of infection in an entirely susceptible population. Simulations for values of R0 below 1.6 were performed to include the effect of other interventions that effectively reduce the R0 of disease transmission (see Appendix).
For each baseline scenario, the percentage of ill individuals treated with drugs (treatment level) was fixed in the range of 0% to 100%, and simulations were run for the entire course of the outbreak to calculate the overall attack rate and the fraction of population infected with resistant strains. For each treatment level, simulations were performed by changing the time at which treatment with zanamivir started during the outbreak, which was referred to as the ‘switch time’. Before the switch time, oseltamivir was the only drug used for treatment of symptomatic infections; however, zanamivir became the primary drug used after the switch time, with oseltamivir used for only 2% of treated patients.
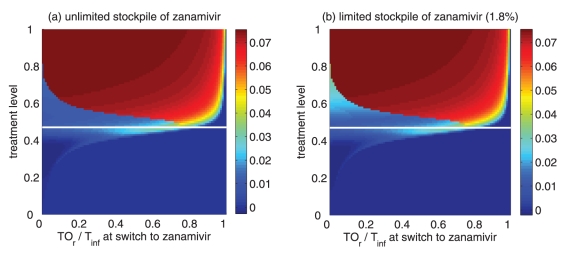
If the stockpile of zanamivir was exhausted, then oseltamivir again became the primary drug. Simulations presented in Figures 2–4 demonstrate the optimal switch time for minimizing the overall attack rates. The model was also simulated to determine the thresholds of the cumulative number of oseltamivir-resistant cases at which a switch to zanamivir should take place to reduce the overall attack rate (Figure 5).
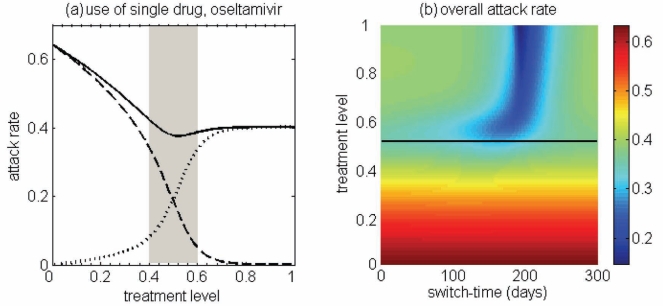
Figure 2).
(a) Attack rates of the sensitive strain (dashed curve), the resistant strain (dotted curve) and both strains (solid curve), when only a single drug (eg, oseltamivir) is used during the entire outbreak. The overall attack rate is minimized at 52% of the treatment level (fc=0.52) within the intermediate range of 40% to 60%. (b) The overall attack rate as a function of the treatment level and the switch time for the start of zanamivir as the primary drug. The solid (black) line corresponds to 52% of the treatment level (fc=0.52) that minimizes the overall attack rate when oseltamivir is the only drug used for treatment of symptomatic infections
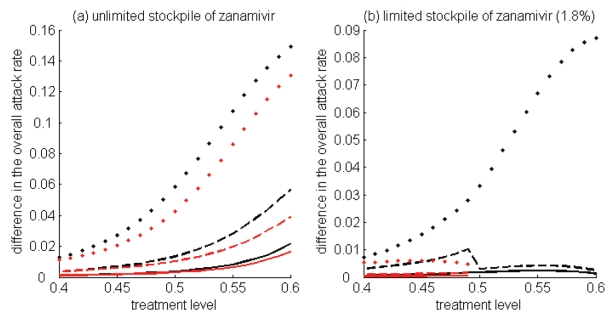
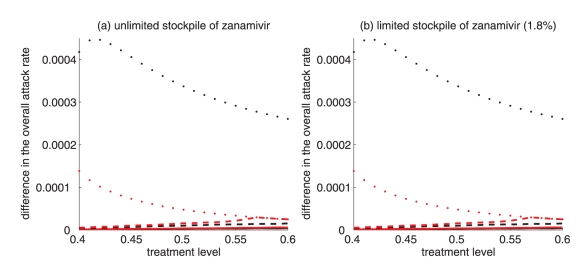
Figure 4).
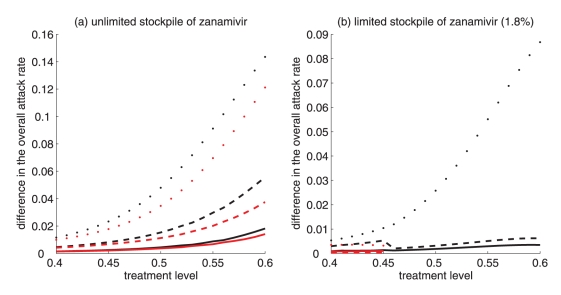
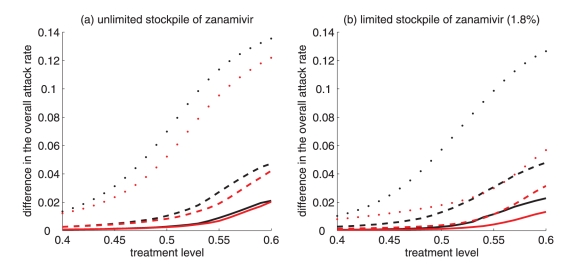
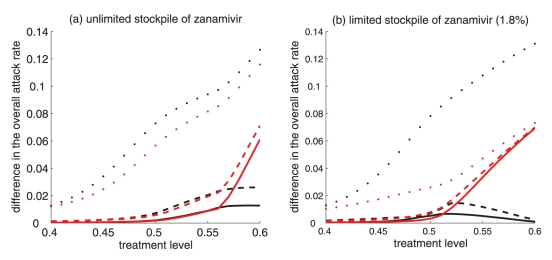
Difference between the largest attack rate when the switch to zanamivir occurs at a different time (earlier or later than the optimal switch time) and the minimum attack rate (obtained at the optimal switch-time) for (a) unlimited and (b) limited (1.8%) stockpiles of zanamivir. Solid curves illustrate the difference in attack rates when switch occurs within 15 days earlier (red curve) and later (black curve) than the optimal switch time. Dashed curves illustrate the difference in attack rates when the switch occurs within 30 days earlier (red curve) and later (black curve) than the optimal switch time. Dotted curves show the difference in attack rates when the switch occurs any time before (red curve) and after (black curve) the optimal switch time
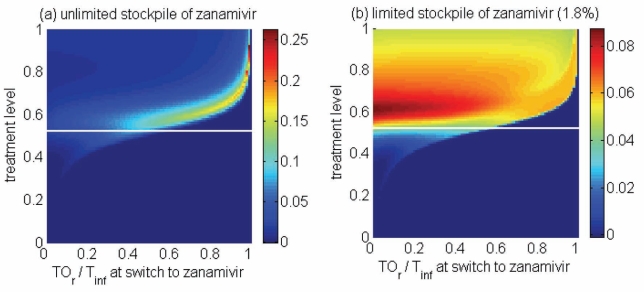
Figure 5).
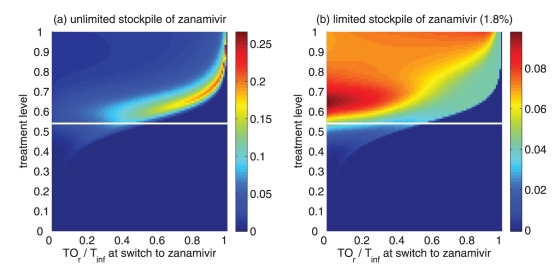
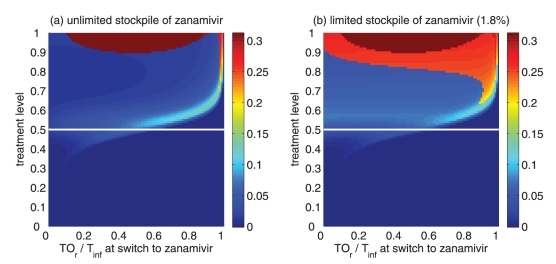
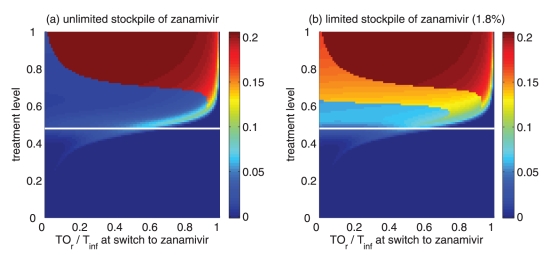
Reduction in the overall attack rate with two drugs versus a single drug for (a) unlimited and (b) limited (1.8%) stockpiles of zanamivir. The horizontal axis shows the ratio of the cumulative number of oseltamivir resistance (TOr) to the total number of infections (Tinf), when the switch to zanamivir occurs for different treatment levels displayed on the vertical axis. The solid (white) line corresponds to 52% treatment level (fc=0.52) at which the overall attack rate is minimized for a single drug (oseltamivir)
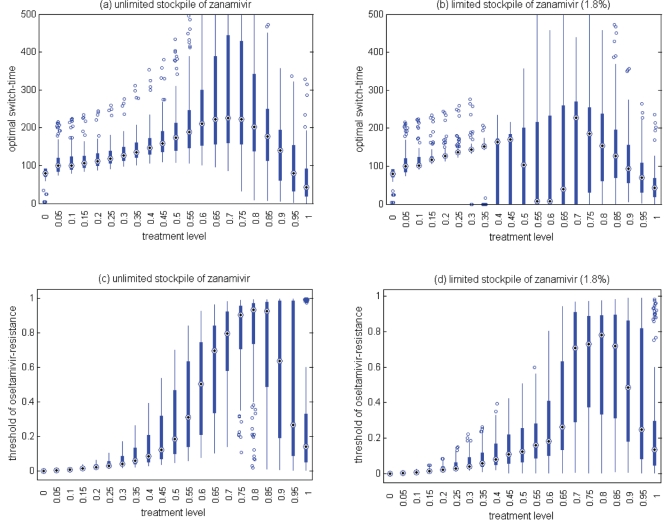
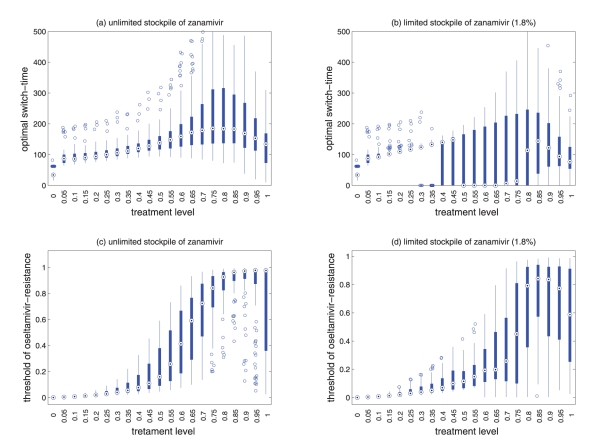
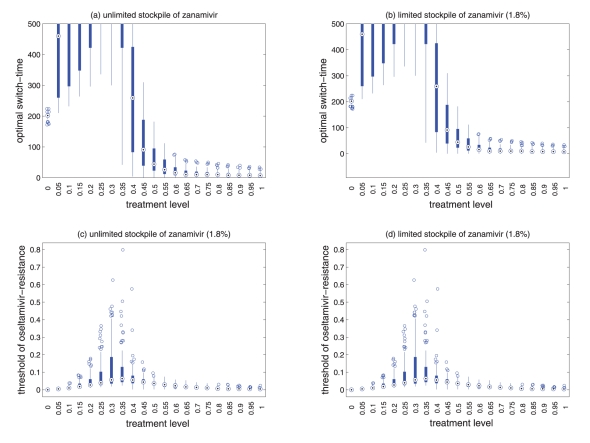
To investigate the effect of parameter changes on the results shown by simulations using baseline values, sensitivity analyses were performed by considering a sampling approach that allows for the simultaneous variations of key parameters, including the relative transmissibility of resistant viruses, rates of de novo resistance emergence and the probability of developing symptomatic infection. Using the Latin Hypercube Sampling technique (26), sample sizes of n=100 were generated, in which parameters were uniformly distributed and sampled within their respective ranges (Table 1). Figure 6 illustrates the results of variations in the optimal switch time and the threshold of oseltamivir resistance for different treatment levels with R0=1.6. Further sensitivity analyses with lower values of R0 are reported in the Appendix.
TABLE 1.
Parameter values with sources from published literature
| Parameter description | Baseline value (range) | Reference |
|---|---|---|
| Basic reproduction number of the sensitive infection (R0) | 1.6 (1.2–1.7) | 24,25 |
| Duration of latent period, days | 1.25 (1–2) | 11–13,16 |
| Duration of symptomatic infection, days | 5.1 (3–7) | 12–14,15 |
| Duration of asymptomatic infection, days | 4.1 (2–6) | 14 |
| Transmissibility of asymptomatic infection relative to symptomatic infection | 0.5 (not varied) | 14 |
| Transmissibility of treated sensitive infection relative to untreated infection | 0.4 (not varied) | 12,18 |
| Transmissibility of oseltamivir-resistant infection relative to sensitive infection | 0.8 (0.6–0.9) | Assumption |
| Transmissibility of zanamivir-resistant infection relative to sensitive infection | 0.8 (0.6–0.9) | Assumption |
| Probability of developing symptomatic infection | 0.6 (0.5–0.7) | 13,15 |
| Rate of developing resistance during treatment with oseltamivir | 0.0072 (0.009–0.0072) day−1 | 13,18 |
| Rate of developing resistance during treatment with zanamivir | 0.0036 (0.0009–0.0036) day−1 | 23 (Assumption: at least 50% less than oseltamivir) |
| Minimum fraction of symptomatic infection treated with oseltamivir | 2% (not varied) | Assumption |
| Treatment level of symptomatic infection | 2%–100% |
Figure 6).
Sensitivity analyses for the variation in the optimal switch time (days) with different treatment levels and R0=1.6 for (a) unlimited and (b) limited (1.8%) stockpiles of zanamivir. Sensitivity analyses for the variation in the ratio of the cumulative number of oseltamivir resistance to the total infections with different treatment levels and R0=1.6 for (c) unlimited and (d) limited (1.8%) stockpiles of zanamivir. The ranges of other parameter values used for these simulations are given in Table 1. For a given treatment level, the circle with a dot at the centre is the median of the optimal switch time, the wide bars show the extent of the interquartile range, the lines represent the extent of data points that are not outlying and the empty circles indicate outliers
RESULTS
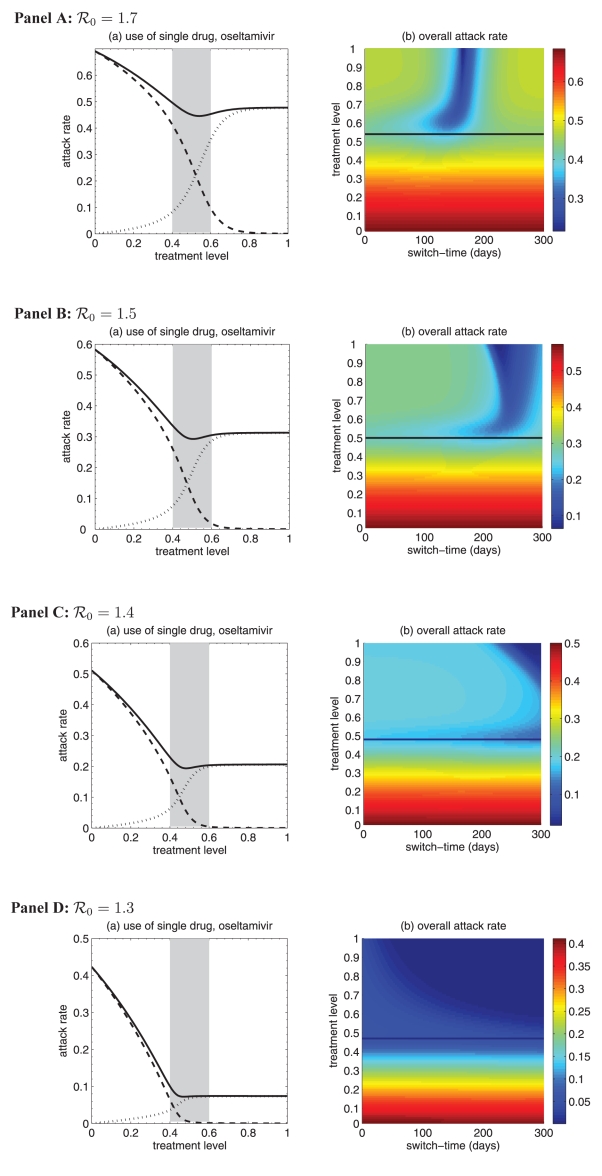
Simulations were first run for the case in which only a single drug was available for treatment of ill individuals. This scenario applies to many countries that have been investing in large stockpiles of a single drug – oseltamivir; it also provides an important baseline for comparison when two drugs are available. In general, continuous large-scale use of an antiviral drug selects for the emergence and spread of virus strains that are resistant to that drug, leading to large outbreaks of resistant infections. On the other hand, sparse use of the drug will have very little effect on the disease and, thus, large outbreaks of sensitive infections will occur. Consistent with previous observations (13,27), at some intermediate level of drug use, the overall attack rate is minimized (Figure 2a). This intermediate level, referred to as ‘fc’, will play an important role in the analysis of the two-drug scenario.
Previous research (28) considered the use of a small stockpile of a secondary drug (eg, zanamivir) at the beginning of an outbreak (either exclusively or in combination with the primary drug), as a means of hedging against the emergence of antiviral resistance. The current analysis extends these results, and considers the possibility that the attack rate might be even further lowered by switching to the secondary drug at other stages of the outbreak (Figure 2b), rather than solely at the beginning.
The optimal switch time
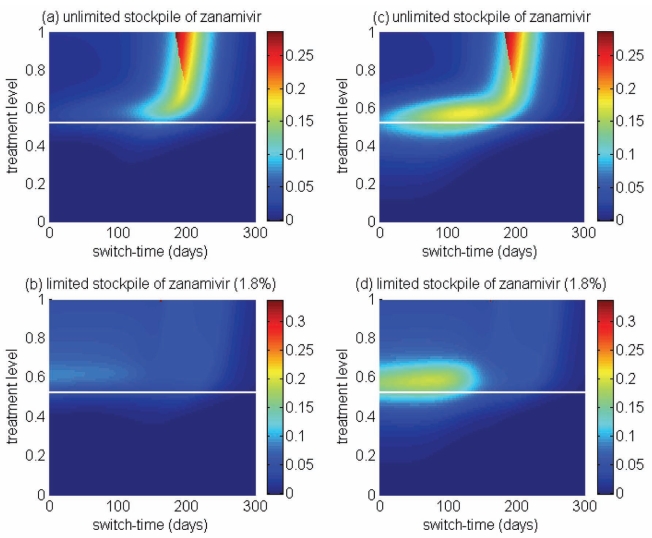
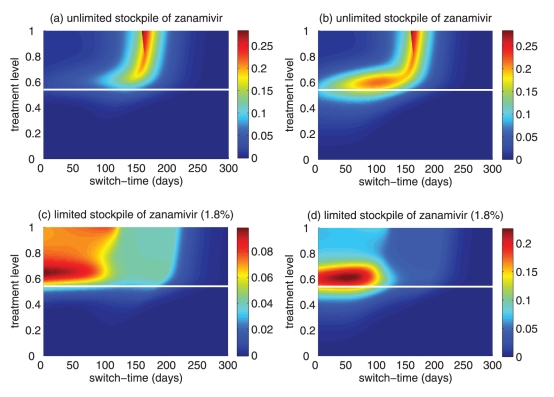
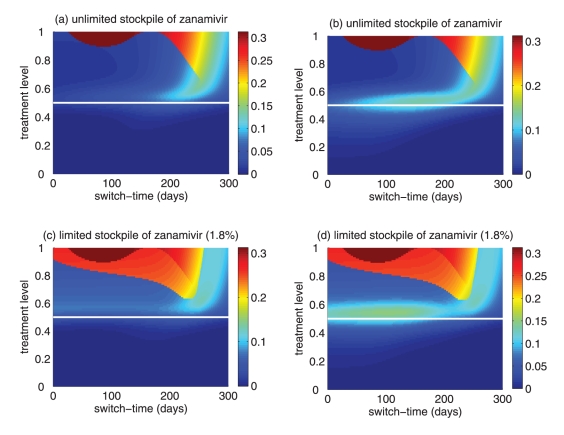
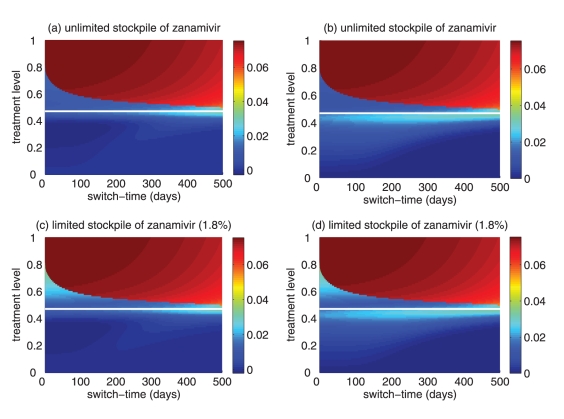
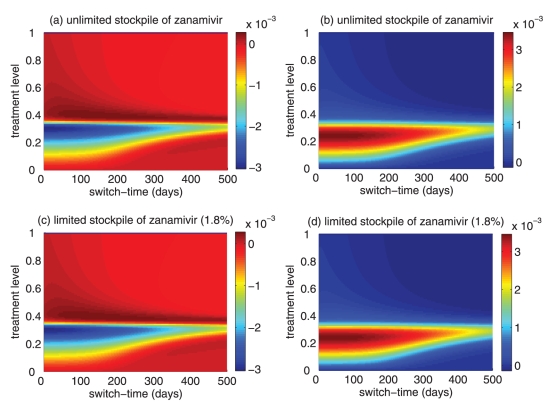
For the baseline values of the parameters specified in Table 1, it was observed that using zanamivir for a fixed period of time either decreased or had no effect on the overall attack rate, compared with the single drug model. This is true regardless of when the switch to zanamivir occurs (Figure 3a,c). Simulations also indicated that it was often optimal (in terms of the reduction in the overall attack rate) to delay the switch time for a certain amount of time after the onset of the outbreak (Figure 3a,c), and this delay depended on several factors discussed below.
Figure 3).
Reduction in the overall attack rate with two drugs versus a single drug for (a) unlimited and (b) limited (1.8%) stockpiles of zanamivir. Reduction in the resistant attack rate with two drugs versus a single drug for (c) unlimited and (d) limited (1.8%) stockpiles of zanamivir. The horizontal axis shows the time at which the switch to zanamivir as the primary drug occurs for different treatment levels displayed on the vertical axis. The solid (white) line corresponds to 52% treatment level (fc=0.52) at which the overall attack rate is minimized for a single drug (oseltamivir)
A critical advantage of the secondary drug, as has been shown in practice during the 2009 H1N1 pandemic, is that individuals with infection resistant to the primary drug can be effectively treated. Therefore, it is natural to expect that, in situations when resistance is a minor concern, the benefits of switching drugs will be limited. As illustrated in Figure 3, for treatment levels below the threshold fc, the change in the attack rate is relatively independent of switch time. On the other hand, for treatment levels above fc, the switch time can have a very dramatic effect on attack rates.
Treatment levels that are most plausible during pandemic outbreaks probably lie within the range of 40% to 60% (28), which encompasses the threshold value fc, above which large variations in attack rates can occur (Figure 3). This makes it difficult to provide precise recommendations for the use of drugs; however, comparison of the potential outcomes of competing strategies will allow public health authorities to optimize policy decisions for achieving maximum effectiveness of antiviral measures. To draw out such comparisons, the results regarding the optimal switch time across the entire range of treatment levels, for both limited and unlimited stockpiles of the secondary drug, are summarized below:
For treatment levels below fc, the cost of resistance in terms of reduced transmissibility prevents widespread occurrence of resistance, simply because the selective pressure favouring resistance is relatively weak. In this case, large outbreaks of the sensitive strain are likely to take place and the time at which the switch to the secondary drug occurs has no significant effect on the overall attack rate (Figure 3a,b). Although not explored in the present article, previous research shows that the specific value of fc depends largely on the cost of resistance (13). If, for example, compensatory mutations that ameliorate the costs of resistance arise during the course of treatment (29), then the value of fc may decrease. If fc decreases sufficiently, then resistance may gain a competitive advantage and readily spread, even for relatively low treatment levels (13).
For high treatment levels above fc, the evolution of resistance is a critical factor determining the optimal switch time, and there is an optimal intermediate switch time at which maximum reduction in the overall attack rate is achieved (Figure 3a). For an unlimited stockpile of zanamivir, switching before this time leads to a larger attack rate, mostly due to widespread zanamivir-resistant infections. Switching after the optimal time also leads to a greater attack rate, mostly due to a significant number of oseltamivir-resistant infections. Similar conclusions also hold true for a limited stockpile of zanamivir (Figure 3b); however, the effect of oseltamivir resistance is more pronounced than when there is an unlimited stockpile of zanamivir. Although the benefit of switching to zanamivir is significantly less for a stockpile of 1.8%, a small delay in switching can still be more advantageous.
For intermediate treatment levels (40% to 60%), the switch time tends to have less of an effect on the reduction of the overall attack rate compared with high treatment levels (Figure 3a,b). Nevertheless, delaying the switch to zanamivir can still be beneficial. Moreover, the effect that switch time has on the resistant attack rate depends on the size of the drug stockpile. For example, when the stockpile is unlimited, switching to zanamivir during the early stages of the outbreak results in a higher resistant attack rate than switching later (Figure 3c). In contrast, an early switch can be more effective in reducing the resistant attack rate for a limited stockpile of zanamivir (Figure 3d). The cost of missing the optimal switch time (in terms of increased overall attack rate) is relatively minor for treatment levels below fc, but becomes more substantial as the treatment level increases above fc (Figure 4a,b).
Sensitivity analyses were performed, and results presented in the current study indicate that model projections with variation in parameter values were robust for the relationship between the treatment level and optimal switch time (Figure 6a,b).
Thresholds of oseltamivir resistance
Of greater utility from the public health standpoint is the ratio of the cumulative number of oseltamivir-resistant infections to the total infections at the optimal switch time, because this is a quantity that can be readily monitored. For an unlimited stockpile of zanamivir, Figure 5a illustrates that, for treatment levels above fc, this ratio is typically very high; resistance spreads very rapidly through the population and, therefore, it tends to be optimal to delay switching to the secondary drug until resistance to the primary drug reaches a high threshold. For a small stockpile of zanamivir, qualitatively different results were observed: there is a wide range of ratios that result in attack rates that are similar to the optimal switch ratio, and there is also a substantial portion of the parameter space for which switching at a low ratio (below 20%) is optimal (Figure 5b). In this case, the cost of an early switch time is very limited because the stockpile of zanamivir is typically depleted before widespread resistance to this drug can occur.
For an unlimited stockpile of zanamivir, the optimal switching ratio spans nearly the entire range, changing from approximately 40% for intermediate treatment levels (above fc) to more than 90% for higher levels (Figure 5a). For a small stockpile of zanamivir, switching at a low ratio of cumulative oseltamivir resistance (below 20%) could result in a greater reduction of the overall attack rate, particularly for intermediate treatment levels above fc (Figure 5b). These observations were also tested by performing sensitivity analyses for the relationship between the treatment level and threshold of oseltamivir resistance over a wide range of parameter values (Figures 6c,d).
The conclusions discussed above relate to a specific choice of parameter values; however, they appear to be robust to increasing the value of R0 above 1.5 and also variation in parameter space (see Appendix). However, decreases in R0 tend to very slightly decrease fc, and further increase the optimal switch time and the corresponding ratio of oseltamivir resistance. Reducing R0 by application of mitigation measures that are effective only against the sensitive strain (such as the use of drugs as prophylaxis) would increase the incidence of resistance (30) and, therefore, it is expected that the threshold for switching to the secondary drug will be reached more quickly at intermediate levels. This scenario has not been investigated because the use of drugs for large-scale prophylaxis is not recommended in the Canadian pandemic plan.
To consider the effect of other transmission-reducing interventions, the model was simulated with R0 values of less than 1.5 (see Appendix). It was observed that, if these interventions reduced R0 below 1.3, then the use of a secondary drug had no significant benefits compared with the scenario in which a single drug was used. In this case, maximum reduction in the overall attack rate using a single drug (oseltamivir) occured at higher treatment levels when R0 decreased below 1.3. Due to a very low ratio of cumulative oseltamivir resistance to the total infections, the effect of switching to zanamivir at any treatment level (in terms of reduction in the overall attack rate) is negligible, regardless of the size of the stockpile. Considering the results presented for higher values of R0, the findings indicate that if the application of other intervention measures fail to bring R0 below 1.3, then the strategic use of the secondary drug becomes crucial for disease mitigation.
DISCUSSION
The results presented in the current study provide important qualitative insights into the most effective strategies for antiviral usage. A primary concern of any treatment program involving the use of drugs is the emergence of drug resistance. Our results demonstrate that switching between the use of two drugs, even if one is in relatively limited supply, can be an effective means of controlling the spread of resistance and reducing the overall attack rate. Previous research examined the effectiveness of initially dispensing a limited secondary drug (eg, zanamivir) early on during an outbreak (28), as a means of hedging against the spread of resistance to the primary drug. Our findings complement these results by considering a broader scope of possible strategies. In particular, in addition to considering the effect of using a secondary drug at the beginning of the outbreak, the consequences of using the secondary drug at later stages in the outbreak have been explored. The results reveal that the use of a secondary drug can indeed have a substantial effect on mitigating the spread of drug resistance, thereby lowering the overall attack rate. Furthermore, although using a limited supply of the secondary drug at the beginning of the outbreak is beneficial, it can occassionally be even more effective at reducing the overall attack rate when used later in the outbreak.
When a secondary drug is available, the possibility of resistance to each drug (and potentially cross-resistance to both drugs) should be considered for optimizing antiviral use to mitigate the impact of disease on the population. The results suggest that for plausible treatment levels below 60%, the optimal time for dispensing the secondary drug (eg, zanamivir) depends strongly on both the size of the drug stockpile and the treatment level; therefore, it is difficult to make specific recommendations on the timing of the switch to zanamivir. In contrast, while the ratio of cumulative oseltamivir resistance to the total number of infections also depends on the stockpile size and treatment level, maximum reduction in the overall attack rate was observed when the switch to zanamivir occurred for a ratio below 20% (Figures 5a,b; 6c,d). Furthermore, the sensitivity of this ratio to both the size of stockpile and treatment level declines as R0 decreases. Our sensitivity analyses also indicate that if R0 is less than 1.4, a switch ratio below 20% is often optimal for the entire range of treatment levels (see Appendix).
Our investigation in the present study was directed toward finding the optimal switch time, and the corresponding threshold of oseltamivir resistance, given a particular level of treatment. Because the scale and timelines for the use of different drugs are potentially under the control of public health decision makers, it is of greater importance to identify the most effective antiviral strategy when both the level of treatment and the switch time are allowed to vary. Not surprisingly, the best possible outcome is to implement high treatment levels, with a timely switch from primary to secondary drug. However, determining the precise timing for the switch at these levels is extremely difficult, due to its sensitivity to changes in the treatment level. Lower treatment levels appear to reduce this sensitivity (Figures 3; 6a,b), suggesting a trade-off between the treatment level and the costs of missing the optimal switch time.
The results presented are based on a compartmental model with the simplifying assumption of homogeneity in population interactions, in the absence of stochastic effects that may affect disease spread, particularly at the onset of the outbreak. We confined the model to evaluate the epidemiological outcome of different treatment strategies in the context of drug resistance, without explicit inclusion of other mitigation measures, such as antiviral prophylaxis or vaccination. Previous research showed that, in the presence of transmissible drug resistance, strategies that prioritize treatment of only ill individuals are more effective in reducing morbidity and mortality during pandemic outbreaks (31). When prophylactic use of drugs is considered, it has been suggested that allocating different drugs for treatment and prophylaxis may constrain resistance emergence and spread in the population (32). It is, however, important to note that the prevalence of resistance can result from an interaction with fitness-enhancing mutations rather than solely from direct drug selection pressure (29,33). As considered in the present study, the effect of public health measures that are equally effective against all virus strains can be regarded as a reduction in the transmissibility of the disease or, effectively, as a reduction in the the reproduction number of secondary infections. In the absence of data on the effectiveness of antiviral drugs against the nH1N1 virus and the frequency of resistance emergence, the model was simulated using parameter estimates from published studies on seasonal influenza epidemics, which are subject to some degree of uncertainty. Nonetheless, our comparative evaluation of strategies for the use of two drugs, combined with the sensitivity analyses, provides significant projections that can be used to inform policy decisions and optimize antiviral measures for mitigating pandemic outbreaks.
CONCLUSION
The use of a limited supply of a secondary antiviral drug (eg, zanamivir) can substantially reduce the overall attack rate during pandemic outbreaks by mitigating the spread of drug resistance. The optimal time at which the secondary drug should be dispensed depends on several factors, including the treatment level and the size of the stockpile of the secondary drug. Given a limited stockpile of zanamivir (1.8% without replenishment), and assuming that treatment levels are maintained below 60%, our findings suggest that zanamivir should be considered to be the primary drug for low thresholds of cumulative oseltamivir resistance.
Acknowledgments
This research was supported by the Canadian Institute of Health Research (CIHR), the Natural Sciences and Engineering Research Council of Canada (NSERC), and Mathematics of Information Technology and Complex Systems (MITACS). TD, JW, and SM are members of the Pandemic Influenza Outbreak Research Modelling Team (Pan-InfORM), and would like to acknowledge the support of CIHR Catalyst Grant for Pandemic Preparedness (Grant no: 101785). The authors also thank the reviewers for insightful comments that have greatly improved the article.
Appendix. Strategies for Use of Oseltamivir and Zanamivir during Pandemic Outbreaks
Elsa Hansen, Troy Day, Julien Arino, Jianhong Wu, Seyed M. Moghadas
This appendix provides details of the model structure with additional simulations that were performed to test the robustness of the results presented in the main text. In Section 1, we present a basic framework that describes the dynamics of influenza transmission in a population. We use this framework to develop the structure of the general model in Section 2. Finally, we present additional simulations corresponding to a wide range of reproduction numbers of disease transmission in Section 3.
1. The Basic Framework
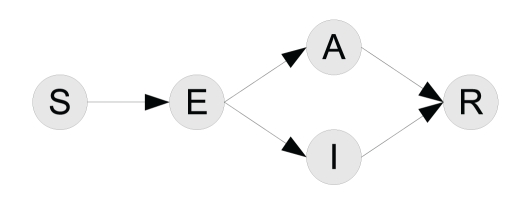
To model the spread of an infectious disease in a population, one divides the population into various compartments with respect to the epidemiological status of the individuals. The model presented below, which is the base for the general model with two drugs, considers the following classes: (i) individuals that are susceptible to the disease; (ii) individuals that are infected but currently undergoing latency and thus not transmitting the disease; (iii) individuals that are infectious and actively transmitting the disease and displaying symptoms (symptomatic infection); (iv) individuals that are infected and actively transmitting the disease without showing clinical symptoms (asymptomatic infection); and (v) individuals that have recovered from infection, and therefore are not susceptible to re-infection. The numbers at time t of individuals in these compartments are denoted by S(t), E(t), I(t), A(t), and R(t) respectively, although it is common to omit the dependence on t when no ambiguity arises.
Figure 1.
Flow diagram for the SEAIR model showing the movements of individuals between the different compartments. The compartment of removed individuals does not affect the epidemiological dynamics, and therefore is ignored in the remainder of this manuscript.
We use the flow diagram in Figure 1 to hypothesize the possible transitions between compartments [1]. In Figure 1, we assume that a susceptible individual, upon infection, progresses to the E compartment. Depending on the probability of developing symptoms, they can then either proceed to the symptomatic I compartment or the asymptomatic A compartment. Progression to the compartment denoted by R, means that the individuals will not be participating in the process of disease spread in the population, and we therefore ignore this compartment. Using these compartments, the following set of equations describes the dynamics of disease transmission in the population, in the absence of any control measures:
 |
where the derivative of the compartments (denoted by “.” above the variable) is with respect to the time, and describes the rate of change in the number of individuals in the corresponding compartments. For the relatively short time-scale of an epidemic, we ignore changes in the population size due to birth or natural death.
The parameters used in (1) have the following meaning: β is the transmission rate of disease between susceptible and infected individuals; δA is the transmissibility of asymptomatic infection relative to symptomatic infection; 1/μE is the mean latent period following exposure to the disease; 1/μA and 1/μ are respectively the mean duration of infectious periods for asymptomatic and symptomatic infections; and fs is the fraction of infected individuals who develop symptomatic infection.
A key parameter in epidemiological models is the basic reproduction number that represents the average number of new infections produced by a single infected case introduced into a completely naïve population. For the model presented above, this reproduction number can be calculated using a previously established technique [7], which yields the expression:
 |
where S0 is the size of the susceptible population at the time of disease outset. For a given reproduction number, the transmission rate of disease can be easily calculated from the expression for ; this was done for the purpose of simulations using parameter values given in Table 1 of the main text.
2. The General Model
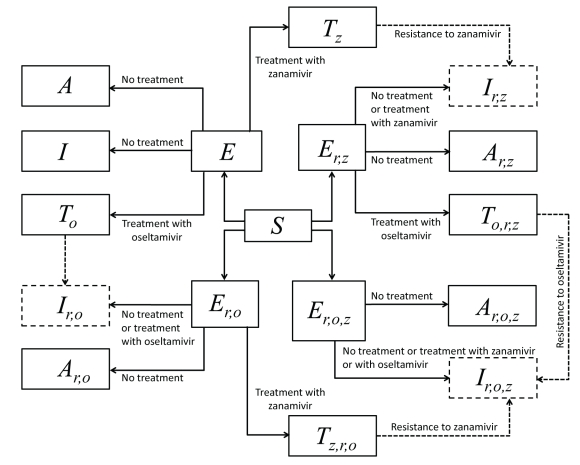
The general model is built upon the simple model (1) by adding compartments for treatment and infection with strains resistant to treatment. The flow diagram for the model is shown in Figure 2.
Treatment of sensitive infection.
As in Section 1, a fraction fs of exposed individuals develops symptoms and the remaining fraction 1 — fs develops an asymptomatic infection. Of those who develop symptoms, a fraction fT is treated with antiviral drugs, and the remaining fraction 1 – fT receives no treatment. Among those who receive treatment, we assumed that a fraction fO is treated with oseltamivir and move to the TO compartment. The remaining fraction 1 – fO is treated with zanamivir and thus progresses to the TZ compartment.
Emergence of resistant strains to one antiviral drug.
Individuals treated with oseltamivir and zanamivir may develop de novo resistance, respectively, at the rates ρO and ρZ. An individual treated with oseltamivir who develops resistance moves to the Ir,O compartment, where the subscript r, O represents resistance to oseltamivir. Similarly, an individual treated with zanamivir who becomes resistant to zanamivir moves to the Ir,Z, where the subscript r, Z represents resistance to zanamivir.
Figure 2.
Model diagram (corresponding to Figure 1 in the main text) showing the different pathways of infection with treatment, emergence and transmission of resistant infection. Dashed arrows show the emergence of de novo resistance during treatment, and dashed boxes show symptomatic infections with resistance to oseltamivir, zanamivir, or both (cross-resistance).
Transmission of strains resistant to one antiviral drug.
Individuals harbouring resistant strains, either to oseltamivir or zanamivir, can transmit the disease and generate new infections that are resistant to these drugs. Because of the cost of resistance, we assume that the transmissibility of these resistant strains is lower than that of the sensitive strain. For the oseltamivir and zanamivir-resistant strains, transmissibility is reduced by factors δr,O and δr,Z, respectively. Hence there are two additional pathways of infection: one for infection with the oseltamivir resistant strain, and the other for the zanamivir resistant strain. Within those pathways, the structure of sensitive infections is replicated: individuals in the Er,O, Ar,O and Ir,O compartments are infected with the strain that is resistant to oseltamivir. Individuals in the Er,Z, Ar,Z and Ir,Z compartments are infected with the strain that is resistant to zanamivir.
Treatment of individuals with infection resistant to one antiviral drug.
Individuals with symptomatic infection resistant to oseltamivir and treated with zanamivir move to the TZ,r,O compartment. Similarly, those with a symptomatic zanamivir-resistant infection treated with oseltamivir move to the TO,r,Z compartment.
Emergence of cross-resistant strains.
While we found no published literature for the emergence of cross-resistance, its potential was assumed in our model. We considered the possibility that an individual infected with oseltamivir-resistant strain develops a secondary resistance during treatment with zanamivir. As a similar scenario was considered for individuals infected with zanamivir-resistant strain who develop a secondary resistance during treatment with oseltamivir. The rate of emergence of cross-resistance was assumed to be the same as developing single resistance, given by ρO and ρZ for oseltamivir and zanamivir treated patients, respectively. Symptomatically infected individuals with cross-resistance to both drugs belong to the Ir,O,Z compartment.
Transmission of cross-resistant strains.
At the time when a strain resistant to both oseltamivir and zanamivir emerges, direct transmission of this strain to susceptible individuals becomes possible, and a fourth pathway of infection arises. Again, the structure of the system of sensitive infections is replicated, with compartments Er,O,Z, Ar,O,Z and Ir,O,Z for exposed, asymptomatic, and symptomatic infections, respectively. We assumed that the transmissibility of a cross-resistant strain is reduced by the product δr,0δr,Z, compared with the sensitive strain.
With the above description, the general model is expressed by the following set of equations:
The compartments of the model and associated parameters are summarized in Tables 1 and 2, respectively.
Remark.
The impact of antiviral drugs can be modelled as a reduction in infectiousness from the start of treatment, but no reduction in duration, or a reduction in duration of infectiousness but no reduction in infectiousness per day, or some combination of both. The key point is that the overall impact should match the reduction in secondary attack rates seen in household studies [5]. Consistent with previous work [4, 6], we modelled the effectiveness of antiviral drugs as a reduction in absolute infectiousness (by 60%).
Table 1.
Compartments of the general model with their description.
| compartment | description |
|---|---|
| S | susceptible population |
| E | population exposed to sensitive infection |
| Er,O | population exposed to oseltamivir-resistant strain |
| Er,Z | population exposed to zanamivir-resistant strain |
| Er,O,Z | population exposed to cross-resistant strain |
| A | asymptomatic with sensitive infection |
| Ar,O | asymptomatic with oseltamivir-resistant infection |
| Ar,Z | asymptomatic with zanamivir-resistant infection |
| Ar,O,Z | asymptomatic with cross-resistant infection to oseltamivir and zanamivir |
| I | untreated symptomatic with sensitive infection |
| Ir,O | symptomatic infection resistant to oseltamivir (whether treated or not with oseltamivir) |
| Ir,Z | symptomatic infection resistant to zanamivir (whether treated or not with zanamivir) |
| Ir,O,Z | symptomatic infection cross-resistant to both drugs (whether treated or not with either drug) |
| TO | sensitive infection treated with oseltamivir |
| TZ | sensitive infection treated with zanamivir |
| TO,r,Z | zanamivir-resistant infection treated with oseltamivir |
| TZ,r,O | oseltamivir-resistant infection treated with zanamivir |
3. Numerical Simulations
Here we present simulations corresponding to those reported in the main text, to illustrate the robustness of the results and possible changes for above the baseline value used for simulations in the main text, and below the baseline value of . These values of correspond to the estimated range for the transmissibility of the nH1N1 virus [2, 3]. Further simulations for the sensitivity analysis are presented in an additional supplementary document (http://pan-inform.uwinnipeg.ca/Publications.htm).
Table 2.
Parameters of the general model with their description.
| parameter | description |
|---|---|
| β | baseline transmission rate (for the sensitive infection) |
| δO | transmissibility of treated sensitive infection with oseltamivir relative to untreated infection |
| δZ | transmissibility of treated sensitive infection with zanamivir relative to untreated infection |
| δA | transmissibility of asymptomatic infection relative to symptomatic infection |
| δr,O | transmissibility of oseltamivir-resistant strain relative to the sensitive strain |
| δr,Z | transmissibility of zanamivir-resistant strain relative to the sensitive strain |
| fs | fraction of exposed individuals that develops symptoms |
| fT | fraction of symptomatic infections that is treated |
| fO | fraction of treated infections that receives oseltamivir |
| ρO | rate of developing de novo resistance to oseltamivir |
| ρZ | rate of developing de novo resistance to zanamivir |
| 1/μE | mean duration of latency |
| 1/μA | mean duration of asymptomatic infection |
| 1/μ | mean duration of symptomatic infection |
3.1. Simulations for the use of a single drug (oseltamivir), and two drugs when the switch to the secondary drug (zanamivir) occurs at different stages of the outbreak
These simulations correspond to Figure 1 in the main text in which the baseline value was used.
Figure 3.
Panels A,B,C,D: (a) Attack rates of sensitive strain (dashed curve), resistant strain (dotted curve), and both strains (solid curve), when only a single drug (e.g., oseltamivir) is used during the entire outbreak. (b) The overall attack rate as a function of the treatment level and the switch-time for start of zanamivir as the primary drug. Solid lines (in Panels A,B,C,D) correspond to the treatment levels (fc) that minimize the overall attack rate when oseltamivir is the only drug used for treatment of symptomatic infections: fc = 0.54 for ; fc = 0.50 for ; fc = 0.0.48 for ; and fc = 0.47 for .
3.2. Simulations for the use of two drugs with .
Figure 4.
Reduction in the overall attack rate with two drugs versus a single drug for: (a) unlimited, and (c) limited (1.8%) stockpile of zanamivir. Reduction in the resistant attack rate with two drugs versus a single drug for: (b) unlimited, and (d) limited (1.8%) stockpile of zanamivir. The horizontal axis shows the time at which the switch to zanamivir as the primary drug occurs for different treatment levels displayed on the vertical axis. The solid (white) line corresponds to 54% treatment level (fc) at which the overall attack rate is minimized for a single drug (oseltamivir).
Figure 5.
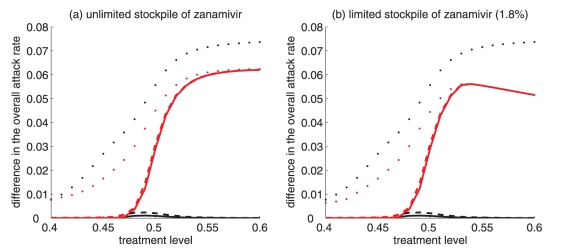
Difference between the largest attack rate when the switch to zanamivir occurs at a different time (earlier or later than the optimal switch-time) and the minimum attack rate (obtained at the optimal switch-time) for: (a) unlimited, and (b) limited (1.8%) stockpile of zanamivir. Solid curves illustrate the difference in attack rates when switch occurs within 15 days earlier (red curve) and later (black curve) than the optimal switch-time. Dashed curves illustrate the difference in attack rates when the switch occurs within 30 days earlier (red curve) and later (black curve) than the optimal switch-time. Dotted curves show the difference in attack rates when the switch occurs any time before (red curve) and after (black curve) the optimal switch-time.
Figure 6.
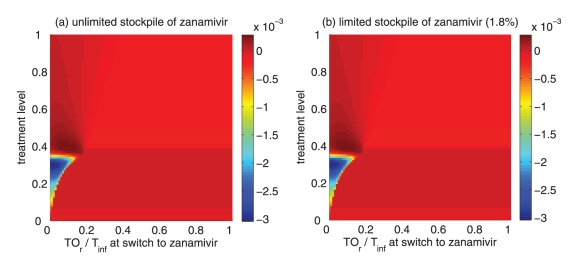
Reduction in the overall attack rate with two drugs versus a single drug for: (a) unlimited, and (b) limited (1.8%) stockpile of zanamivir. The horizontal axis shows the ratio of the cumulative number of oseltamivir-resistance (TOr) to the total number of infections (Tinf), when the switch to zanamivir occurs for different treatment levels displayed on the vertical axis. The solid (white) line corresponds to 54% treatment level (fc) at which the overall attack rate is minimized for a single drug (oseltamivir).
3.3. Simulations for the use of two drugs with .
Figure 7.
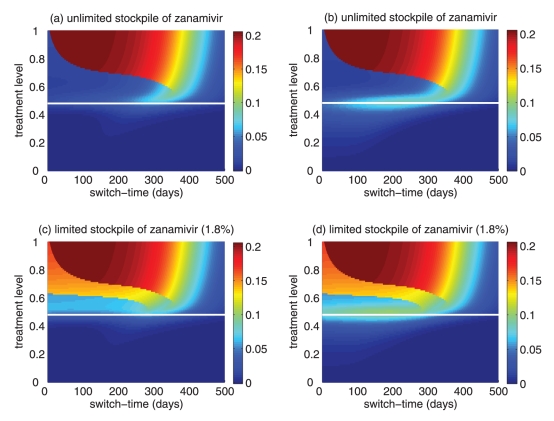
Reduction in the overall attack rate with two drugs versus a single drug for: (a) unlimited, and (c) limited (1.8%) stockpile of zanamivir. Reduction in the resistant attack rate with two drugs versus a single drug for: (b) unlimited, and (d) limited (1.8%) stockpile of zanamivir. The horizontal axis shows the time at which the switch to zanamivir as the primary drug occurs for different treatment levels displayed on the vertical axis. The solid (white) line corresponds to 50% treatment level (fc) at which the overall attack rate is minimized for a single drug (oseltamivir).
Figure 8.
Difference between the largest attack rate when switch to zanamivir occurs at a different time (earlier or later than the optimal switch-time) and the minimum attack rate (obtained at the optimal switch-time) for: (a) unlimited, and (b) limited (1.8%) stockpile of zanamivir. Solid curves illustrate the difference in attack rates when switch occurs within 15 days earlier (red curve) and later (black curve) than the optimal switch-time. Dashed curves illustrate the difference in attack rates when switch occurs within 30 days earlier (red curve) and later (black curve) than the optimal switch-time. Dotted curves show the difference in attack rates when switch occurs any time before (red curve) and after (black curve) the optimal switch-time.
Figure 9.
Reduction in the overall attack rate with two drugs versus a single drug for: (a) unlimited, and (b) limited (1.8%) stockpile of zanamivir. The horizontal axis shows the ratio of the cumulative number of oseltamivir-resistance (TOr) to the total number of infections (Tinf), when the switch to zanamivir occurs for different treatment levels displayed on the vertical axis. The solid (white) line corresponds to 50% treatment level (fc) at which the overall attack rate is minimized for a single drug (oseltamivir).
3.4. Simulations for the use of two drugs with .
Figure 10.
Reduction in the overall attack rate with two drugs versus a single drug for: (a) unlimited, and (c) limited (1.8%) stockpile of zanamivir. Reduction in the resistant attack rate with two drugs versus a single drug for: (b) unlimited, and (d) limited (1.8%) stockpile of zanamivir. The horizontal axis shows the time at which the switch to zanamivir as the primary drug occurs for different treatment levels displayed on the vertical axis. The solid (white) line corresponds to 48% treatment level (fc) at which the overall attack rate is minimized for a single drug (oseltamivir).
Figure 11.
Difference between the largest attack rate when switch to zanamivir occurs at a different time (earlier or later than the optimal switch-time) and the minimum attack rate (obtained at the optimal switch-time) for: (a) unlimited, and (b) limited (1.8%) stockpile of zanamivir. Solid curves illustrate the difference in attack rates when switch occurs within 15 days earlier (red curve) and later (black curve) than the optimal switch-time. Dashed curves illustrate the difference in attack rates when switch occurs within 30 days earlier (red curve) and later (black curve) than the optimal switch-time. Dotted curves show the difference in attack rates when switch occurs any time before (red curve) and after (black curve) the optimal switch-time.
Figure 12.
Reduction in the overall attack rate with two drugs versus a single drug for: (a) unlimited, and (b) limited (1.8%) stockpile of zanamivir. The horizontal axis shows the ratio of the cumulative number of oseltamivir-resistance (TOr) to the total number of infections (Tinf), when the switch to zanamivir occurs for different treatment levels displayed on the vertical axis. The solid (white) line corresponds to 48% treatment level (fc) at which the overall attack rate is minimized for a single drug (oseltamivir).
3.5. Simulations for the use of two drugs with .
Figure 13.
Reduction in the overall attack rate with two drugs versus a single drug for: (a) unlimited, and (c) limited (1.8%) stockpile of zanamivir. Reduction in the resistant attack rate with two drugs versus a single drug for: (b) unlimited, and (d) limited (1.8%) stockpile of zanamivir. The horizontal axis shows the time at which the switch to zanamivir as the primary drug occurs for different treatment levels displayed on the vertical axis. The solid (white) line corresponds to 47% treatment level (fc) at which the overall attack rate is minimized for a single drug (oseltamivir).
Figure 14.
Difference between the largest attack rate when switch to zanamivir occurs at a different time (earlier or later than the optimal switch-time) and the minimum attack rate (obtained at the optimal switch-time) for: (a) unlimited, and (b) limited (1.8%) stockpile of zanamivir. Solid curves illustrate the difference in attack rates when switch occurs within 15 days earlier (red curve) and later (black curve) than the optimal switch-time. Dashed curves illustrate the difference in attack rates when switch occurs within 30 days earlier (red curve) and later (black curve) than the optimal switch-time. Dotted curves show the difference in attack rates when switch occurs any time before (red curve) and after (black curve) the optimal switch-time.
Figure 15.
Reduction in the overall attack rate with two drugs versus a single drug for: (a) unlimited, and (b) limited (1.8%) stockpile of zanamivir. Horizontal axis shows the ratio of the cumulative number of oseltamivir-resistance (TOr) to the total number of infections (Tinf), when switch to zanamivir occurs for different treatment levels displayed on the vertical axis. The solid (white) line corresponds to 47% treatment level (fc) at which the overall attack rate is minimized for a single drug (oseltamivir).
3.6. Simulations for the use of two drugs with .
Figure 16.
Reduction in the overall attack rate with two drugs versus a single drug for: (a) unlimited, and (c) limited (1.8%) stockpile of zanamivir. Reduction in the resistant attack rate with two drugs versus a single drug for: (b) unlimited, and (d) limited (1.8%) stockpile of zanamivir. The horizontal axis shows the time at which the switch to zanamivir as the primary drug occurs for different treatment levels displayed on the vertical axis. The solid (white) line corresponds to 100% treatment level (fc) at which the overall attack rate is minimized for a single drug (oseltamivir).
Figure 17.
Difference between the largest attack rate when switch to zanamivir occurs at a different time (earlier or later than the optimal switch-time) and the minimum attack rate (obtained at the optimal switch-time) for: (a) unlimited, and (b) limited (1.8%) stockpile of zanamivir. Solid curves illustrate the difference in attack rates when switch occurs within 15 days earlier (red curve) and later (black curve) than the optimal switch-time. Dashed curves illustrate the difference in attack rates when switch occurs within 30 days earlier (red curve) and later (black curve) than the optimal switch-time. Dotted curves show the difference in attack rates when switch occurs any time before (red curve) and after (black curve) the optimal switch-time.
Figure 18.
Reduction in the overall attack rate with two drugs versus a single drug for: (a) unlimited, and (b) limited (1.8%) stockpile of zanamivir. The horizontal axis shows the ratio of the cumulative number of oseltamivir-resistance (TOr) to the total number of infections (Tinf), when the switch to zanamivir occurs for different treatment levels displayed on the vertical axis. The solid (white) line corresponds to 100% treatment level (fc) at which the overall attack rate is minimized for a single drug (oseltamivir).
Remark.
For R0 < 1.5, if fT (the fraction of ill individuals being treated) is small, then switching to zanamivir too early can sometimes result in a higher attack rate. This is due to the fact that the use of zanamivir decreases the resistant attack rate (since zanamivir treated individuals are less prone to developing resistance), and hence reduces the competitive interference between different strains. This leads to a slight increase in the overall attack rate as a result of higher number of infections caused by the sensitive strain. This effect is only noticeable for low values of fT, for which few resistant cases may be generated with no subsequent outbreak. In other words, the benefit of switching to zanamivir (i.e., decreasing resistance) is outweighed by the fitness advantage of the sensitive strain.
3.7. Sensitivity analyses for the use of two drugs with .
Figure 19.
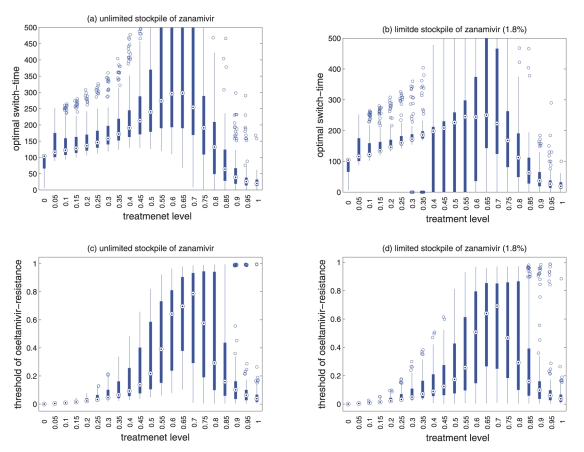
Sensitivity analyses for the variation in the optimal switch-time (days) with different treatment levels and R0 = 1.7 for (a) unlimited, and (b) limited (1.8%) stockpile of zanamivir. Sensitivity analyses for the variation in the ratio of cumulative number of oseltamivir-resistance (TOr/Tinf) with different treatment levels and R0 = 1.7 for (a) unlimited, and (b) limited (1.8%) stockpile of zanamivir. The ranges of other parameter values used for these simulations are given in Table 1 of the main text. For a given treatment level, the circle with a dot at the center is the median of the optimal switch-time, the wide bars show the extent of the inter-quartile range, the lines represent the extent of data points that is not outlying, and the empty circles indicate outliers.
3.8. Sensitivity analyses for the use of two drugs with .
Figure 20.
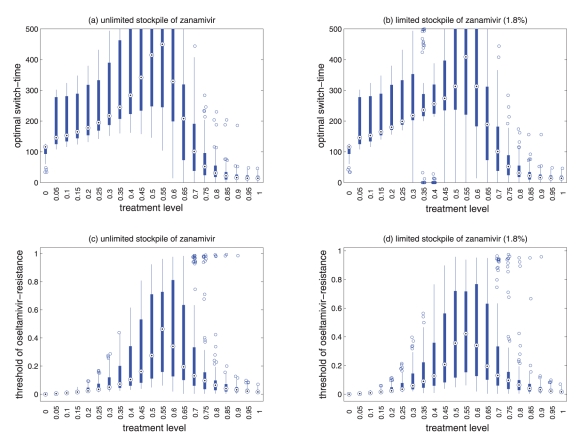
Sensitivity analyses for the variation in the optimal switch-time (days) with different treatment levels and R0 = 1.5 for (a) unlimited, and (b) limited (1.8%) stockpile of zanamivir. Sensitivity analyses for the variation in the ratio of cumulative number of oseltamivir-resistance (TOr/Tinf) with different treatment levels and R0 = 1.5 for (a) unlimited, and (b) limited (1.8%) stockpile of zanamivir. The ranges of other parameter values used for these simulations are given in Table 1 of the main text. For a given treatment level, the circle with a dot at the center is the median of the optimal switch-time, the wide bars show the extent of the inter-quartile range, the lines represent the extent of data points that is not outlying, and the empty circles indicate outliers.
3.9. Sensitivity analyses for the use of two drugs with .
Figure 21.
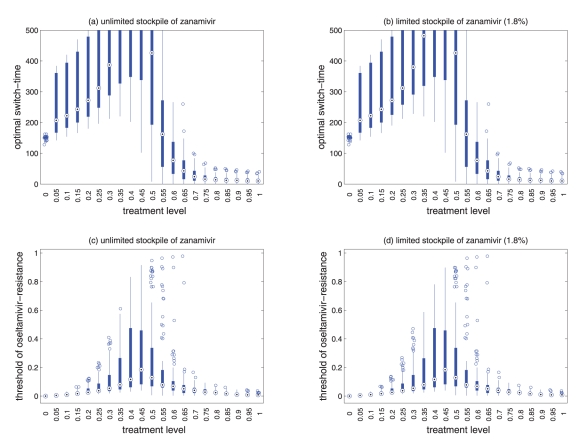
Sensitivity analyses for the variation in the optimal switch-time (days) with different treatment levels and R0 = 1.4 for (a) unlimited, and (b) limited (1.8%) stockpile of zanamivir. Sensitivity analyses for the variation in the ratio of cumulative number of oseltamivir-resistance (TOr/Tinf) with different treatment levels and R0 = 1.4 for (a) unlimited, and (b) limited (1.8%) stockpile of zanamivir. The ranges of other parameter values used for these simulations are given in Table 1 of the main text. For a given treatment level, the circle with a dot at the center is the median of the optimal switch-time, the wide bars show the extent of the inter-quartile range, the lines represent the extent of data points that is not outlying, and the empty circles indicate outliers.
3.10. Sensitivity analyses for the use of two drugs with .
Figure 22.
Sensitivity analyses for the variation in the optimal switch-time (days) with different treatment levels and R0 = 1.3 for (a) unlimited, and (b) limited (1.8%) stockpile of zanamivir. Sensitivity analyses for the variation in the ratio of cumulative number of oseltamivir-resistance (TOr/Tinf) with different treatment levels and R0 = 1.3 for (a) unlimited, and (b) limited (1.8%) stockpile of zanamivir. The ranges of other parameter values used for these simulations are given in Table 1 of the main text. For a given treatment level, the circle with a dot at the center is the median of the optimal switch-time, the wide bars show the extent of the inter-quartile range, the lines represent the extent of data points that is not outlying, and the empty circles indicate outliers.
3.11. Sensitivity analyses for the use of two drugs with .
Figure 23.
Sensitivity analyses for the variation in the optimal switch-time (days) with different treatment levels and R0 = 1.2 for (a) unlimited, and (b) limited (1.8%) stockpile of zanamivir. Sensitivity analyses for the variation in the ratio of cumulative number of oseltamivir-resistance (TOr/Tinf) with different treatment levels and R0 = 1.2 for (a) unlimited, and (b) limited (1.8%) stockpile of zanamivir. The ranges of other parameter values used for these simulations are given in Table 1 of the main text. For a given treatment level, the circle with a dot at the center is the median of the optimal switch-time, the wide bars show the extent of the inter-quartile range, the lines represent the extent of data points that is not outlying, and the empty circles indicate outliers.
REFERENCES
- 1.Arino J, Brauer F, van den Driessche P, Watmough J, Wu J. Simple models for containment of a pandemic. J Royal Soc Int. 2006;3:453–7. doi: 10.1098/rsif.2006.0112. [DOI] [PMC free article] [PubMed] [Google Scholar]
- 2.Pourbohloul B, Ahued A, Davoudi B, et al. Initial human transmission dynamics of the pandemic (H1N1) 2009 virus in North America. Influenza Other Resp Viruses. 2009;3:215–22. doi: 10.1111/j.1750-2659.2009.00100.x. [DOI] [PMC free article] [PubMed] [Google Scholar]
- 3.Fraser C, Donnelly CA, Cauchemez S, et al. Pandemic potential of a strain of influenza a (H1N1): Early findings. Science. 2009;324:1557–61. doi: 10.1126/science.1176062. [DOI] [PMC free article] [PubMed] [Google Scholar]
- 4.Ferguson NM, Cummings DAT, Cauchemez S, et al. Strategies for containing an emerging influenza pandemic in Southeast Asia. Nature. 2005;437:209–14. doi: 10.1038/nature04017. [DOI] [PubMed] [Google Scholar]
- 5.Halloran ME, Hayden FG, Yang Y, Longini IM, Monto AS. Antiviral effects on influenza viral transmission and pathogenecity: Observations from household-based trials. Am J Epidemiol. 2007;165:212–21. doi: 10.1093/aje/kwj362. [DOI] [PubMed] [Google Scholar]
- 6.Moghadas SM, Bowman CS, Roost G, Wu J. Population-wide emergence of antiviral resistance during pandemic influenza. PLoS One. 2008;3:e1839. doi: 10.1371/journal.pone.0001839. [DOI] [PMC free article] [PubMed] [Google Scholar]
- 7.van den Driessche P, Watmough J. Reproduction numbers and sub-threshold endemic equilibria for compartmental models of disease transmission. Math Biosci. 2002;180:29–48. doi: 10.1016/s0025-5564(02)00108-6. [DOI] [PubMed] [Google Scholar]
Footnotes
AUTHORS’ CONTRIBUTIONS: Developed the model: EH, TD, JA, JW, SM; analyzed technical aspects of the model: JA, JW; conceived and performed the experiments: EH, JA; and designed the study and wrote the paper: TD, SM. All the authors have read and approved the final version of the paper.
COMPETING INTERESTS: The authors have no competing interests to declare.
REFERENCES
- 1.World Health Organization Current WHO phase of pandemic alert<http://www.who.int/csr/disease/avian_influenza/phase/en/> (Accessed on March 1, 2010).
- 2.Clark TW, Pareek M, Hoschler K, et al. Trial of influenza A (H1N1) 2009 monovalent MF59-adjuvanted vaccine – preliminary report. N Engl J Med. 2009;361:2424–35. doi: 10.1056/NEJMoa0907650. [DOI] [PubMed] [Google Scholar]
- 3.Greenberg ME, Lai MH, Hartel GF, et al. Response after one dose of a monovalent influenza A (H1N1) 2009 vaccine – preliminary report. N Engl J Med. 2009;361:2405–13. doi: 10.1056/NEJMoa0907413. [DOI] [PubMed] [Google Scholar]
- 4.Zhu F-C, Wang H, Fang H-H, et al. A novel influenza A (H1N1) vaccine in various age groups. N Engl J Med. 2009;361:2414–23. doi: 10.1056/NEJMoa0908535. [DOI] [PubMed] [Google Scholar]
- 5.Gojovic MZ, Sander B, Fisman D, Krahn MD, Bauch CT. Modelling mitigation strategies for pandemic (H1N1) 2009. CMAJ. 2009;181:673–80. doi: 10.1503/cmaj.091641. [DOI] [PMC free article] [PubMed] [Google Scholar]
- 6.Lackenby A, Thompson CI, Democratis J. The potential impact of neuraminidase inhibitor resistant influenza. Curr Opin Infect Dis. 2008;21:626–38. doi: 10.1097/QCO.0b013e3283199797. [DOI] [PubMed] [Google Scholar]
- 7.Le QM, Wertheim HF, Tran ND, van Doorn HR, Nguyen TH, Horby P, Vietnam H1N1 Investigation Team A community cluster of oseltamivir-resistant cases of 2009 H1N1 influenza. N Engl J Med. 2010;362:86–7. doi: 10.1056/NEJMc0910448. [DOI] [PubMed] [Google Scholar]
- 8.Centers for Disease Control and Prevention Drug susceptibility of swine-origin influenza A (H1N1) viruses, April 2009. MMWR. 2009;58:433–5. [PubMed] [Google Scholar]
- 9.Centers for Disease Control and Prevention Oseltamivir-resistant 2009 pandemic influenza A (H1N1) virus infection in two summer campers receiving prophylaxis – North Carolina, 2009. MMWR. 2009;58:969–72. [PubMed] [Google Scholar]
- 10.Public Health Agency of Canada The management of the national antiviral stockpile: Options report<http://www.phac-aspc.gc.ca/alert-alerte/h1n1/antivir/context-eng.php> (Accessed on March 16, 2009).
- 11.Lessler J, Reich NG, Brookmeyer R, Perl TM, Nelson KE, Cummings DA. Incubation periods of acute respiratory viral infections: A systematic review. Lancet Infect Dis. 2009;9:291–300. doi: 10.1016/S1473-3099(09)70069-6. [DOI] [PMC free article] [PubMed] [Google Scholar]
- 12.Ferguson NM, Cummings DAT, Cauchemez S, et al. Strategies for containing an emerging influenza pandemic in Southeast Asia. Nature. 2005;437:209–14. doi: 10.1038/nature04017. [DOI] [PubMed] [Google Scholar]
- 13.Moghadas SM, Bowman CS, Rost G, Wu J. Population-wide emergence of antiviral resistance during pandemic influenza. PLoS ONE. 2008;3:e1839. doi: 10.1371/journal.pone.0001839. [DOI] [PMC free article] [PubMed] [Google Scholar]
- 14.Longini IM, Jr, Nizam A, Xu S, et al. Containing pandemic influenza at the source. Science. 2005;309:1083–7. doi: 10.1126/science.1115717. [DOI] [PubMed] [Google Scholar]
- 15.Alexander ME, Bowman CS, Feng Z, et al. Emergence of drug-resistance: Implications for antiviral control of pandemic influenza. Proc R Soc B. 2007;274:1675–84. doi: 10.1098/rspb.2007.0422. [DOI] [PMC free article] [PubMed] [Google Scholar]
- 16.Tuite AR, Greer AL, Whelan M, et al. Estimated epidemiologic parameters and morbidity associated with pandemic H1N1 influenza CMAJ 2010. (In press) [DOI] [PMC free article] [PubMed] [Google Scholar]
- 17.Halloran ME, Hayden FG, Yang Y, Longini IM, Jr, Monto AS. Antiviral effects on influenza viral transmission and pathogenicity: Observations from household-based trials. Am J Epidemiol. 2007;165:212–21. doi: 10.1093/aje/kwj362. [DOI] [PubMed] [Google Scholar]
- 18.Regoes RR, Bonhoeffer S. Emergence of drug-resistant influenza virus: Population dynamical considerations. Science. 2006;312:389–91. doi: 10.1126/science.1122947. [DOI] [PubMed] [Google Scholar]
- 19.Gubareva LV, Kaiser L, Matrosovich MN, Soo-Hoo Y, Hayden FG. Selection of influenza virus mutants in experimentally infected volunteers treated with oseltamivir. J Infect Dis. 2001;183:523–31. doi: 10.1086/318537. [DOI] [PubMed] [Google Scholar]
- 20.Whitley RJ, Hayden FG, Reisinger KS, et al. Oral oseltamivir treatment of influenza in children. Pediatr Infect Dis J. 2001;20:127–33. doi: 10.1097/00006454-200102000-00002. [DOI] [PubMed] [Google Scholar]
- 21.Kiso M, Mitamura K, Sakai-Tagawa Y, et al. Resistant influenza A viruses in children treated with oseltamivir: Descriptive study. Lancet. 2004;364:759–65. doi: 10.1016/S0140-6736(04)16934-1. [DOI] [PubMed] [Google Scholar]
- 22.Ward P, Small I, Smith J, Suter P, Dutkowski R. Oseltamivir (Tamiflu(R)) and its potential for use in the event of an influenza pandemic. J Antimicrob Chemother. 2005;55(Suppl 1):i5–i21. doi: 10.1093/jac/dki018. [DOI] [PubMed] [Google Scholar]
- 23.Hurt AC, Holien JK, Parker M, Kelso A, Barr IG. Zanamivir-resistant influenza viruses with a novel neuraminidase mutation. J Virol. 2009;83:10366–73. doi: 10.1128/JVI.01200-09. [DOI] [PMC free article] [PubMed] [Google Scholar]
- 24.Fraser C, Donnelly CA, Cauchemez S, et al. WHO Rapid Pandemic Assessment Collaboration Pandemic potential of a strain of influenza A (H1N1): Early findings. Science. 2009;324:1557–61. doi: 10.1126/science.1176062. [DOI] [PMC free article] [PubMed] [Google Scholar]
- 25.Pourbohloul B, Ahued A, Davoudi B, et al. Initial human transmission dynamics of the pandemic (H1N1) 2009 virus in North America. Influenza Other Respi Viruses. 2009;3:215–22. doi: 10.1111/j.1750-2659.2009.00100.x. [DOI] [PMC free article] [PubMed] [Google Scholar]
- 26.McKay M, Conover W, Beckman R. A comparison of three methods for selecting values of input variables in the analysis of output from a computer code. Technometrics. 1979;21:239–45. [Google Scholar]
- 27.Lipsitch M, Cohen T, Murray M, Levin BR. Antiviral resistance and the control of pandemic influenza. PLoS Med. 2007;4:e15. doi: 10.1371/journal.pmed.0040015. [DOI] [PMC free article] [PubMed] [Google Scholar]
- 28.Wu JT, Leung GM, Lipsitch M, Cooper BS, Riley S. Hedging against antiviral resistance during the next influenza pandemic using small stockpiles of an alternative chemotherapy. PLoS Med. 2009;6:e1000085. doi: 10.1371/journal.pmed.1000085. [DOI] [PMC free article] [PubMed] [Google Scholar]
- 29.Handel A, Regoes RR, Antia R. The role of compensatory mutations in the emergence of drug resistance. PLoS Comput Biol. 2006;2:1262–70. doi: 10.1371/journal.pcbi.0020137. [DOI] [PMC free article] [PubMed] [Google Scholar]
- 30.van den Dool C, Hak E, Bonten MJM, Wallinga J. A model-based assessment of oseltamivir prophylaxis strategies to prevent influenza in nursing homes. Emerg Infect Dis. 2009;15:1547–55. doi: 10.3201/eid1510.081129. [DOI] [PMC free article] [PubMed] [Google Scholar]
- 31.Moghadas SM, Bowman CS, Rost G, Fisman DN, Wu J. Post-exposure prophylaxis during pandemic outbreaks. BMC Medicine. 2009;7:73. doi: 10.1186/1741-7015-7-73. [DOI] [PMC free article] [PubMed] [Google Scholar]
- 32.McCaw JM, Wood JG, McCaw CT, McVernon J. Impact of emerging antiviral drug resistance on influenza containment and spread: Influence of subclinical infection and strategic use of a stockpile containing one or two drugs. PLoS One. 2008;3:e2362. doi: 10.1371/journal.pone.0002362. [DOI] [PMC free article] [PubMed] [Google Scholar]
- 33.Simonsen L, Viboud C, Grenfell BT, et al. The genesis and spread of reassortment human influenza A/H3N2 viruses conferring adamantane resistance. Mol Biol Evol. 2007;24:1811–20. doi: 10.1093/molbev/msm103. [DOI] [PubMed] [Google Scholar]


