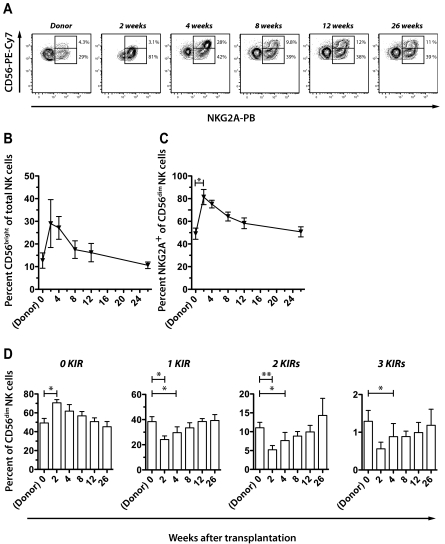
Figure 2.
Reconstitution of NK-cell repertoires during the first 6 months after T cell–replete HLA-identical sibling SCT. (A) Representative example of FACS staining and gating strategy to assess frequencies of CD56bright NK cells and expression of NKG2A in the donor and at multiple time points after SCT. Percentage of (B) CD56bright NK cells and (C) NKG2A+ CD56dim NK cells in the donor before SCT and in the recipient at the indicated time points after SCT. (D) Frequencies of CD56dim NK cells expressing 0 to 3 KIRs in the donor and at the indicated time points after SCT. Mean values of 7 donor-recipient pairs are depicted. All error bars represent SEM.

