Abstract
This work combines modeling and experiment to assess encapsulated microbubble oscillations associated with broadband pressure peaks detected after microbubble excitation (postexcitation signals). Data were acquired from albumin-shelled and phospholipid-shelled microbubbles using a passive cavitation detector consisting of a confocally aligned 2.8-MHz transmitter and 13-MHz receiver. Microbubbles in weak solutions were insonified with a 5-cycle pulse at a peak rarefactional pressure of 2.0±0.2 MPa. For each microbubble type, at least 100 received signals were identified as individual-microbubble responses. The average broadband noise from signals with postexcitation response was 4.2–7.2 dB higher than from signals without postexcitation. Pressure-time responses for each microbubble type were simulated using the model by Marmottant et al. [J. Acoust. Soc. Am. 118, 3499–3505 (2005)], with insonification conditions matching the experiment. Increased broadband noise predicted for microbubbles with postexcitation response was consistent with that observed experimentally (4.0–8.9 dB). The model predicted that postexcitation signals occur only when the radial oscillation exceeds both the shell break-up threshold and twice the initial radius (free bubble inertial cavitation threshold).
INTRODUCTION
Ultrasound contrast agents are microbubbles consisting of a gas core encapsulated in a shell that can be composed of lipids, albumin, or polymer. Commercially available agents typically contain polydisperse size distributions with a mean radius near the resonant size for diagnostic imaging (∼2–4 μm). Useful signal at diagnostic imaging frequencies is generally attributed to microbubbles greater than 1 μm in diameter.1
Novel therapeutic techniques have been put into place that take advantage of ultrasound’s unique interaction with contrast microbubbles. For example, removal of blood clots2 and acoustic activation of drug-laden microbubbles3, 4 have been demonstrated using high power destruction of microbubbles. Blood brain barrier disruption has been activated acoustically after injection of contrast agents by applying 10 ms, 260 kHz pulse trains with 0.29–0.57 MPa peak rarefactional pressure amplitude (PRPA).5 It is widely thought that the inertial cavitation of contrast microbubbles plays a major role in producing therapeutic effects. For example, ultrasound exposure (1–10 cycles at 1 MHz, 0.48–1.32 MPa) with Levovist microbubbles was found to increase sonoporation of DNA into cultured cells, and the effect increased as a function of increasing inertial cavitation dose.6 It has been shown that using high-intensity focused ultrasound exposures (1.8 MPa at 1.1 MHz), bubble-enhanced heating in biological media can be obtained.7 Measurements of the inertial cavitation and modeling of the microbubble response attributed the heating to absorption of broadband emissions produced by microbubble inertial cavitation.7
Inertial cavitation occurs when a microbubble’s collapse is dominated by the surrounding medium’s inertia.8 Passive cavitation detection (PCD) is widely applied in research to detect and obtain an indication of the level of inertial cavitation. Detection of inertial cavitation is sometimes based on features of the voltage-time signal such as increases in the rms or peak voltages.9 Many other PCD-based studies have applied criteria based on increased voltage levels or broadband power to characterize inertial cavitation thresholds.6, 10, 11 Although, the specific harmonic content of PCD-received signals and their modification when inertial cavitation occurs has remained largely unexplored, it has been demonstrated that subharmonic, second, and third harmonic peaks may also be modified near inertial cavitation thresholds.5, 12
An important feature of free bubble collapse has been exploited in lithotripsy to evaluate inertial cavitation thresholds. It has been demonstrated13 that when a shock wave arrives on a cavitation nuclei, a very rapid phase of compression is followed by a phase of much slower gas-body expansion. After reaching some maximum radial expansion, the bubble compresses again violently. This implosion can occur well after the original excitation wave has passed and gives rise to a broadband pressure peak (postexcitation signal).
The postexcitation signal from encapsulated contrast microbubbles has received little attention. Destruction of contrast agent microbubbles has previously been observed in vitro using high temporal and spatial resolution microscopy of bubble-wall movement during insonation. For example, using this approach, Chomas et al.14 observed destruction of lipid-shelled microbubbles at 5 MHz (1.5 cycle pulse). Violent fragmentation of bubbles was observed in more than 55% of the bubbles at an incident PRPA of 2.6 MPa. Optical observation showed that microbubble destruction created smaller free bubbles. Such bubbles could be nuclei for postexcitation inertial collapse. In other works, postexcitation signals can be seen in voltage-time responses from ruptured contrast microbubbles acquired with a PCD system, but no comment on these signals is made by the authors.15 In previous work, we utilized PCD to evaluate isolated Optison microbubbles.16 Postexcitation signals were observed in the voltage-time response when incident PRPA exceeded a threshold value. A link between postexcitation signals and encapsulated microbubble shell rupture was demonstrated using the model presented by Morgan et al.17 by setting the shell elasticity and viscosity terms to zero, once an Optison microbubble (equilibrium radius of 2 μm) exceeded 3 μm in radius. Once shell parameters were thus removed, the bubble radius underwent large oscillations (radial expansion to more than 5 μm) with repeated cycles of inertial collapse that continued even after the driving pulse ceased to act on the microbubble. Postexcitation signals were thus shown to occur for an encapsulated ultrasound contrast microbubbles when inertial cavitation was associated with microbubble break-up. Modeling in previous work, however, was limited to a unique example at an arbitrarily selected break-up radius and did not examine the dependence of postexcitation emission occurrence on the initial microbubble radius or on the extent of the microbubble oscillation. The broadband noise level specifically associated with the postexcitation response was not evaluated in the previous work, and only albumin-shelled Optison microbubbles were considered.
This work combines modeling and experiment to probe whether postexcitation signals predictably occur when encapsulated contrast agent microbubble shells break up, and to determine how much additional broadband noise is associated with microbubbles exhibiting postexcitation signals. Two lipid-shelled microbubbles are considered in addition to the albumin-shelled agent studied in previous work.
Pressure-time and spectral responses were modeled in this work using the model by Marmottant et al.,18 which specifically describes conditions for shell break-up and resulting surface tension modifications. This model applies even to large amplitude oscillations. Modeling was performed for Definity, Sonovue, and Optison microbubbles with a 2.8 MHz, 5-cycle incident pulse at 2.0 MPa PRPA. The incident pulse used in the model was measured with a hydrophone at the focal position of the transmit transducer to consider nonlinear propagation effects. For each radius-time simulation, radial expansion was related to the microbubble break-up radius, and to occurrence of postexcitation signals on the associated pressure-time simulation.
PCD signals from dilute solutions of Optison, Definity, and Sonovue microbubbles were acquired at a PRPA of 2.0±0.2 MPa (measure mean and uncertainty). At this PRPA, the majority of microbubbles should rupture.14 This provided PCD data with sufficient signal to noise ratio for detection of both microbubbles with postexcitation signals and weaker responses from microbubbles without postexcitation signals. Comparison of modeled spectra with the experimental spectra allowed interpretation of broadband noise increase with postexcitation signals in terms of the underlying microbubble response.
MATERIALS AND METHODS
Microbubbles
Three contrast agent microbubbles were used: Optison (Amersham Health, Milwaukee, WI), Sonovue (Bracco Diagnostics, Inc., Geneva, Switzerland), and Definity (Bristol-Myers Squibb Medical Imaging Inc., New York). Both Optison and Definity have an octofluoropropane C3F8 gas core, whereas Sonovue has a sulfurhexafluoride SF6 core. Optison’s shell is made of human serum albumin and N-acetyltryptophan caprylic acid. Sonovue and Definity have shells based on different phospholipids.19
Theoretical modeling of microbubble oscillation
The model proposed by Marmottant et al.18 to describe behavior of lipid coated microbubbles was used. It was derived to describe even large amplitude oscillations and specifically to describe surface tension modifications arising during expansion and at shell break-up. This model considers that the shell of the bubble buckles for bubble radii R<Rbuckling and initially breaks up for R>Rbreak-up. This model leads to the dynamic equation
| (1) |
where ρl is the density of the surrounding liquid, P0 is the ambient pressure, κ is the polytropic gas exponent, c is the speed of sound in the liquid, μ is the liquid viscosity, and κs is the shell surface viscosity. The acoustic pressure as a function of time t, Pac(t), was measured with a calibrated hydrophone in the configuration used in the PCD experiments described in Sec. 2C. This experimentally determined Pac(t) describes the incident pulse after it has undergone nonlinear propagation distortion in the transducer-to-microbubble water path. The surface tension σ(R) is modeled to vary as a function of the value of R as
| (2) |
where χ is the shell elastic compression modulus.
For large oscillations, the radius-dependent surface tension initially varies within an elastic regime until a critical break-up tension is reached at R=Rbreak-up. Although initial Rbreak-up can occur when σ(R) is greater than σwater due to shell cohesion, the surface tension relaxes to that of an uncoated microbubble after break-up and remains at this value for all R>Rrupture. The surface tension reversibly returns to the elastic regime during the compression phase when R<Rrupture and R≥Rbuckling, and returns to the uncoated microbubble surface tension value (σwater) during each subsequent expansion phase when R≥Rrupture. Rrupture is generally smaller than Rbreak-up, and is defined as the radius reached during each oscillation following initial break-up when σ(R) is equal to σwater.
The pressure radiated by the bubble at a distance r becomes20
| (3) |
The response P(t) from Eq. 3, was convolved with the impulse response of the received transducer, as measured with a calibrated hydrophone, to provide results comparable to experimental data.
It has been shown that albumin-shelled Optison microbubbles buckle, as described in the Marmottant model.21 Furthermore, it has been analytically determined that surface tension for a thin solid shell layer in the elastic regime varies as and assumed that R0 is approximately equal to Rbuckling.18 Therefore, Eqs. 1, 2, 3 were also applied to simulate pressure-time responses for Optison. However, Eqs. 1, 2, based on behavior of lipid-based shells, assume that shell fragments recombine across the microbubble surface after shell break-up each time the microbubble recontracts to R<Rrupture. When Optison’s albumin shell breaks, the remains are not likely to behave in the same manner as for a more flexible lipid-shelled agent.14 Therefore, surface tension conditions described in Eq. 2 were modified to permanently fix σ(R)=σwater and to suppress the shell viscosity term (κs=0), once R=Rbreak-up was reached for the first time, giving expressions for definitive shell break-up as
| (4) |
This modified equation, used to model the radius-time response for Optison microbubbles, thus considers the microbubble to be permanently uncoated following the initial shell break-up.
For Definity, a shell elastic compression modulus χ of 0.38 N∕m and a shell surface dilatational viscosity κs of 2.40×10⁻⁹ kg∕s were used.22 For Sonovue, values of 0.55 N∕m for χ and 7.20×10⁻⁹ kg∕s for κs were chosen according to Gorce et al.23 For Optison, values of 0.93 N∕m for χ and 7.65×10⁻⁸ kg∕s for κs were chosen, assuming a shell thickness of 15 nm, according to Chatterjee and Sarkar.24 The break-up radius Rbreak-up is related to the maximum surface tension limit of the microbubble . The value of Rbreak-up used herein (1.2R0) was selected to be within the range of values obtained by Marmottant et al.18 by fitting the shell parameters in their model to radius-time curves measured for BR14 (a lipid-shelled microbubble) response. Radius-time and pressure-time Pf(t) responses were simulated for microbubbles at a driving PRPA of 2.0 MPa (2.8 MHz, 5 cycles). Microbubble size-ranges were selected within accepted ranges1 that included radii without postexcitation signals on the modeled pressure-time responses: Definity 0.4–4.6 μm, Sonovue 0.6–5 μm, and Optison 1.8–5 μm. To estimate the spectral response for each microbubble radius, the Fourier transform of each pressure-time response Pf(t) was calculated. Average spectra were calculated from responses for different radii using weighting-factors describing a Gaussian size distribution within the selected ranges (mean±standard deviations of 2.5±0.8, 2.8±0.9, and 3.4±0.6 μm for Definity, Sonovue, and Optison, respectively) with a size-integration technique for simulation of contrast agent spectral density, as demonstrated by Zheng et al.25
Passive cavitation detector
Dilute solutions of ultrasound contrast agents were studied using a PCD with a 2.8-MHz transmitter and 13-MHz receiver (−6 dB bandwidth from 9.3 to 17.6 MHz). Use of the higher frequency receive transducer allows sensitive detection of broadband emissions. Details describing this system have been provided previously.16 Incident PRPA was characterized in a separate experiment using a calibrated PVDF bilaminar shielded membrane hydrophone (0.5-mm diameter, 699∕1/00001∕100, GEC Marconi Ltd., Great Baddow, UK) placed at the focal point. The dilution of the microbubbles was such that each signal received by the 13-MHz receiver should, on average, arise from a single microbubble within the confocal volume determined by the intersecting volumes of the two −6 dB beam widths. A total of n, independent, microbubble responses (n≥100) were acquired with an incident PRPA of 2.0±0.2 MPa. A 5-cycle transmit pulse was used throughout the study.
Data analysis
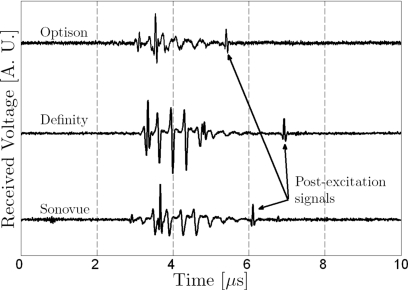
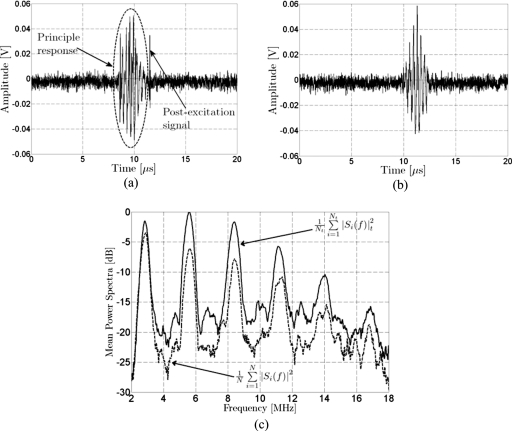
Postexcitation events were observed in some of the voltage-time signals acquired for each type of microbubble (Fig. 1). Microbubble responses were classified as (1) responses with a clear principal response but no postexcitation signal, (2) responses with a clear principal response followed by postexcitation signal, or (3) responses removed from further analysis that could not be classified in either groups (e.g., because there was no bubble response with a signal to noise ratio greater than 6 dB, there was unclear distinction of postexcitation signals, or there were possible multiple bubbles). The average spectral density was calculated for each group of Nt signals with postexcitation emissions. The average spectral density was also calculated for the corresponding group of N signals with no postexcitation emission. The group selection criteria and steps toward calculation of average parameters are illustrated schematically in Fig. 2. Broadband noise levels were compared between experimental and modeled spectra within the −6 dB receiving transducer’s bandwidth (9.3–17.6 MHz).
Figure 1.
Typical passive cavitation detection signals presenting postexcitation events for Optison, Definity, and Sonovue microbubbles (incident PRPA=2.0±0.2 MPa).
Figure 2.
Illustration of group selection criteria and average spectra. The signals shown were acquired with the passive cavitation detector from Definity insonified at an incident PRPA of 2.0±0.2 MPa (5 cycles, 2.8 MHz). (a) PCD signals presenting a postexcitation signal after the principle response. (b) PCD signal showing only the principle response; no postexcitation signal. (c) Average power spectral density for signals with postexcitation response (Nt=18) and signals without postexcitation response (N=17).
RESULTS
Postexcitation signals in modeled microbubble responses
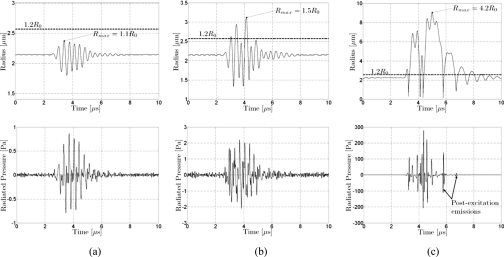
The microbubble responses simulated using Eqs. 1, 2, 3 for Definity at a fixed initial microbubble radius and break-up threshold, but with different incident pulse pressures, are presented in Fig. 3. This illustrates the response predicted by the model for the same microbubble under different conditions of radial oscillation. Shell parameters used are described in Sec. 2B. As described in Sec. 2B, incident pulses (2.8 MHz, 5 cycles) used in the simulation were those measured with a hydrophone, and the pressure-time response was filtered by the response of the receiver used in the PCD system. In Fig. 3a, the pressure-time curve does not show a postexcitation signal when the shell is not broken (incident PRPA 100 kPa, Rmax=1.1R0). In Fig. 3c, the pressure-time curve has a postexcitation signal when the microbubble responds very strongly after shell break-up (incident PRPA 2 MPa, Rmax=4.2R0). However, the pressure-time curve does not exhibit a postexcitation signal for the more modest oscillation shown in Fig. 3b, even though shell break-up occurs (incident PRPA 400 kPa, Rmax=1.5R0).
Figure 3.
Simulated radius-time and radiated pressure for a Definity microbubble at resonance radius (R0=2.14 μm) with a break-up radius Rbreak-up=1.2R0. Incident pulse at 2.8 MHz with 5 cycles. (a) Incident PRPA of 100 kPa. Radial expansion does not exceed the break-up radius Rmax=1.1R0. Radiated pressure does not exhibit a postexcitation signal. (b) Incident PRPA of 400 kPa. Radial expansion exceeds the break-up radius. Radiated pressure does not exhibit a postexcitation signal. (c) Incident PRPA of 2 MPa. Radial expansion exceeds the break-up radius Rmax=4.2R0. Postexcitation signals are observed.
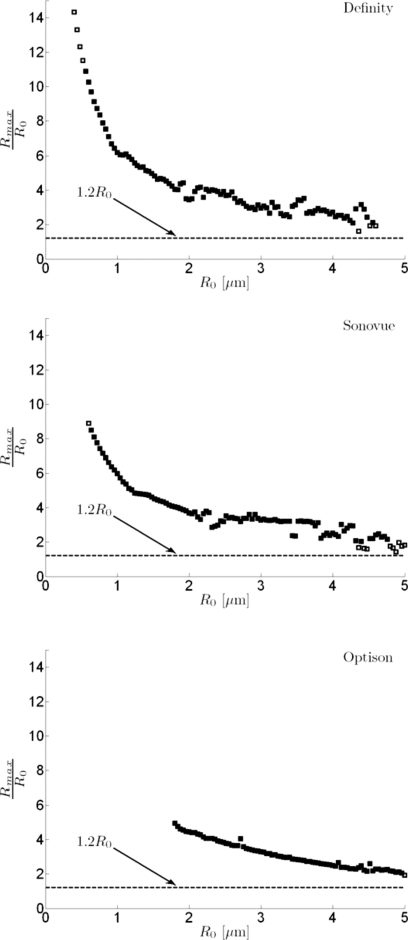
The postexcitation responses predicted with the model were considered as a function of the maximum microbubble expansion relative to the initial radius for a range of microbubble sizes and for all three types of microbubbles considered in this work (Rbreak-up=1.2R0). Results are summarized in Fig. 4. For all microbubble types, a few of the simulated pressure-time curves from larger microbubbles (4–5 μm in radius) with Rmax∕R0 just above the shell break-up threshold do not present postexcitation signals. When Rmax∕R0>2, however, postexcitation signals appear. Thus, the postexcitation signal appeared only when Rmax>Rbreak-up and Rmax>2R0. Some simulated radiated pressure signals for microbubbles <1 μm in radius did not yield detectable postexcitation signals, even though maximum expansion was much greater than 2R0.
Figure 4.
Postexcitation responses predicted with the model relative to maximum radial expansion Rmax and break-up radius (Rbreak-up=1.2R0). Radius-time and pressure-time responses were simulated for each microbubble type as a function of the initial microbubble radius R0 (ΔR0=20 nm) for a 2.8 MHz, 5-cycle incident pulse with PRPA of 2 MPa. The value of Rmax on each radius-time curve divided by the initial radius (Rmax∕R0) is plotted as a function of R0 for each microbubble type. Cases for which the associated pressure-time response exhibited a postexcitation signal are plotted as filled symbols, and cases with no postexcitation signal are plotted as open symbols. For display, every other data point is plotted (steps of 40 nm). Simulated responses for large microbubbles presenting Rmax∕R0 just above the shell break-up threshold, but below a value of two do not present postexcitation signals.
Comparison between modeled and experimental spectral responses
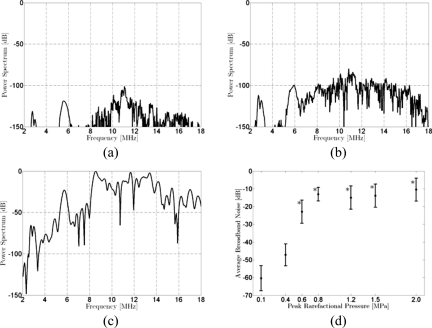
Simulated pressure-time responses were Fourier transformed to model the spectral response, as demonstrated in Fig. 5, using the pressure-time responses presented in Fig. 3 for Definity. The average broadband noise in the −6 dB bandwidth of the PCD receiver (9.3–17.6 MHz) is plotted as a function of incident pressure in Fig. 5d. The broadband noise increases with incident pressure and presents the highest level when postexcitation signals are present, as anticipated.
Figure 5.
Simulated spectral responses for a Definity microbubble at resonance radius (R0=2.14 μm) with a break-up radius Rbreak-up=1.2R0. Incident pulse at 2.8 MHz with 5 cycles. All spectra are presented with spectral amplitude relative to the peak value of the spectrum calculated for the response to the incident 2 MPa PRPA pulse. Incident PRPA: (a) 100 kPa, (b) 400 kPa, and (c) 2 MPa. (d) The average broadband noise (9.3–17.6 MHz) as a function of peak rarefactional pressure in the incident pulse. Error bars represent the standard deviation in the bandwidth. Stars indicate at which PRPA levels postexcitation emissions were identified on the simulated pressure-time curves.
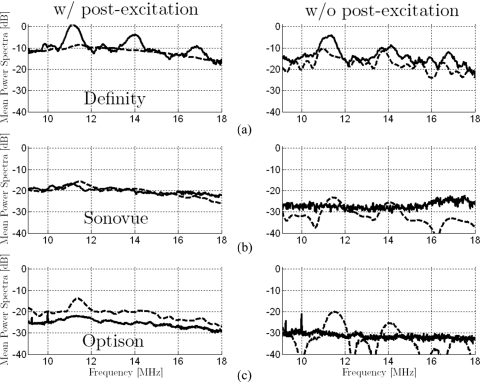
Simulated and experimental power spectra are compared between groups of signals presenting postexcitation response and groups without postexcitation response for Sonovue, Definity, and Optison in Fig. 6. Comparisons between simulated and experimental spectra are presented within the −6 dB bandwidth of the PCD’s receiving transducer. Modeled spectra for Sonovue and Optison without postexcitation response have sharp features. This is probably due to the small number microbubbles in the size-range selected for simulations that responded in this category. Average broadband power increases for the spectra with postexcitation signals, as compared to those from signals without postexcitation signals, are summarized in Table 1 for both simulated and experimental data. Relative differences in spectral amplitude in the simulated spectra correspond well to those observed experimentally (highest difference for Definity, and lowest for Optison). The increase in broadband noise between the average spectrum from microbubbles with postexcitation signals and that from same microbubbles without postexcitation signals is on the same order for predicted and experimentally measured spectra.
Figure 6.
Comparison of average spectra from signals with and without postexcitation response for simulated (dashed lines) and experimental (solid lines) results for (a) Definity, (b) Sonovue, and (c) Optison (incident peak rarefactional pressure amplitude of 2.0 MPa). All experimentally estimated spectra are presented on the same scale relative (re: 0 dB) to the peak value for Definity with postexcitation signals. The scaling factor that provided best alignment between simulated and experimental curves for Definity with postexcitation signals was calculated. This uniform off-set was applied to all simulated spectra. Highest broadband noise levels are observed for Definity and lowest levels for Optison. For each microbubble type, the average spectrum is higher for the case with postexcitation response than for the case without postexcitation response. Overall, the amplitudes of the simulated spectra vary consistently with the amplitudes of the experimentally assessed spectra (similar differences between microbubble types and between cases with and without postexcitation signals).
Table 1.
Average difference between the mean power spectrum from signals with postexcitation response and the mean power spectrum from signals without postexcitation response are summarized for spectra from experimental data and for spectra calculated from simulated pressure-time responses. Spectral differences are calculated within a bandwidth from 9.3 to 17.6 MHz.
| Average broadband power increase (9.3–17.6 MHz) associated with postexcitation signals (dB) | ||
|---|---|---|
| Experimental data | Simulated data | |
| Definity | 4.2 | 4.0 |
| Sonovue | 7.2 | 6.7 |
| Optison | 6.1 | 8.9 |
DISCUSSION
This work further explores the link between postexcitation signals and microbubble break-up. Working at relatively high PRPA (2.0 MPa) for which the majority of microbubbles can be anticipated to break up, we were able to experimentally detect signals with and without postexcitation signals. This was shown experimentally, not only for albumin-shelled Optison microbubbles, but also for phospholipid-shelled Definity and Sonovue microbubbles.
To predict microbubble response under the experimental conditions considered in this work, we used the model by Marmottant et al.18 that specifically describes variations of microbubble surface tension for lipid-shelled microbubbles as the shell expands and contracts. For application to albumin-shelled Optison, the model was modified to permanently suppress the shell viscosity and to set the surface tension term equal to that of water, once the break-up radius was reached. This suppression of shell elasticity and viscosity at a critical radius is similar to the approach previously applied to model shell break-up of a 2 μm Optison microbubble using the modified Herring equation.16 Modeling of the pressure-time response for Optison, Sonovue, and Definity microbubbles across typical ranges of radii demonstrated that postexcitation signals occurred only when radial oscillation exceeded both the break-up threshold and Rmax>2R0. Modeled responses for microbubbles with oscillations not exceeding the break-up threshold or exceeding the break-up threshold without expanding larger than 2R0 did not yield postexcitation signals. Rbreak-up was chosen to have a value consistent with those previously found by fitting the model to experimentally recorded radius-time responses measured for a lipid-shelled agent. Varying Rbreak-up from 1.2 to 1.5 for Definity microbubbles consistently led to postexcitation signal appearance for Rmax>2R0. Flynn and co-worker8, 26 established a radial oscillation threshold of R>2R0 for inertial cavitation of free bubbles. Thus, the model predicts that postexcitation signals occur for microbubbles in a range of sizes that respond, following break-up with radial oscillation exceeding the free bubble inertial cavitation threshold. However, a range of responses without postexcitation signals from microbubbles exceeding the break-up radius but remaining less than the free bubble inertial cavitation threshold was predicted for each microbubble type considered. The simulated radiated pressure signals become very weak for the smallest microbubbles considered in simulations. Although some of these small microbubbles responded with maximum expansion greater than 2R0, no postexcitation signals were detected. Postexcitation signals might be hidden by surrounding noise, but it could also be due to limitations of the model.
Pressure-time response calculated using the model by Marmottant et al.18 provides a good description of experimentally observed postexcitation signals when the shell breaks up and when radial expansion exceeds 2R0. This is the first time that this model feature has been demonstrated. A free bubble model should also produce postexcitation signals when radial oscillation is sufficient, but will lack terms considering the shell effects prior to initial break-up and (for lipid-shelled bubbles) during subsequent periods of recompression when R<Rruptured. Postexcitation signals can also be obtained with the Marmottant model for non-lipid shelled agents, but only after modifying the shell parameters to eliminate shell viscosity and surface tension for all time after Rbreak-up is initially reached.
Although the PRPA used in this study is within the range used in diagnostic imaging (mechanical index on the order of 1.2), such high pressures are not typically used in ultrasound contrast imaging, except when clearing microbubbles from the image plane for perfusion imaging. This high pressure was selected because it provided sufficient signal to noise ratio, not only for experimental detection of PCD responses with postexcitation response, but also for detection of weaker responses without postexcitation signals.
The response of the microbubbles with postexcitation signals relative to that of microbubbles without postexcitation signals demonstrated broadband noise increases of approximately 4–7 dB (experiment) and 4–9 dB (modeled spectra). Data were analyzed to investigate how much of this noise can be attributed to the response of the postexcitation signal. By excluding the postexcitation signals from the experimentally acquired voltage-time trace used for the Fourier transform, we estimated the spectral content, minus the contribution due to postexcitation signals, and compared this to the spectral content of the entire voltage-time traces. The postexcitation signals contributed averages of 0.2±0.1, 0.8±0.2, and 0.5±0.2 dB of the broadband noise level observed for Definity, Sonovue, and Optison, respectively. This leads to the conclusion that the increase in broadband noise observed when postexcitation signals are detected is primarily due to increased pressure radiated during the principal response. These weak postexcitation signals on the pressure-time response are likely to be difficult to detect in vivo and can only be observed in the time domain when a single microbubble response is isolated. However, the spectral content associated with the inertial cavitation response may offer insight that is useful for in vivo studies. To estimate the onset of inertial cavitation in PCD measurements, increased broadband noise from insonified contrast microbubbles is generally compared to baseline levels observed in the absence of contrast agent. For example, Sassaroli and Hynynen10 used an increase of at least 20 dB above background in the wideband noise to characterize Optison inertial cavitation. Tu et al.11 found relative increases in normalized inertial cavitation doses from 10 to 20 dB between solutions with and without Optison. The increases in broadband noise associated with inertial cavitation, as reported in the current work, are lower (on the order of 4–7 dB) because comparison is not being made between the response from a group of microbubbles and noise baseline, but is instead being made between two groups of microbubbles under the same insonification conditions, but responding differently. The model predicts that the group with postexcitation signals oscillates above the inertial cavitation threshold and that the group without postexcitation signals predominantly oscillates below this threshold. For a well characterized microbubble population, it could be possible to apply the model to predict which microbubbles in the population will respond with inertial cavitation, and how modification of the insonification conditions can be used to adjust the inertial cavitation response.
An important limitation of this study is that the PCD configuration used does not provide information about the precise initial bubble size for a given voltage-time trace. The size distribution of microbubbles in dilutions may be modified compared to the pre-dilution distribution.27 Furthermore, the size distribution in solution is time-dependent. Postexcitation signal prediction with the Marmottant model was explored across approximate size distributions to investigate the link with radial oscillation and shell break-up. The ranges considered were selected to be coherent with reported ranges and to include microbubble sizes near the shell break-up threshold at which simulated pressure-time curves did not present postexcitation signals.
However, in spite of the approximate nature of the microbubble size distributions used for modeling, the relative amplitude of the broadband noise predicted by the model between different types of microbubbles was consistent with experimental observations. Relative differences predicted between groups of microbubbles with and without postexcitation responses were also of the same order for the model and the experiment. Better comparisons between experimental and simulated spectra could be obtained if the microbubble size in the experimentally sampled population were known.
Results using the model by Marmottant et al.18 have been presented to explore the relationship between postexcitation signal, microbubble size, break-up, inertial cavitation, and broadband noise levels. Modeled signals only presented postexcitation signals when both the break-up radius and the inertial cavitation threshold were exceeded. Comparable levels of added broadband noise in experimental and simulated data when postexcitation signals were present suggest that the Marmottant model can provide insight concerning spectral response for cavitating microbubbles.
ACKNOWLEDGMENTS
This work was supported by the cooperative project for biomedical engineering between the University of Illinois at Urbana-Champaign and the Centre National de la Recherche Scientifique, France. The authors acknowledge financial support from Agence Nationale de la Recherche under Grant No. ANR-05-BLAN-0236 of project ACUVA and from the U.S. National Institutes of Health under Grant No. R37EB02641.
References
- Bouakaz A. and de Jong N., “WFUMB safety symposium on echo-contrast agents: Nature and types of ultrasound contrast agents,” Ultrasound Med. Biol. 33, 187–196 (2007). 10.1016/j.ultrasmedbio.2006.07.008 [DOI] [PubMed] [Google Scholar]
- Takeuchi H., Ogunyankin K., Pandian N. G., McCreery T. P., Sweitzer R. H., Caldwell V. E., Unger E. C., Avelar E., Sheahan M., and Connolly R., “Enhanced visualization of intravascular and left atrial appendage thrombus with the use of a thrombus-targeting ultrasonographic contrast agent (MRX-408A1): In vivo experimental echocardiographic studies,” J. Am. Soc. Echocardiogr. 12, 1015–1021 (1999). 10.1016/S0894-7317(99)70096-9 [DOI] [PubMed] [Google Scholar]
- Klibanov A. L., “Microbubble contrast agents—Targeted ultrasound imaging and ultrasound-assisted drug-delivery applications,” Invest. Radiol. 41, 354–362 (2006). 10.1097/01.rli.0000199292.88189.0f [DOI] [PubMed] [Google Scholar]
- Kheirolomoom A., Dayton P. A., Lum A. F. H., Little E., Paoli E. E., Zheng H. R., and Ferrara K. W., “Acoustically-active microbubbles conjugated to liposomes: Characterization of a proposed drug delivery vehicle,” J. Controlled Release 118, 275–284 (2007). 10.1016/j.jconrel.2006.12.015 [DOI] [PMC free article] [PubMed] [Google Scholar]
- McDannold N., Vykhodtseva N., and Hynynen K., “Targeted disruption of the blood-brain barrier with focused ultrasound: Association with cavitation activity,” Phys. Med. Biol. 51, 793–807 (2006). 10.1088/0031-9155/51/4/003 [DOI] [PubMed] [Google Scholar]
- Lai C. -Y. Wu C. -H., Chen C. -C., and Li P. -C., “Quantitative relations of acoustic inertial cavitation with sonoporation and cell viability,” Ultrasound Med. Biol. 32, 1931–1941 (2006). 10.1016/j.ultrasmedbio.2006.06.020 [DOI] [PubMed] [Google Scholar]
- Coussios C. C., Farny C. H., Ter Haar G., and Roy R. A., “Role of acoustic cavitation in the delivery and monitoring of cancer treatment by high-intensity focused ultrasound (HIFU),” Int. J. Hyperthermia 23, 105–120 (2007). 10.1080/02656730701194131 [DOI] [PubMed] [Google Scholar]
- Flynn H. G., “Cavitation dynamics. II. Free pulsations and models for cavitation bubbles,” J. Acoust. Soc. Am. 58, 1160–1170 (1975). 10.1121/1.380799 [DOI] [Google Scholar]
- Rota C., Raeman C. H., Child S. Z., and Dalecki D., “Detection of acoustic cavitation in the heart with microbubble contrast agents in vivo: A mechanism for ultrasound-induced arrhythmias,” J. Acoust. Soc. Am. 120, 2958–2964 (2006). 10.1121/1.2346132 [DOI] [PubMed] [Google Scholar]
- Sassaroli E. and Hynynen K., “Cavitation threshold of microbubbles in gel tubes by focused ultrasound,” Ultrasound Med. Biol. 33, 1651–1660 (2007). 10.1016/j.ultrasmedbio.2007.04.018 [DOI] [PMC free article] [PubMed] [Google Scholar]
- Tu J., Hwang J. H., Matula T. J., Brayman A. A., and Crum L. A., “Intravascular inertial cavitation activity detection and quantification in vivo with Optison,” Ultrasound Med. Biol. 32, 1601–1609 (2006). 10.1016/j.ultrasmedbio.2006.07.015 [DOI] [PubMed] [Google Scholar]
- Biagi E., Breschi L., Vannacci E., and Masotti L., “Stable and transient subharmonic emissions from isolated contrast agent microbubbles,” IEEE Trans. Ultrason. Ferroelectr. Freq. Control 54, 480–497 (2007). 10.1109/TUFFC.2007.272 [DOI] [PubMed] [Google Scholar]
- Church C. C., “A theoretical-study of cavitation generated by an extracorporeal shock-wave lithotripter,” J. Acoust. Soc. Am. 86, 215–227 (1989). 10.1121/1.398328 [DOI] [PubMed] [Google Scholar]
- Chomas J. E., Dayton P., Morgan K., Allen J., and Ferrara K. W., “Mechanisms of contrast agent destruction,” IEEE Trans. Ultrason. Ferroelectr. Freq. Control 48, 232–248 (2001). 10.1109/58.896136 [DOI] [PubMed] [Google Scholar]
- Chen W. S., Matula T. J., and Crum L. A., “Ultrasound contrast agent behaviour near the fragmentation threshold,” Proceedings of the IEEE Ultrasonic Symposium (2000), p. 1935.
- Ammi A., Cleveland R. O., Mamou J., Wang G., Bridal S. L., and W. D.O’Brien, Jr., “Ultrasonic contrast agent shell rupture detected by inertial cavitation and rebound signals,” IEEE Trans. Ultrason. Ferroelectr. Freq. Control 53, 126–136 (2006). 10.1109/TUFFC.2006.1588398 [DOI] [PMC free article] [PubMed] [Google Scholar]
- Morgan K. E., Allen J. S., Dayton P. A., Chomas J. E., Klibanov A. L., and Ferrara K. W., “Experimental and theoretical evaluation of microbubble behaviour: Effect of transmitted phase and bubble size,” IEEE Trans. Ultrason. Ferroelectr. Freq. Control 47, 1494–1509 (2000). 10.1109/58.883539 [DOI] [PubMed] [Google Scholar]
- Marmottant P., Van der Meer S., Emmer M., Versluis M., de Jong N., Hilgenfeldt S., and Lohse D., “A model for large amplitude of coated bubbles accounting for buckling and rupture,” J. Acoust. Soc. Am. 118, 3499–3505 (2005). 10.1121/1.2109427 [DOI] [Google Scholar]
- Miller A. P. and Nanda N. C., “Contrast echocardiography: New agents,” Ultrasound Med. Biol. 30, 425–434 (2004). 10.1016/j.ultrasmedbio.2003.12.002 [DOI] [PubMed] [Google Scholar]
- Leighton T. G., The Acoustic Bubble (Academic, London, 1994). [Google Scholar]
- Dayton P. A., Morgan K. E., Klibanov A. L., Brandenburger G. H., and Ferrara K. W., “Optical and acoustical observations of the effects of ultrasound on contrast agents,” IEEE Trans. Ultrason. Ferroelectr. Freq. Control 46, 220–232 (1999). 10.1109/58.741536 [DOI] [PubMed] [Google Scholar]
- Kimmel E., Krasovitski B., Hoogi A., Razansky D., and Adam D., “Subharmonic response of encapsulated microbubbles: Conditions for existence and amplification,” Ultrasound Med. Biol. 33, 1767–1776 (2007). 10.1016/j.ultrasmedbio.2007.05.011 [DOI] [PubMed] [Google Scholar]
- Gorce J. M., Arditi M., and Schneider M., “Influence of bubble size distribution on the echogenicity of ultrasound contrast agents: A study of Sonovue,” Invest. Radiol. 35, 661–671 (2000). 10.1097/00004424-200011000-00003 [DOI] [PubMed] [Google Scholar]
- Chatterjee D. and Sarkar K., “A Newtonian rheological model for the interface of microbubble contrast agents,” Ultrasound Med. Biol. 29, 1749–1757 (2003). 10.1016/S0301-5629(03)01051-2 [DOI] [PubMed] [Google Scholar]
- Zheng H. R., Barker A., and Shandas R., “Predicting backscatter characteristics from micron- and submicron-scale ultrasound contrast agents using a size-integration technique,” IEEE Trans. Ultrason. Ferroelectr. Freq. Control 53, 639–644 (2006). 10.1109/TUFFC.2006.1610573 [DOI] [PubMed] [Google Scholar]
- Flynn H. G. and Church C. C., “Transient pulsations of small gas bubbles in water,” J. Acoust. Soc. Am. 84, 985–998 (1988). 10.1121/1.388622 [DOI] [PubMed] [Google Scholar]
- Goertz D., de Jong N., and Van der Steen A. F. W., “Attenuation and size distribution measurements of Definity and manipulated Definity populations,” Ultrasound Med. Biol. 33, 1376–1388 (2007). 10.1016/j.ultrasmedbio.2007.03.009 [DOI] [PubMed] [Google Scholar]


