Abstract
The false vocal folds are believed to be components of the acoustic filter that is responsible for shaping the voice. However, the effects of false vocal folds on the vocal fold vibration and the glottal aerodynamic during phonation remain unclear. This effect has implications for computational modeling of phonation as well as for understanding laryngeal pathologies such as glottal incompetence resulting from unilateral vocal fold paralysis. In this study, a high fidelity, two-dimensional computational model, which combines an immersed boundary method for the airflow and a continuum, finite-element method for the vocal folds, is used to examine the effect of the false vocal folds on flow-induced vibration (FIV) of the true vocal folds and the dynamics of the glottal jet. The model is notionally based on a laryngeal CT scan and employs realistic flow conditions and tissue properties. Results show that the false vocal folds potentially have a significant impact on phonation. The false vocal folds reduce the glottal flow impedance and increase the amplitude as well as the mean glottal jet velocity. The false vocal folds also enhance the intensity of the monopole acoustic sources in the glottis. A mechanism for reduction in flow impedance due to the false vocal folds is proposed.
Keywords: False Vocal Fold, Phonation, Coanda effects, Immersed Boundary Method
INTRODUCTION
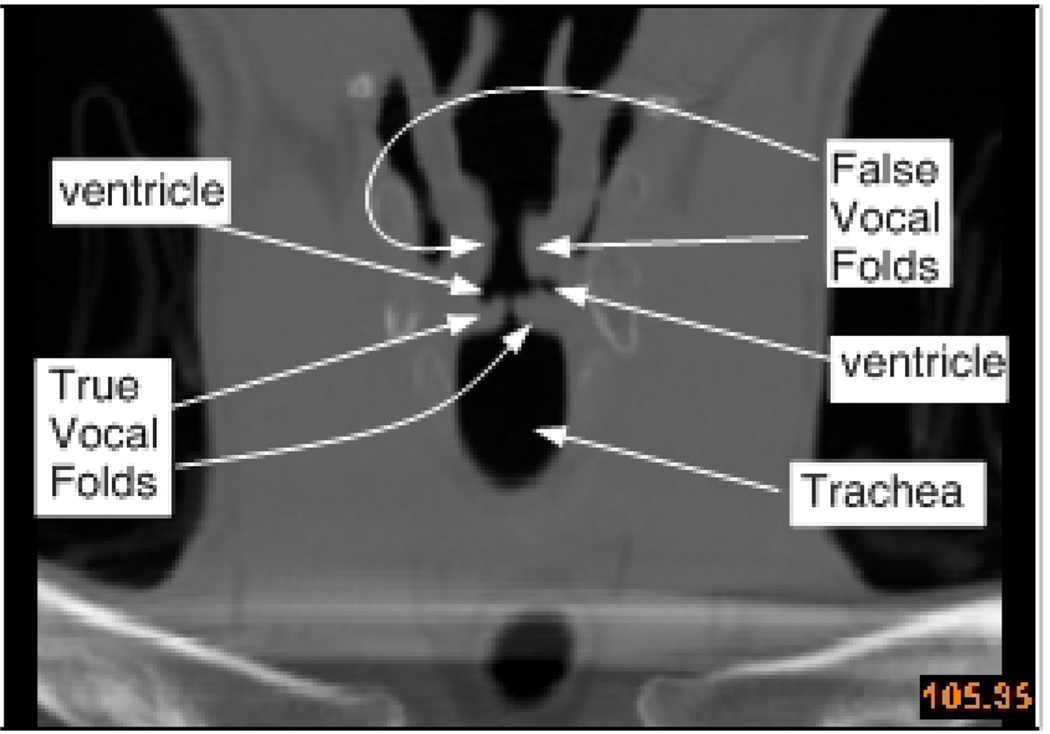
False vocal folds, also called ventricular (or vestibular) folds are a pair of thick folds of mucous membrane that are located in the supra-glottal space in the larynx (see Figure 1). These false vocal folds are separated from the true vocal folds (TVF) by the ventricular space and are not directly connected to the true vocal folds. Interference of the false vocal folds during phonation is implicated in ventricular dysphonia and this may be a result of pathologies (paralysis, tumors) or surgical intervention (such as hemilaryngectomy22,28,32,45). Ventricular dysphonia can sometimes be compensatory as a substitute voice in case of true-vocal fold inadequacy28. For instance, in patients with unilateral true vocal fold paralysis, the contralateral false vocal fold may be adducted torecover phonatory function of the larynx. The false vocal folds are also known to play an active role in some types of throat singing35.
Figure 1.
Coronal view of the CT scan of a normal human larynx showing key features along the approximate anterior posterior midline of the glottis.
The role of false vocal folds during normal phonation is however not well understood although a number of studies in the past have indeed examined this issue with various modeling and experimental approaches. One of the first modeling studies published on this topic was that of Zhang et al.48 who used a computational approach to study the flow and sound production in a modeled larynx. The key features of the model were that it was two-dimensional, assumed flow symmetry about the medial line and the vocal fold had a prescribed motion (i.e. no fluid-structure coupling). They found that the presence of the false-vocal folds reduced the flow resistance and also introduced additional dipole sources of sound.
Agarwal et al.1 used an experimental setup to examine the effect of false-vocalfolds on translaryngeal flow resistance. Translaryengeal flow resistance ( ZL) is defined as
| (1) |
where ΔPL is the mean pressure drop across the glottis and Q¯ is the associated mean flow rate through the glottis. The key features of their experimental model were that the geometry was axisymmetric, the true vocal folds were assumed to be stationary (although different TVF geometries were examined) and the FVF gap was varied. The key finding of this study was that for a ratio of false to true vocal fold gap width of about 2.0., the translaryngeal flow resistance was found to reach a minimum which was 20–25% lower than the resistance in the absence of the false vocal folds.
Triep et al.44 have recently performed a particle-image velocimetry (PIV) study of a scaled up laryengeal model and have also looked at the effect of FVF on the glottal flow. The glottal gap in this study was designed to be realistic but the vocal folds were moved according to a prescribed motion. Their primary finding was that the glottal jet tended to attach randomly to one FVF or the other from cycle to cycle.
Alipour et al.4 have recently carried out a detailed study of the effect of the epiglottis and FVF during phonation. Their study employs an excised canine larynx which was suitably modified to examine various effects including variation in adduction, pressure and flow rate. Their primary conclusion was that removal of FVF resulted in decreased translaryngeal flow resistance and a decrease in the sound intensity level. Thus it would seem that their result regarding translaryngeal resistance contradicts past studies (Zhang et al.48, Agarwal et al.1) that suggest that the presence of the FVF can decrease flow resistance. Furthermore, it is also expected that a decrease(increase) in flow resistance for a given pressure would lead to increase(decrease) in the sound pressure level. However it should be noted that Alipour et al.4 based their conclusion on differential flow resistance which is the rate at which the required mean pressure across the larynx changes with flow rate. Thus, their flow resistance was defined as . In fact, a closer look at their results (see Table 2 and Fig. 3 and Fig. 5 of their paper) indicates that for many cases, especially those with flow rates less than about 600 ml / s, the flow resistance as defined in Eq. (1) is actually lower with the FVFs than without.
Table 2.
Summary of key computed quantities for cases with and without false vocal folds.
|
F0 (Hz) |
Amplitude of GTVF (cm) |
Mean value of GTVF (cm) |
Peak Value of flow rate Q(m2/s) |
Q̄(m2 / s) | Flow Impedanc e |
||
|---|---|---|---|---|---|---|---|
| (−)FVF | 227 | 0.0929 | 0.0481 | 0.02937 (587 ml/s) |
0.01338 (266 ml/s) |
74756 | |
| (+)FVF | 232 | 0.1238 | 0.0547 | 0.04328 (865 ml/s) |
0.01619 (322 ml/s) |
61767 | |
|
|
+2.2% | +33% | +13.7% | +47.4% | +21% | −17% |
Figure 3.
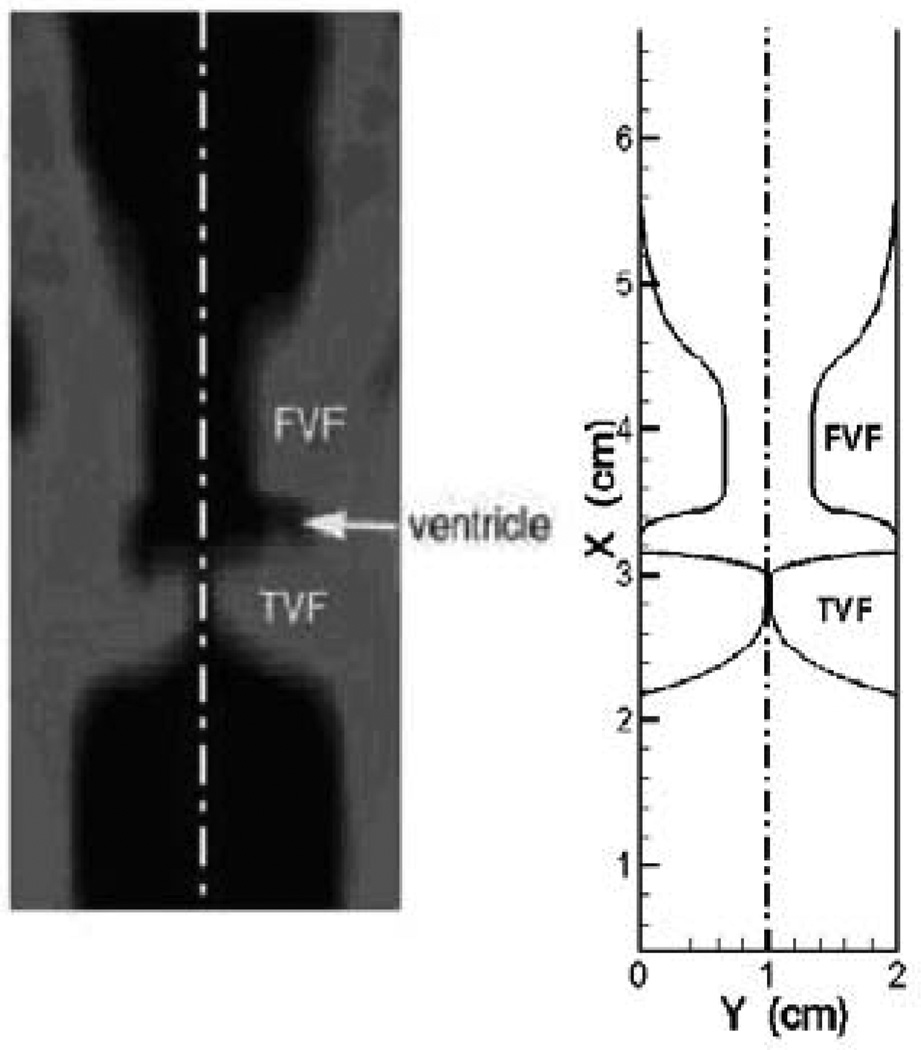
A close-up coronal view of the CT at the anterior-posterior midline of the glottis and the current geometric model that attempts to match the key geometrical features in the CT scan.
Figure 5.
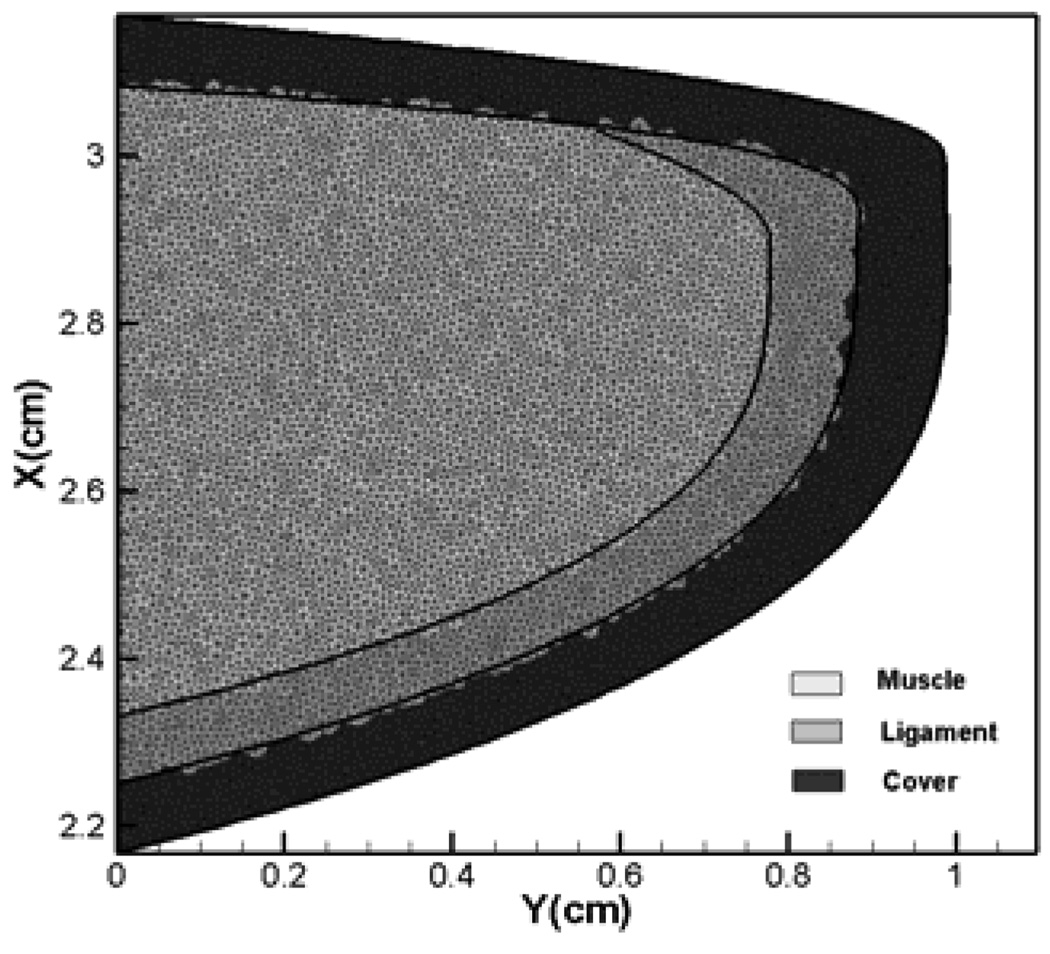
Three layer vocal fold inner structure and triangular elements used in the current solver.
Thus, although there is some indication that FVF might play a positive role in phonation, the issue is not fully settled. Furthermore, what is still lacking is a clear connection between the effect of FVFs and the associated glottal aerodynamics. Thus, the question as to what effect the FVFs have on the glottal jet that subsequently results in lowered translaryngeal resistance remains to be answered. Finally, the effect that FVF have on the flow induced vibration of the true-vocal folds have not been addressed in any of the past studied except for that of Alipour et al.4 An understanding of this role is important for a number of reasons. First, a better understanding of FVF function would provide clinicians with useful insights on surgical interventions or other pathologies associated with the false vocal folds25. Second, an understanding of FVF function in phonation can lead to improvements in biomechanical models of the human larynx. Such models are being used to understand the biophysics of phonation2, 17 and are also being considered for potential use in surgery planning and prediction24. Whereas some of the past studies have employed laryngeal models with false vocal folds34, the majority of the models do not include these structures and it is not clear to what extent, the exclusion of FVFs modifies the vocal fold and glottal jet dynamics.
In the current study, we use a recently developed computational approach to examine the role of false vocal folds on the vibratory characteristics of the true vocal folds and the aerodynamics of the glottal jet. The computational model couples a high-fidelity, two-dimensional, Navier-Stokes flow solver with a continuum theory based finite-element method (FEM) for the true vocal folds. A simplified geometric model of the larynx based notionally on the laryngeal CT scan of a volunteer with a normal (non-diseased)larynx is used. A comparative analysis of two laryngeal models; one with FVF and one without is used to examine the effect of FVF on the vibratory characteristics of the true vocal folds, the time-varying properties of the airflow through the glottis, as well as the sources of sound production in the larynx. Some key features differentiate the current study from past modeling efforts. In contrast to Zhang et al.48, and Triep et al.44, who prescribed the TVF motion, and Agarwal et al.1, who employed a static TVF model, we employ a fully coupled model for the TVF and this allows for the FVF effect on the translaryengeal resistance to feedback on to the TVF vibrations. Second, unlike Zhang et al.48, we do not assume symmetry about the medial line and this allows the glottal jet to develop asymmetric modes which was known to be characteristic of this flow10.Furthermore, unlike the experimental study of Alipour et al.4, which employs an excised canine larynx, our laryngeal model is highly simplified (and similar to Zhang et al.48 and Agarwal et al.1 in that respect). Finally, while Alipour et al.4 have examined a large variation in the available parameter space, we limit ourselves to a detailed analysis of two configurations (one with and one without FVFs) at one operational condition. Thus, our study can be considered complimentary in many respects to these past studies.
Following the approach taken in the vast majority of past studies9,11,15,16,17,18,19,20,22,24,31,40,42,48,49,50,41, we have employed a two-dimensional (2D) model of the larynx. 2D models are easier to compute and their accuracy is easier to verify using grid refinement studies. In contrast, 3D models are significantly more expensive (by one or two orders of magnitude) and it is very difficult to verify the numerical accuracy of these models. In fact, to our knowledge, none of the 3D modeling studies published to date has shown verifiable numerical accuracy34. The use of a two-dimensional laryngeal model however has some implications for the computed dynamics of the airflow and the vocal folds. For instance, 2D flow models preclude turbulence in the glottal jet. Similarly, the two-dimensional vocal fold model precludes longitudinal deformation modes. The extent to which the exclusion of these aspects modifies the relevant physics cannot be assessed directly without performing a study with a three-dimensional model. However, by comparing the computed results with a number of experimental studies, we make a case that the current 2D model does indeed provide valid and useful insights into the phonatory role of false-vocal folds.
METHODS
Biomechanics of Phonation
Phonation is essentially a result of flow-induced vibration of true vocal folds (TVF). Fig. 3(a) shows a coronal (front-to-back) view of larynx obtained from a CT scan. The image clearly shows the two vocal folds that protrude into the airway inside the larynx. During phonation, the two TVFs are brought together at the midline and tightened so as to obstruct the passage of air from the lungs to the vocal tract above. Air is then forced through the glottis due to buildup of pressure inside the lungs and this results in a sustained flow-induced vibration of the TVFs during which air is expelled into the vocal-tract as the "glottal jet". This sustained vibration and the resulting airflow give rise to the generation and propagation of sound, and this process is called phonation. When attention is focused on the TVF vibration and bulk flow motion, air compressibility is often neglected and an incompressible flow can be assumed. The vocal-fold itself has a complex structure with three distinct layers (muscle, ligament and cover) and the various constituents of the TVFs are known to play distinct roles in the vibratory dynamics
In the past, a number of mathematical models of different complexity have been developed for describing the fluid-structure interaction (FSI) process of phonation. The first study that attempted to examine phonation physics using a fully coupled FSI approach was that of Ishizaka and Flanagan17. In this study, the TVFs were modeled as two lumped masses and the air was treated as a one-dimensional inviscid flow. The model was extremely simple but was one of the first to successfully demonstrate sustained flow-induced vibrations. Since this first study, lumped-mass models with more degrees of freedom have also been proposed and employed43. Low-order models have been used with varying degrees of success to study some specific features of phonation. For example, the chaotic behavior in VF vibration was examined by Jiang et al.20 using a two-mass model.
Continuum models of the vocal folds have been employed in recent years. A two-/three-dimensional hybrid FEM model of the TVFs was introduced by Alipour et al.2, where the VF tissues were assumed to have three layers and each layer was transversely isotropic and governed by linear viscoelasticity. Rosa et al.34 presented a fully 3D model in which dynamics of the three-layer and transversely isotropic TVFs was coupled with an incompressible flow solver to simulate the FSI in the larynx. They also included the contact force during TVF closure as well as false vocal folds and laryngeal ventricles in their simulation to better approximate the physical geometry.
All of these studies indicate that modeling the air flow with the Navier-Stokes equations and the vocal folds using continuum based methods provides the highest level of modeling fidelity and this is the approach employed in the current study. The following sections describe the methodology used for modeling the laryngeal airflow and the flow-induced vibrations of the true vocal folds as well as the geometrical setup of the laryngeal models.
Glottal Aerodynamics Model
The simulations employ a sharp-interface immersed boundary method26 that has been described in detail in Mittal et al.27. Here we describe some of the salient features of the methodology. The equations governing this flow are the unsteady, viscous incompressible Navier-Stokes equations:
| (2) |
| (3) |
where vi are velocity components, p is pressure, and ρ and ν are flow density and kinematic viscosity.
These equations are discretized using a cell-centered, collocated (non-staggered) arrangement of the primitive variables vi and p. The equations are integrated in time using the fractional-step method8. The first sub-step requires the solution of an advection-diffusion equation. Here we employ a second-order Adams-Bashforth scheme is employed for the convective terms while the diffusion terms are discretized using an implicit Crank-Nicolson scheme which eliminates the viscous stability constraint. The second sub-step requires the solution of the pressure-correction equation which is solved with the constraint that the final velocity be divergence-free. This gives a Poisson equation for the pressure which is solved with a highly efficient geometric multigrid method. Once the pressure is obtained, the velocity field is updated to its final value.
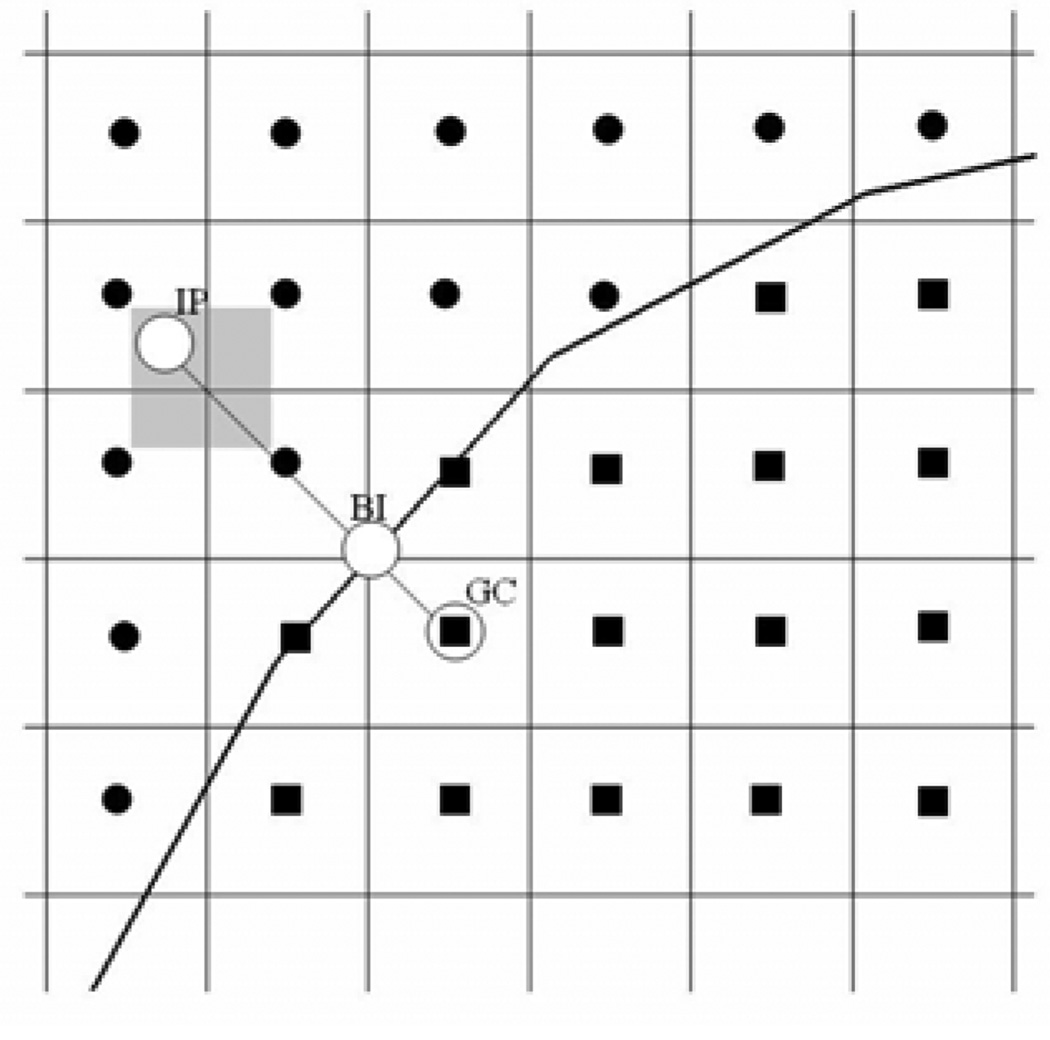
A multi-dimensional ghost-cell methodology is used to incorporate the effect of the immersed boundary on the flow. This method falls in the category of sharp-interface "discrete forcing" immersed boundary methods as described in Mittal and Iaccarino26. The surface of three-dimensional bodies such as the vocal fold that is the subject of the current study, is represented by an unstructured grid with triangular elements. This surface grid is then "immersed" into the Cartesian volume grid. Figure 2 shows a 2D schematic of an immersed body on a Cartesian grid. The method proceeds by identifying "ghost-cells" which are cells on either side of the immersed boundary which have at least one neighbor on the other side of the fin. A "probe" is then extended from the node of these cells onto an "image-point" (denoted by “IP”) on the other side of the body such that it intersects normal to the immersed boundary and the boundary intercept (denoted by "BI") is midway between the ghost-node and the image-point. Next a bi-linear interpolation is used to express the value of a generic flow variable at the image-point in terms of the surrounding nodes. Following this, the value of variable at the ghost-cell (denoted by "GC") is computed by using a central-difference approximation along the normal probe such that the prescribed boundary condition at the boundary intercept is incorporated. Using this procedure, the boundary conditions are prescribed to second-order accuracy and this, along with the second-order accurate discretization of the fluid cells leads to local and global second-order accuracy in the computations. This has been confirmed by simulating flow past a circular cylinder on a hierarchy of grids and examining the error on these grids27.
Figure 2.
Schematic of the immersed boundary representation in the current method. IP: image point, GC: ghost point, BI: Boundary Intercept point.
Boundary motion can now be included into this formulation with relative ease. Since the equations are written in the Eulerian form, all that is required is to move the boundary at a given time-step, recompute the body-intercepts and image-points, and then advance the flow equations in time. The boundary motion is accomplished by moving the nodes of the surface triangles in a prescribed manner. The general framework can therefore be considered as Eulerian-Lagrangian26, wherein the immersed boundaries are explicitly tracked as surfaces in a Lagrangian mode, while the flow computations are performed on a fixed Eulerian grid. Further details regarding such immersed boundary methods can be found in Mittal and Iaccarino26, and Mittal et al.27
Vocal Fold Dynamics Model
In normal phonation, vibration only causes a small deformation in the vocal folds and therefore, the vocal folds can be modeled as linear viscoelastic solids the dynamics of which are governed by the two-dimensional Navier equation
| (4) |
where i and j range from 1 to 2, fi is the body force component in i direction, ρ is vocal fold tissue density, ui is displacement in i direction and üi is the acceleration component in i direction.
Assuming a Kelvin-Voigt model13 for the viscoelasticity, the constitutive law between stress and strain can be written as:
| (5) |
where σ is stress tensor, ε is the strain tensor, ε ˙ is the strain rate tensor and C and A are fourth-order tensors corresponding to the material constants. The vocal folds have three distinct constituents: muscle (vocalis), ligament and cover, and all three have different material properties which can be approximated by choosing appropriate values of C and A.
The Navier equation in Eq (4) coupled with the constitutive law in Eq (5) is solved using the finite element method (FEM)33. A mesh made of triangular elements is employed for the vocal folds and discretization of the above equations on this mesh33 leads to the following discrete equation for the vocal folds:
| (6) |
where Mαβ is the mass matrix, Cαβ is the damping matrix, Kαβ is the stiffness matrix, Uβ is the nodal displacement, and Fα is the external force. This is a second-order ordinary differential equation in time and is discretized using the second-order Newmark scheme33. The Cutill-Mckee and Gibbs-Poole-Stockmeyer11 methods are used to re-index the nodes to produce a banded matrix and a banded LU decomposition solver is used to solve the system of algebraic equations.
Vocal Fold Contact Model
The two vocal folds contact each other during phonation and appropriate modeling of this contact is important in order to ensure realistic dynamics of the vocal folds34. In the current study we have use the penalty coefficient method6 to model vocal fold contact. According to this method, the contact force is modeled as follows:
| (7) |
where is the nodal contact force, ∂νc is the contact area, γ is the penalty coefficient, g is the penetration distance and Na is the shape function employed in the FEM. The above model creates a contact force that opposes penetration of one vocal fold into another and this force is proportional to the penetration distance with γ as the constant of proportionality. By choosing different values for γ, one can enforce different types of contact with higher values of γ leading to a more "hard" contact condition. In the current simulations we employ a γ value of 104 times maximum stiffness coefficient and this follows the approach used in previous studies6. The above contact force is added to the right hand side of Eq.(6) in the current method in order to incorporate the contact effect into the dynamics of the vocal folds.
Flow-Tissue Coupling
Since the vocal fold tissue is about 1000 times denser than air, explicit coupling between the airflow and vocal folds can be used for these simulations without causing any numerical instability. In explicit coupling, the flow is marched by one step with the current deformed shape and velocities of fluid/solid interface as the boundary conditions. The aerodynamic forces imparted on the VF are then calculated at current location of the vocal fold surface via an interpolation scheme on the flow grid. Finally, the solid is marched by one step with the updated forces, and the deformation and velocities on the solid grid are interpolated onto the vocal fold surface, so that the fluid/solid interface is updated. This explicit coupling is quite simple, robust and efficient and is found to work well for the VF vibration problem. Implicit coupling, if needed, can be easily incorporated by iterating between the fluid and solid solvers at each time-step.
SIMULATION SETUP
Geometric Model and Flow Conditions
The shapes of the vocal folds and the false vocal folds are based on a high resolution(0.5mm plane-to-plane resolution) laryngeal CT scan of a 30 year old male subject with normal (undiseased) vocal folds taken at The George Washington University hospital. Figure 3 shows a close-up coronal view of the CT at the anterior-posterior midline of the glottis and the geometric model attempts to match the key geometrical features in the CT scan. Since the model in the current study is two-dimensional, we do not take account of the variations in laryngeal geometry in the anterior-posterior direction. The majority of past studies have employed two-dimensional laryngeal models and have found that these models provide good insights into the biomechanics of phonation9,11,15,16,17,18,19,20,22,24,31,40,42,48,49,50,41. Two dimensional models have also been found to predict many of the salient features of the vocal-fold vibration and glottal aerodynamics. Three-dimensional models certainly provide higher modeling fidelity but also require significantly larger computational effort. The only three-dimensional laryngeal model that has been described in some detail (to the best of our knowledge) is that of Rosa, et al34, although the fluid domain mesh in their model was rather coarse and no grid refinement study was provided. It should be pointed out that the current simulations include full Navier-Stokes modeling of the fluid flow as well as continuum based modeling of vocal fold and this is a significant improvement over many of the past studies which have resorted to reduced models for the fluid flow11,15,17,18,19,22 and/or the vocal fold dynamics9,11,16,17,18,19,20,22. Furthermore, we demonstrate the accuracy of our simulations via a grid refinement study and well as systematic comparisons with a number of distinct experimental studies. Thus, despite assumption of a two-dimensional configuration, a case is made that our 2D model provides useful new insights into the role of false vocal folds during phonation and is a good precursor to the more realistic three-dimensional model.
It should also be noted that there is significant variation in the laryngeal geometry among individuals but since we are interested in studying a prototypical larynx, we do not attempt to match all the finer details present in the CT scan. Due to a slight rotation of subject’s head, the two vocal folds in the CT scan appear to be asymmetric. To eliminate this asymmetry, only the shape of the right vocal fold is used and left vocal fold is created by mirroring the right vocal fold about the centerline.
Following the approximate dimensions found in the CT scan, the overall dimensions of the flow domain show in Figure 3(b) is chosen to be 12 cm long by 2 cm wide. The true vocal folds are 1 cm long and extend 0.99 cm towards the glottal midline. The false vocal folds are 2.3 cm long and extend 0.67 cm towards the supraglottic space. The ventricles are about 0.56 cm wide at their widest location. The false vocal fold gap is0.667cm which is in the range reported by Furmanik et al.13, Scherer et al.35 and Sakakibara et al.37
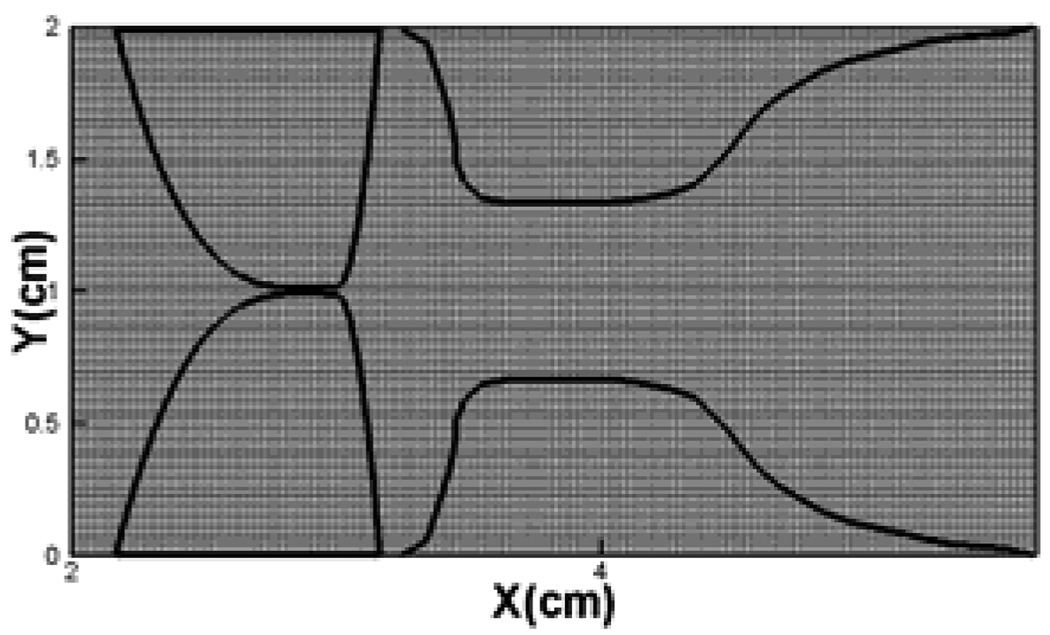
Dirichlet boundary conditions are applied for the pressure at both the inlet and outlet. The gage pressure at inlet is 1 kPa and at outlet is 0 kPa which is equivalent to 10.2 cm of water and in the physiological range for phonation. Zero normal gradient velocity gradient boundary condition is applied at the inflow and outflow and this allows the flow rate to settle to a value dictated by the pressure drop and the flow impedance. Finally, no-slip and no-penetration boundary conditions are applied on the walls and the flow-tissue interfaces. The computational grid is selected after a grid refinement study and the nominal Cartesian grid chosen (shown in Figure 4) is relatively dense with288 × 256 points.
Figure 4.
Grid used in the vicinity of vocal folds and false vocal folds in the current simulations.
Tissue Properties
The false vocal folds (FVFs) are modeled as rigid bodies since they do not move during normal phonation, and the true vocal folds (TVFs) are modeled as viscoelastic bodies. The cover-ligament-muscle model has been used to build up the internal structure of the TVFs. The three layer structure shown in Figure 5 employed here is the same as that used by Luo et al24. The vocal folds have been assumed to satisfy the two-dimensional isotropic plain strain condition. In actuality however, vocal folds are subject to a longitudinal stress which changes the effective stiffness of the vocal folds. While we cannot directly account for this longitudinal stress in the current 2D vocal fold model, the effect of this longitudinal stress can be incorporated by increasing the in-plane stiffness of the vocal folds. In the current study, we estimate this enhanced modulus such that the vocal fold eigenfrequencies are in the normal range of phonation. A similar approach has been used in the past by Luo et al24 and the material properties used for the vocal folds are shown in Table 1. The true vocal fold mesh has 17202 triangular finite elements and therefore provides high resolution for the solid dynamics solver.
Table 1.
Material properties adopted in the three-layer true vocal fold model.
| ρ(g/cm3) | E(kPa) | ν | η(poise) | |
|---|---|---|---|---|
| Body | 1.043 | 52 | 0.3 | 6 |
| Ligament | 1.043 | 104 | 0.3 | 5 |
| Cover | 1.043 | 26 | 0.3 | 3 |
RESULTS AND DISCUSSION
In this section we focus on describing the results from two laryngeal models, one with false vocal folds (denoted succinctly as the (+)FVF case) and one without (denoted as the(−)FVF case). Both simulations are run for over 10 cycles to ensure that initial transients are eliminated from the analysis. Table 2 summarizes the key flow and vibration quantities computed for the two cases. It should be noted that since the current simulations are two-dimensional, the flow rate is provided in term of flow rate per unit anterior-posterior length of the glottal gap, and thus has units of (m2/s). However, in order to connect this flow rate with those seen in real larynges, we also recomputed the flow rate by assuming the anterior-posterior length of the glottal gap to be 2 cm. These values are also provided in the Table in units of ( ml/s ).
Grid Refinement Study
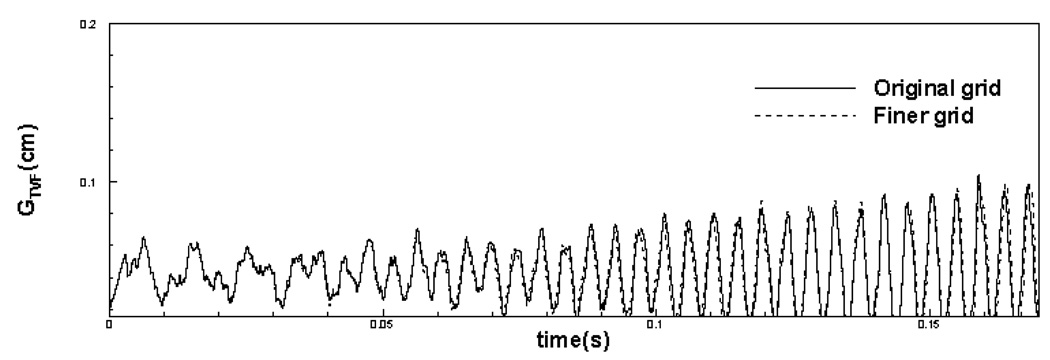
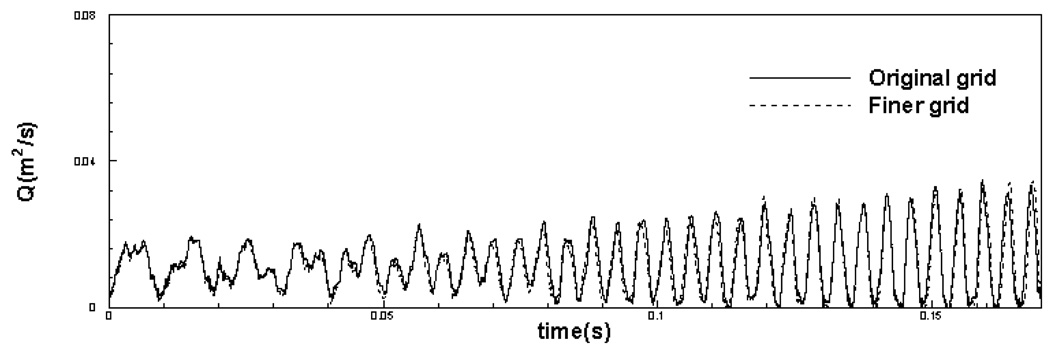
In order to demonstrate the grid independence of the computed results, the (+)FVF simulation has also been carried out on a finer 288 × 512 mesh, where the nominal resolution in the lateral direction is increased by a factor of two. It should be noted that thin boundary and shear layers are formed in the glottal flow which required high resolution in this direction. Therefore adequacy of grid resolution in this direction is particularly important. The simulations have been carried out until t = 0.17 seconds, which corresponds to over 30 laryngeal vibration cycles. Figure 6 and Figure 7 show comparison of time variation of glottal gap width and volume flow rate respectively for original (nominal) grid and the finer grid. It can be found that glottal gap width and volume flow rate do not change to any appreciable extent with grid refinement. The maximum difference in the glottal gap width and the volume flow rate between these two simulations is 4 % and 4.6 % respectively of the maximum values of these quantities. The difference in the mean values of glottal gap width and the volume flow rate between these two simulations is 2% and 3.4% respectively. The fact that doubling of the resolution does not lead to any substantial changes in the flow and the vibration characteristics indicates that the current grid is fine enough to produce grid independent results. Thus, beyond this time-instant, we continue with the simulations only on the nominal grid. Simulations are carried out for over 70 vibration cycles whereby both cases reach a well defined stationary state. We then simulate 10 more cycles beyond this point and base our analysis on these 10 cycles.
Figure 6.
Comparison of time variation of glottal gap width for original grid and finer grid.
Figure 7.
Comparison of flow volume flux rate for original grid and finer grid.
True Vocal Fold Vibrations
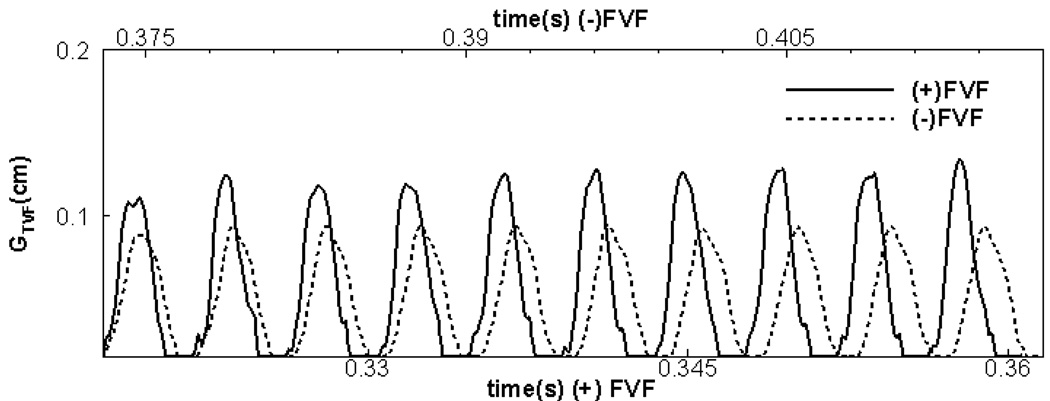
Figure 8 shows the time variation of the glottal gap width with time and it can be seen that both cases reach a state of nearly periodic self-sustained vibration. Note that even in the stationary state, the flow and the vibration are not perfectly periodic. The underlying reason for this slight cycle-to-cycle variation (the maximum cycle-to-cycle difference of gap width and volume flux in these ten cycles is less than 5% of the respective nominal values) is the inherent non-linearity of the coupled fluid-structure system. The use of full Navier-Stokes flow model with a high resolution, three-layer FEM model for the true vocal folds leads to a system that is capable of complex excitation modes which can lead to small cycle-to-cycle variation. This irregular vibration also can be found in other previous studies that have employed continuum models for the VF. For example, in Rosa et al.34, the volume flow rate exhibited small cycle-to-cycle variations. Similarly, Jiang and Zhang19,20 have shown that feedback from the turbulent glottal jet can induce complex, and sometimes chaotic vibrations in the vocal folds. Given that these variations are small, ten vibration cycles provide a good statistical estimates of the key quantities.
Figure 8.
Comparison of the time-variation of the glottal gap width for the two cases.
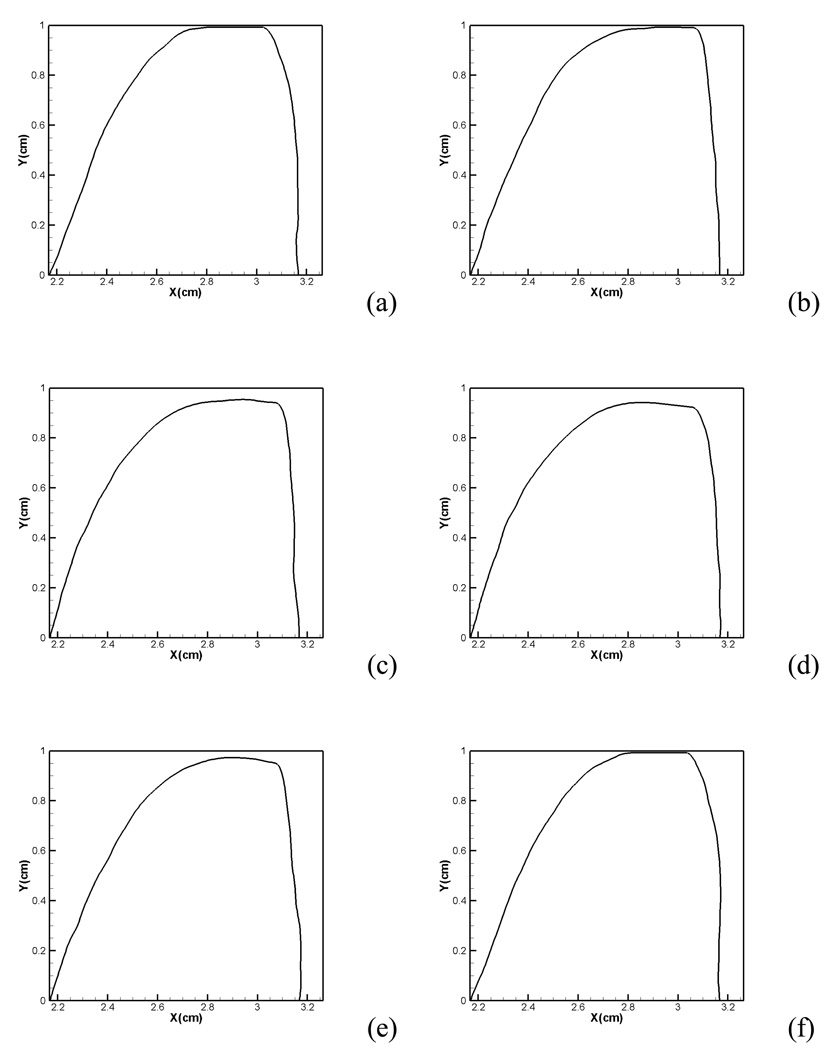
During a vibration cycle, high-speed photogrammetry of the larynx has revealed that the vocal folds start to open from beneath with an upward progression of the so called mucosal wave and this leads to a convergent shape during the abduction phase. Conversely, during the adduction phase, the lower edges lead the upper edges towards closure resulting in a diverging shape of the glottal gap47. In order to examine the vibration pattern in our simulations, the conformations of the true vocal fold (left vocal fold only) at six equispaced time instants within a vibration cycle are plotted in Figure 9. In Figure 9(b), the lower edge of true vocal fold starts to open and the upper edge of true vocal fold remains effectively closed. Thus, at this time instant, the glottis appears to have a convergent shape. The abduction of the vocal folds continues until the entire vocal fold has pushed back from the glottal midline as shown in Figure 9(c). The vocal folds then start the adduction phase and as can be seen in Figure 9(d), (e), the lower edge leads the upper edge towards closure and the glottis assumes a divergent shape during this phase. Thus, the correct vocal fold vibration pattern has been successfully captured by the current study47.
Figure 9.
Vocal fold shapes at different instantaneous time instant within a vibration cycle: (a) 0.3384s (b) 0.3392s, (c)0.3400s, (d) 0.3409s, (e) 0.3416s, (f) 0.3427s
The phonation frequency (F0 ) calculated from the variation in Figure 8 indicates values of 232Hz and 227Hz for the (+)FVF and (−)FVF cases respectively. These values are at the upper end of the range associated with normal phonation in humans. It is also interesting to note that for the current case, the presence of the false vocal folds does not seem to have a significant effect on F0.
Figure 8 shows the time variation of the glottal gap (gap between the two true vocal folds) for the two cases. As can be seen from the plot, both cases have reached a stationary state wherein the maximum gap is nearly constant from cycle-to-cycle for the two cases. Interestingly, the simulations indicate that the false-vocal folds have a noticeable effect on the amplitude of the true-vocal fold vibration. In particular where as the time-average value of the maximum glottal gap for the (−)FVF case is 0.0929 cm, the corresponding value for the (+)FVF case is 0.1238 cm. Thus, the presence of the FVF increases the amplitude of the TVF vibration by about 33%. Note that since most of the past studies1,21,48 on FVF function have not included dynamically coupled models for the TVFs, this effect has not previously been observed. The presence of this effect has significant implications for the functional morphology of false vocal folds. First, it indicates that the false vocal folds potentially play an active role in facilitating phonation since they lead to a higher amplitude of vocal fold vibration for a given translaryngeal pressure drop. Conversely, removal of false vocal folds (as is done in some supraglottic laryengectomies) would lead to a reduced ability to phonate. This is inline with the observations of Maceri et al25. Although we have not conducted a study of the onset of phonation, the current results would seem to suggest that the presence of the false vocal folds could also reduce the threshold phonation pressure and removal of false vocal folds could lead to increased required effort for phonation.
The physical mechanisms that underlie this effect of the FVF however are far from clear but the current simulations afford us the opportunity to gain insight into thisphenomenon. Clearly, the increase in TVF vibration amplitude due to the presence of the FVF involves modification of the glottal flow and feedback of this onto the pressure on the true vocal folds. We now examine the glottal aerodynamics and the structural dynamics in order to gain insight into this feedback process.
Translaryngeal Flow Rate and Impedance
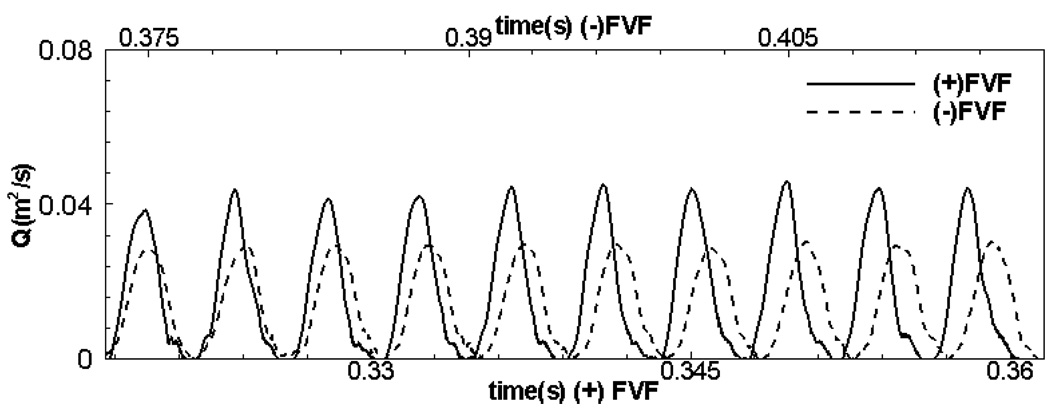
Figure 10 shows the temporal variation of the flow rate through the glottis for the two cases and it can be seen that the presence of the FVF results in an increased translaryngeal flow rate. The time-mean flow rates are computed to be 1.338 × 10 −2 m2/s (332 ml/s ) and 1.619 × 10 −2 m2/s (266 ml/s ) for the (−)FVF and (+)FVF cases respectively. Thus, the presence of the false vocal folds increases the mean flow rate by about 21%. Furthermore, the time-averaged, peak flow rate increases from 2.97 × 10 −2 m2/s(587 ml/s ) for the (−)FVF case to 4.32 × 10 −2 m2/s (865 ml/s ) for the (+)FVF cases and this represents a 32% increase in this value. It should noted that while the increase in flow rate is directly connected with the increased amplitude of glottal vibration (and therefore the glottal gap), the differences between the relative increase in peak and mean values of the glottal gap and flow rate suggest that the cases with and without false vocal folds also have other differences including the shapes of the velocity profile through the glottis as well as the temporal variation of the shape of the glottal gap. Translaryngeal flow impedance can be defined in the usual way as in Eq. (1) and computed for these two cases. Our calculations show that the impedance for the (−)FVF case is 74756 whereas that for the (+)FVF case is 61767 . In units of cm of water per ml/s of flow rate, the translaryngeal flow impedance is 0.040 and 0.033 for the (−)FVF and (+)FVF cases respectively. Thus, there is a significant (nearly 17%) reduction in the translaryngeal flow impedance due to the inclusion of the false vocal folds.
Figure 10.
Comparison of the time variation of the volume flow rate for the two cases.
As mentioned in the introduction, a number of previous studies have examined the issue of the effect of FVF on flow impedance and it is useful to make some comparisons with these previous studies. One of the most relevant studies in this regard is that of Agarwal et al1. This study employed a static model of the larynx and determined the change in flow impedance for a number of different TVF and FVF geometries. One key parameters that was varied in this study was the ratio of the FVF gap to TVF gap (ratio denoted here by η) and reduction in translaryngeal flow impedance was found for the various laryngeal shapes for η >1. Thus, as long as the FVF gap was larger than the TVF gap, there was some reduction in the translaryngeal flow impedance. However, noticeable (upto 25%) reduction in translaryngeal flow impedance was seen only in the range of η from about 2 to 6. For the current simulations, given that for the (+)FVF case, the peak value of the TVF gap is 0.1238 cm and the FVF gap width is 0.667cm, the value of the η for the current simulation can be estimated to be about 5.4. For a similar ratio of gap-widths, Agarwal et al.1 observed a reduction in flow impedance of up to about 20% for some cases, and therefore, the current results are inline with this previous study. This is despite the fact that the current study employs flow-structure interaction between the flow and the true vocal folds whereas the study of Agarwal et al.1 employed static true vocal folds.
Zhang et al.48 used simulations to examine, among other things, the effect of false-vocal folds on glottal aerodynamics and found that the presence of the false vocal folds produced a small reduction in translaryngeal flow impedance. However, there were two key differences between their simulations and the current study. First, the motion of the true-vocal folds was prescribed in their study and therefore could not respond dynamically to changes in the flow. Second, their simulations assumed axisymmetry and therefore precluded the jet from exhibiting any asymmetric behavior including bistability10 as well as the so called Coanda effect. As will be shown later, this could potentially have a significant impact on the effect of the false vocal folds.
Finally we compare our results with the in-vitro studies of excised canine larynges by Alipour et al.4 who concluded that the presence of the false vocal folds increased thedifferential flow resistance (defined as ). However a closer look at their results (see Table 2 and Fig. 3 and Fig. 5 of their paper) indicates that for many cases, especially those with flow rates less than about 600 ml / s, the flow resistance as defined in Eq. (1) is actually lower with the FVFs than without. Beyond this flow rate, the flow undergoes a transition and the translaryngeal flow resistance with FVF suddenly surpasses that of the case without FVF.
As mentioned before, if we assume in our case that anterior-posterior length of the glottal gap is 2 cm, (a value inline with human anatomy) then we can estimate that the mean flow rate in the current simulations for the (−)FVF case is about 266 ml/s whereas that for the (+)FVF case is about 322 ml/s. If we consider the data in Fig. 3 of Alipour et al.4, we note that for a pressure difference of 10 cm of water (which is similar to our pressure difference), the flow rates for the (−)FVF and (+)FVF cases are about 330 ml/s and 480 ml/s respectively. At a lower pressure difference of about 7 cm of water, the values for the (−)FVF and (+)FVF cases are about 240 ml/s and 360 ml/s respectively in the study of Alipour et al.4. Thus, given all of the differences between our simulations and the in-vitro study of Alipour et al.4, the results regarding translaryngeal flow resistance are reasonably inline with each other thereby suggesting that the current simulations and modeling approach are capturing the key features of the laryngeal dynamics.
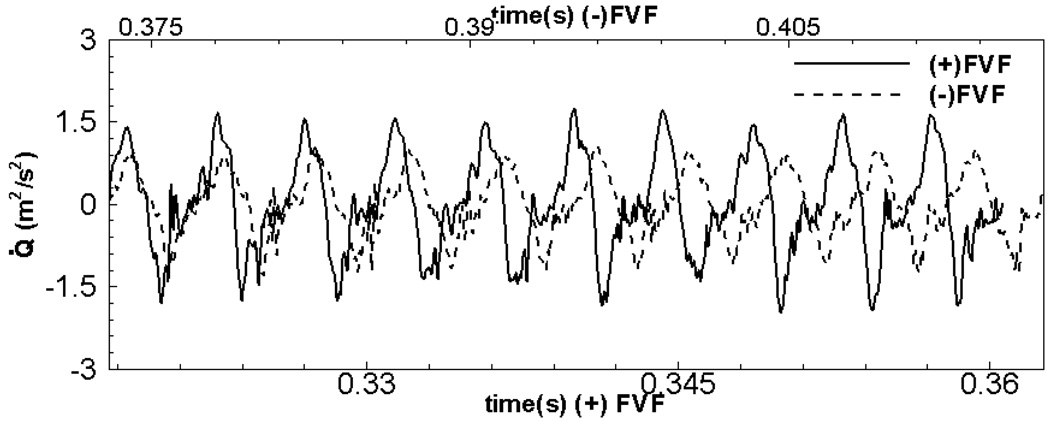
The unsteady flow rate through the glottal gap has a direct relation to the sound produced during phonation. In particular, the monopole sound strength is directly related to the time-rate of change of the volume flow rate48, i.e. Q˙ = dQ/dt. In Figure 11, we have plotted this quantity for the two cases and it can be clearly seen that the (+)FVF case has a larger peak value of Q˙. This implies that for a given pressure across the larynx, the presence of the FVF will result in a larger sound pressure. This observation is in line with the in-vitro study of Alipour et al.4, and also confirms the clinical observation that the removal of FVF results in a reduced ability to phonate.25
Figure 11.
Comparison of the time-rate of change of the flow rate,Q˙, for the two cases. This quantity is related to the monopole source strength of sound.
Dynamics of Glottal Jet and Mechanism for Impedance Reduction
The above results indicate that the presence of the false vocal folds increase flow rate as well as vocal fold vibration amplitude. However the physical mechanism that underlies this behavior need to be understood. In this section we conduct a detailed analysis of the flow to gain insight into this issue.
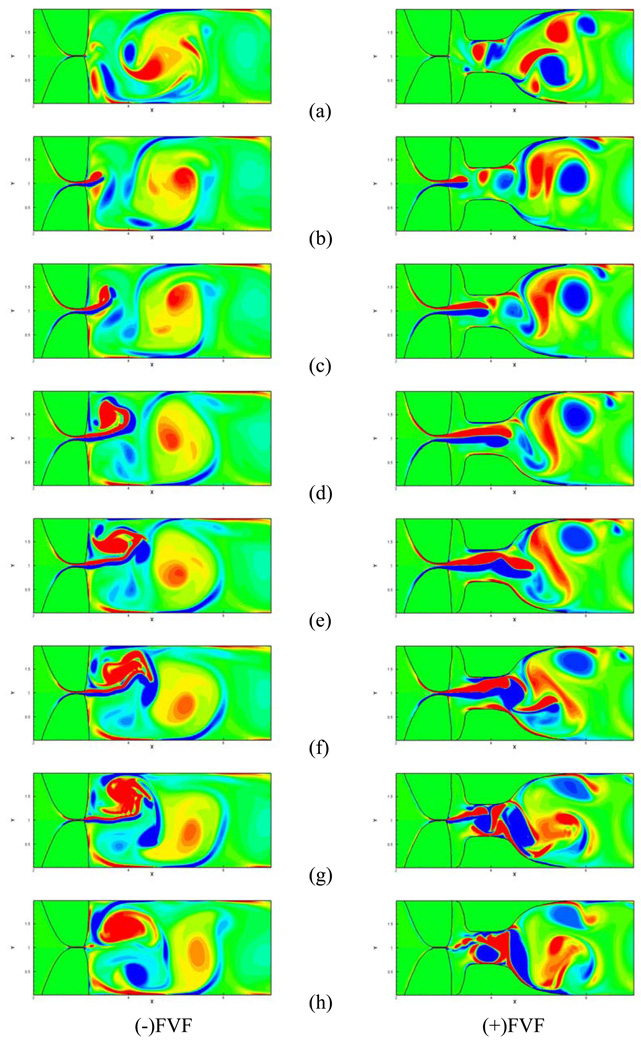
Figure 12 shows a sequence of spanwise vorticity plots over one vocal fold vibration cycle for the two cases. The sequence starts with the situation where the vocal folds are just about to open. At this time instant, the supraglottic regions contain vortices created in the previous cycle. In the (−)FVF case, there are some large vortices in the vicinity of the glottal exit whereas in the (+)FVF case, the large vortices are found further downstream between the FVF gap and beyond. As the vocal folds start to open, we observed the formation of a vortex dipole for both the cases (Figure 12(b)). However, immediately, the two flows start to exhibit a noticeable difference; for the (−)FVF case, the vortex dipole deflects significantly from the glottal centerline whereas for the (+)FVF case, the vortex dipole maintain a high level of symmetry. At a later time instance, the deflection of the shear layer emanating from the glottis is further accentuated for the (−)FVF case to the extent that the shear layer in Figure 12 (d) approaches the upper wall of the channel as it starts to roll up into a large counter-clockwise rotating vortex. In contrast, the shear layer from the (+)FVF case at the same time instant, deflects slightly towards the upper false-vocal fold but otherwise maintains it's streamwise orientation. At the later stages of the vibration cycle, the flow near the glottis for the (−)FVF case contains large vortices of both sign whereas in the (+)FVF case, the large vortices are limited to the supraglottic space between and downstream of the FVFs. These observations are inline with the experiments of Shadle et al38 and Kucinschi et al21 that found that the jet was straightened due to the presence of the FVFs.
Figure 12.
Contours of spanwise vorticity for the two cases over one vocal fold vibration cycle. The eight plots correspond to eight equispaced time intervals over the vibration cycle.
The flow condition in the supraglottic region at the end of the cycle then sets the stage for the evolution of the flow in the next cycle. As the vocal folds open again, the vortices in FVF gap for the (+)FVF case get pushed out due to the incoming volume flux and are not able to influence the formation of the new glottal jet. In contrast, for the (−)FVF case, the new jet enters the supraglottic space and is immediately influenced by the large vortices created in the previous cycle. Depending on the arrangement of these vortices at the instant the jet begins to emerge, the jet can deflect upwards or downwards. It should noted that cycle-to-cycle jet deflection has been observed in the experiments of Neubauer29 where the flow had a significant turbulence component. Thus the presence of turbulence might modify the details of the flow but the flapping of the glottal jet is not suppressed.
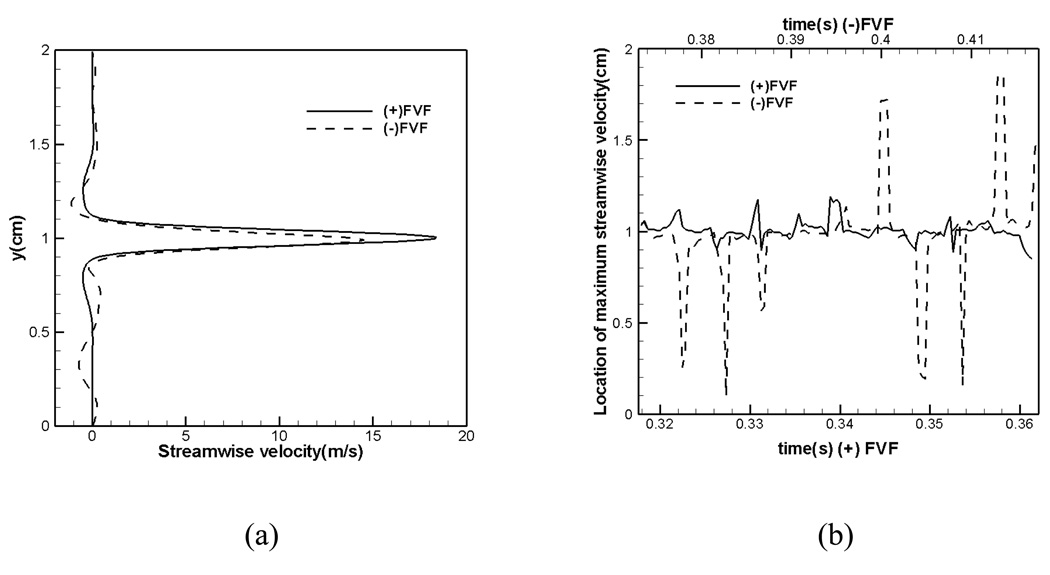
The jet deflection is a key feature of this flow and we examine this behavior further for the two cases. In order to track the deflection of the jet, we determine the y-coordinate of the maximum jet velocity over time at a streamwise location corresponding to x=3.2cm which is just downstream of the glottis. Figure 13(a) shows the time averaged streamwise velocity at this streamwise plane for the two cases. As can be observed, the peak glottal jet velocity is in the 15 to 20 m/s range and the peak velocity for the (+)FVF case is higher than the (−)FVF case. In Figure 13(b), we have plotted the y-coordinate corresponding to the peak velocity for the two jets over ten vibration cycles and this plot clearly shows the effect of the FVF on the glottal jet deflection. Whereas in the (+)FVF, the jet deflection about the centerline is small (< 0.2cm), the jet deflection in the (−)FVF case is large, reaching up to about 0.8cm. Thus, the presence of the FVF significantly reduces the jet deflection immediately downstream of the glottis.
Figure 13.
(a) Streamwise velocity profile immediately downstream of the glottis at one time instance for both cases. (b) Temporal variation in jet deflection for both cases.
It is also noted that the deflection in both cases has a stochastic character and the jet deflects randomly in one direction or the other from cycle-to-cycle. This behavior is directly associated with the vortex structures present in the supraglottic region. These vortices undergo complex non-linear interactions and result in flow configurations which are different for each cycle. As the glottal jet emerges into the supraglottic region, it immediately encounters these vortical structures and deflects according to the particular vortex configuration present at that instant. The presence of the FVF moves these vortices further downstream (into the FVF gap and beyond) and the glottal jet therefore does not encounter strong vortices until it reaches the FVF gap. Furthermore, the relatively narrow FVF gap also does not allow the jet to deflect too much from the centerline. Thus both these factors results in a significantly reduced jet deflection in this case.
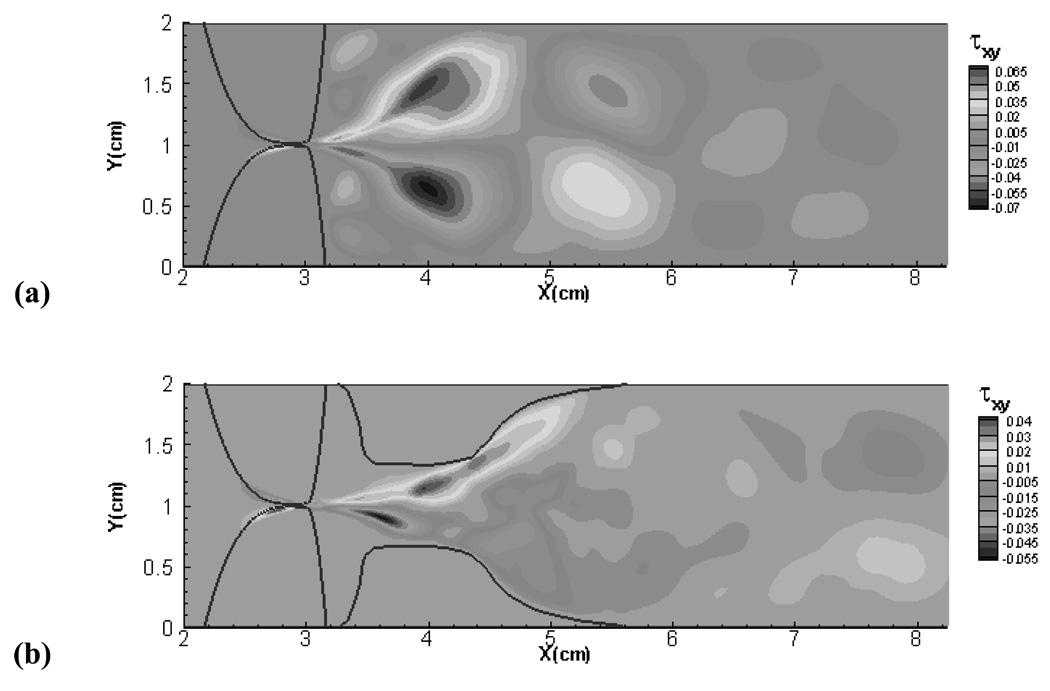
The above observations about the glottal aerodynamics point to a mechanism for the reduction in flow impedance with the addition of the FVF. In order to understand this mechanism it is useful to revisit the pressure loss mechanisms in pipe and channel flows. If we consider fully developed flow in a pipe or channel with no area variation, loss in pressure is exclusively due to viscous losses and this is usually called the "major" loss46. In addition, there are also the so called "minor" losses which are attributed to sharp bends, expansions, contractions etc. Such features produce flow separation and unsteadiness and sometimes even turbulence. All of this increases the mixing and this tends to increase the viscous losses in the flow46. Thus, features that enhance the mixing in the flow also tend to increase the resistance to the flow. Comparing the supraglottic flow for the (−)FVF and(+)FVF cases, it seems apparent that the suppression of the large scale random jet deflection in the (+)FVF will reduce mixing in the supraglottal flow and in doing so, reduce the losses associated with this phenomena. In order to confirm this we have plotted for both cases, contours of the fluctuation shear stress τ ′xy which is defined as
| (8) |
where are the velocity fluctuations in the x and y velocity components, UG is the time averaged velocity through the glottis (estimated as / UG = Q̄/ḠTVF ) and 〈• 〉 denotes a time-average. From Figure 14, we can see that the (−)FVF case shows a peak magnitude of the fluctuation shear stress of 0.07 whereas that of the (+)FVF case is about 0.055 which represents a 21% reduction. In addition, the region of large fluctuation shear stress is also much larger for the (−)FVF case. This clearly shows that the presence of the false vocal folds reduces the fluctuation shear stress and hence the viscous losses in the flow, and provides a clear mechanism for the observed reduction in flow impedance.
Figure 14.
Contours of fluctuation shear stress in the glottal jet. (a) (−)FVF case (b) (+)FVF case.
Vocal Fold Vibration
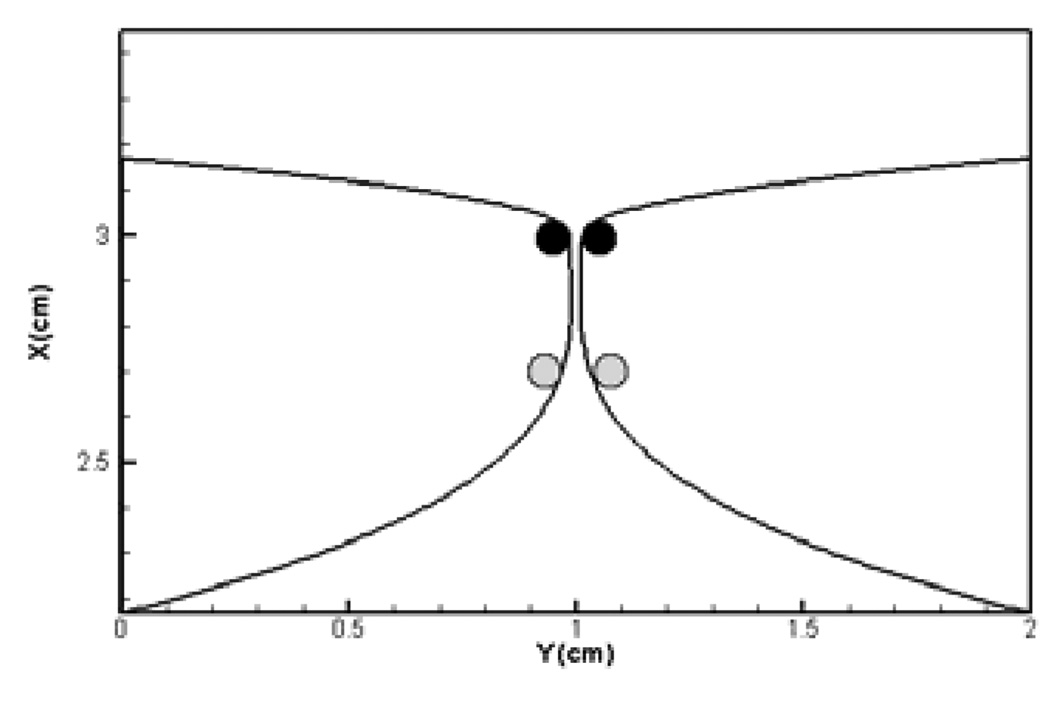
In contrast to all of the past numerical and experimental studies, the current study includes flow-induced vibrations of the TVF. This allows us to examine the effect that supraglottic flow has on the TVF vibrations. In order to examine the symmetry of the TVF vibration we have tracked two sets of points on the two vocal folds. As shown in Figure 15, one set of points is on the superior edge whereas the other set is on the inferior edge of the true vocal folds. Correlating the motion of these two sets of point should provide us with a clear understanding of the symmetry of the vocal fold vibration.
Figure15.
Points selected on TVF surface for analysis of vibration symmetry.
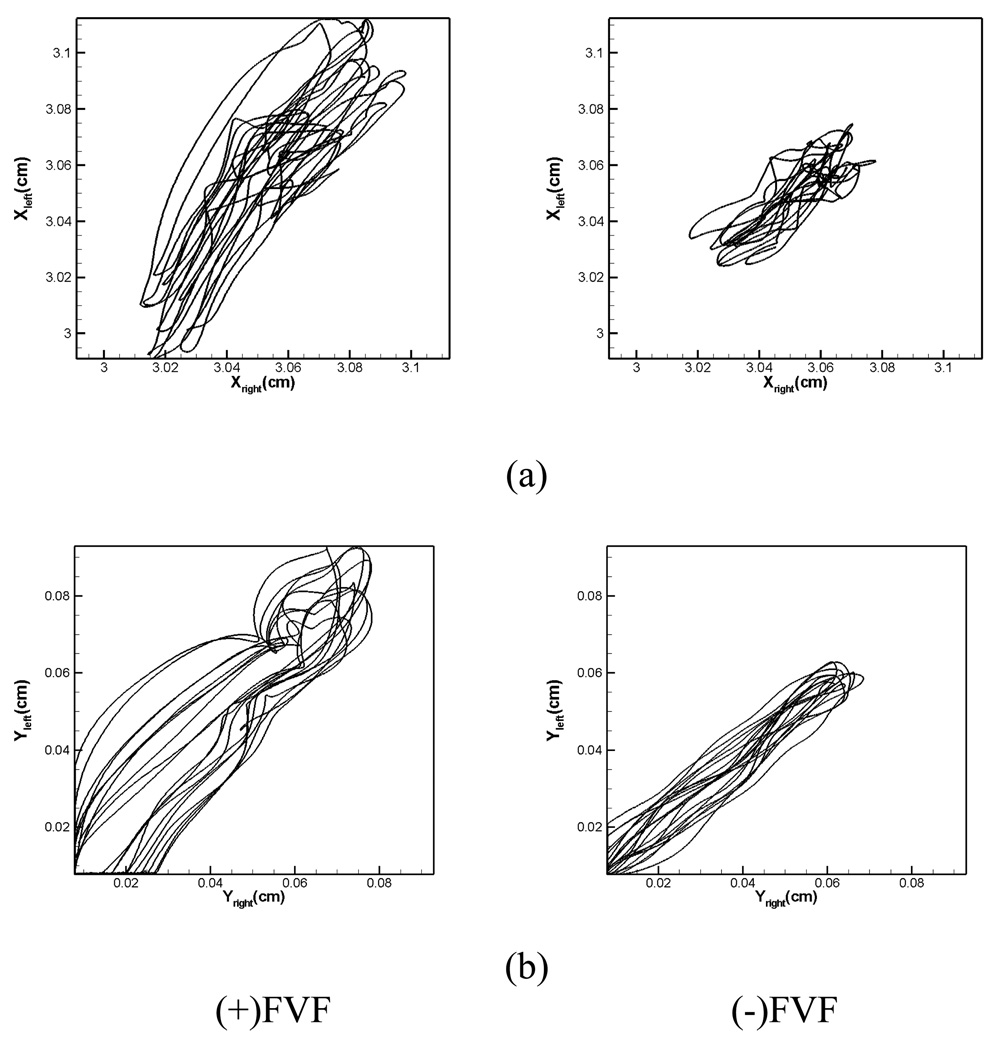
Figure 16 shows a comparison of the x- and y- displacements of the vocal folds for the two cases. These plots are phase-plane plots and display the displacement of a point on one vocal fold versus the corresponding point on the other vocal fold. Perfect correlation between the two vocal folds would correspond to a 45 degree straight line in these plots. As can be seen, there is some degree of asymmetry in the vocal fold vibration for both cases. Whereas the x-displacement in the (−)FVF case seems to be less symmetric than the (+)FVF case, the converse seems to be true for the y-displacement. A similar behavior is seen for the inferior points (not shown here).
Figure 16.
Phase plane plots of the displacement of the points on the superior side of the two vocal folds. (a) x displacement (inferior-superior) (b) y displacement (abduction-adduction) from centerline.
The asymmetry can be quantified by computing the correlation coefficient for the above displacements. For instance for the x-displacement, the correlation coefficient Rx can be computed as
| (9) |
where are the displacements of the points on bottom and top vocal folds about their mean position, and the summation is over the time-steps in the simulation. A similar definition is used for Ry and furthermore, the summation is carried out over ten vibration cycles.
Table 3 shows the computed correlations coefficient for the two sets of points. Interestingly the simulations reveal that whereas the presence of the FVFs increase symmetry in the x-motion (inferior-superior motion), they decrease symmetry in the y-motion(abduction-adduction motion). The increase in symmetry in the inferior-superior motion is due to the increased symmetry in the supraglottic flow for the (+)FVF case which results in a more symmetric pressure force on the two vocal folds. The increase in asymmetry in the abduction-adduction motion for the (+)FVF case is in our view, associated with the increased glottal flow and vibration amplitude for this case. In general, as the intensity of the glottal flow and vibration amplitude increases, the non-linearities in the glottal flow are enhanced and this can lead to more complex and asymmetric abduction-adduction motion in the vocal folds.
Table 3.
Comparison of correlation coefficients in vocal fold motion for both cases.
| Inferior Points | Superior Points | |||
|---|---|---|---|---|
| Rx | Ry | Rx | Ry | |
| (−)FVF Case | 0.652 | 0.951 | 0.653 | 0.954 |
| (+)FVF Case | 0.698 | 0.859 | 0.725 | 0.898 |
| % difference | +7% | −10% | +11% | −6% |
CONCLUSIONS
Computational modeling has been used to examine the role of false vocal folds on the phonation process. The models employ a simplified geometrical description of the larynx and high fidelity flow simulations coupled with a continuum finite-element model of the true vocal folds. Insight into the effect of the false-vocal folds on phonation is obtained by comparing two cases which are identical except that one case includes false-vocal folds and other does not.
Simulations indicate that the presence of the false vocal folds decreases translaryngeal flow impedance and increases the mean flow rate through the glottis. This also results in a larger amplitude of vibration in the true vocal folds. Thus, false-vocal folds tend to aid phonation by increasing the sound intensity for a given effort.
A key contribution of the current study is the identification of a physical mechanism for the reduction in translaryngeal impedance due to the false vocal folds.The simulations show that the presence of the false vocal folds reduces the stochastic deflections in the glottal jet. This reduces the mixing in the flow as evidenced by a reduced magnitude of the fluctuation shear stress. This in turn reduces the viscous losses and thereby the translaryngeal flow resistance.
ACKNOWLEDGEMENTS
The project described was supported by Grant Number ROlDC007125 from the National Institute on Deafness and Other Communication Disorders (NIDCD). The content is solely the responsibility of the authors and does not necessarily represent the official views of the NIDCD or the NIH.
REFERENCE
- 1.Agarwal M, Scherer R, Witt KD. Effects of false vocal fold width on translaryngeal flow resistance. Proceedings of the International Conference on voice physiology and biomechanics: modeling complexity; August 2004; Marseille, France. [Google Scholar]
- 2.Alipour F, Berry DA, Titze IR. A finite-element model of vocal-fold vibratin. J. Acoust. Soc. Am. 2000;108:3003–3012. doi: 10.1121/1.1324678. [DOI] [PubMed] [Google Scholar]
- 3.Alipour F, Fan C, Scherer RC. A numerical simulation of laryngeal flow in a forced-oscillation glottal model. Comput. Speech and Language. 1996;10:75–93. [Google Scholar]
- 4.Alipour F, Jaiswal S, Finnegan E. Aerodynamic and acoustic effects of false vocal folds and epiglottis in excised larynx models. Annuals of Otology, Rhinology & Laryngology. 2007;116(2):135–144. doi: 10.1177/000348940711600210. [DOI] [PubMed] [Google Scholar]
- 5.Arnold GE, Pinto S. Ventricular dysphonia: new interpretation of an old observation. Laryngoscope. 1960;70:1608–1627. doi: 10.1288/00005537-196012000-00003. [DOI] [PubMed] [Google Scholar]
- 6.Belyschko T, Liu W, Moran B. Nonlinear Finite Elements for Consttinua and Structures. 1st ed. New York: JOHN WILEY and SONS LTD; 2000. [Google Scholar]
- 7.Berg JVD, Zantema JT, Doornenbal P. On the air resistance and the Bernoulli effect of the human larynx. J. Acoust. Soc. Am. 1952;29:626–631. [Google Scholar]
- 8.Chorin AJ. Numerical solution of the Naiver-Stokes equations Math. Comput. 1968;22:765–742. [Google Scholar]
- 9.Duncan G, Zhai G, Scherer R. Modeling coupled aerodynamics and vocal fold dynamics using immersed boundary methods. J. Acoust. Soc. Am. 2006;120(5):2859–2871. doi: 10.1121/1.2354069. [DOI] [PubMed] [Google Scholar]
- 10.Erath BD, Plesniak MW. An investigation of bimodal jet trajectory in flow through scaled models of the human vocal tract. Experiments in Fluids. 2006;40:683–696. [Google Scholar]
- 11.Flanagan JL, Landgraf LL. Self-Oscillating source for vocal-tract synthesizers”. IEEE Transactions on Audio and Electroacoustics. 1968;16(1):57–64. [Google Scholar]
- 12.Everstine GC. The Bandit computer program for the reduction of matrix bandwidth for Nastran Technical Report 3827. Bethesda MD: David Taylor Naval Ship R&D Center; 1972. [Google Scholar]
- 13.Fung YC. Biomechanics. 2nd ed. New York: Springer-Verlag; 1993. [Google Scholar]
- 14.Furmanik F, Szczepinska J, Biegaj R. Relation of some dimensions of the middle part of the laryngeal cavity to span of the greater horns of the hyoid bone. Flolia Morphologica. 1976;35(2):123–131. [PubMed] [Google Scholar]
- 15.Guo C, Scherer RC. Finite element simulation of glottal flow and pressure. J. Acoust. Soc. Am. 1994;94(2):688–700. doi: 10.1121/1.406886. [DOI] [PubMed] [Google Scholar]
- 16.Hofmans GC, Groot G, Ranucci M, Graziani G, Hirschberg A. Unsteady flow through in-vitro models of the glottis. J. Acoust. Soc. Am. 2003;113(3):1659–1675. doi: 10.1121/1.1547459. [DOI] [PubMed] [Google Scholar]
- 17.Ishizaka K, Flanagan JL. Synthesis of voiced sound from a two mass model of the vocal cords. Bell System Tech. J. 1972;51:1233–1268. [Google Scholar]
- 18.Jiang JJ, Tao C. The minimum glottal airflow to initiate vocal fold oscillation. J. Acoust. Soc. Am. 2007;121(5):2973–2881. doi: 10.1121/1.2710961. [DOI] [PubMed] [Google Scholar]
- 19.Jiang JJ, Zhang Y. Chaotic vibration induced by turbulent noise in a two-mass model of vocal folds. J. Acoust. Soc. Am. 2002;112(5):2127–2138. doi: 10.1121/1.1509430. [DOI] [PubMed] [Google Scholar]
- 20.Jiang JJ, Zhang Y, Stern J. Modeling of chaotic vibrations in symmetric vocal folds. J. Acoust. Soc. Am. 2001;110(4):2120–2128. doi: 10.1121/1.1395596. [DOI] [PubMed] [Google Scholar]
- 21.Kucinschi BR, Scherer RC, DeWitt KJ, Ng TTM. Flow visualization and acoustic consequences of the air moving through a static model of the human larynx. J Biomech Eng. 2006;128:1–11. doi: 10.1115/1.2187042. [DOI] [PubMed] [Google Scholar]
- 22.Lamar MD, Qi Y, Xin J. Modeling vocal fold motion with a hydrodynamic semicontinuum model. J. Acoust. Soc. Am. 2003;114(1):455–464. doi: 10.1121/1.1577547. [DOI] [PubMed] [Google Scholar]
- 23.Leeper H, Heenemann H, Reynolds C. Vocal function following vertical hemilaryngectomy: a preliminary investigation. J Otolaryngol. 1990;19:62–67. [PubMed] [Google Scholar]
- 24.Luo H, Mittal R, Zheng X, Bielamowicz SA, Walsh RJ, Hahn JK. An immersed-boundary method for flow-structure interaction in biological systems with application to phonation. J. of Computational Physics. 2008 doi: 10.1016/j.jcp.2008.05.001. In Press. [DOI] [PMC free article] [PubMed] [Google Scholar]
- 25.Maceri DR, Lampe HB, Makielski KH, Passamani PP, Krause CJ. Conservation laryngeal surgery. A critical analysis. Arch Otolaryngol. 1985;111:361–365. doi: 10.1001/archotol.1985.00800080047003. [DOI] [PubMed] [Google Scholar]
- 26.Mittal R, Iaccarino G. Immersed boundary methods. Annu. Rev. Fluid Mech. 2005;37:239–261. [Google Scholar]
- 27.Mittal R, Dong H, Bozkurttas M, Najjar FM, Vargas A, Loebbecke AV. A versatile sharp interface immersed boundary method for incompressible flows with complex boundaries. J. Comput. Physics. 2008;227(10):4825–4852. doi: 10.1016/j.jcp.2008.01.028. [DOI] [PMC free article] [PubMed] [Google Scholar]
- 28.Maryn Y, Bodt MD, Van Cauwenberge P. Ventricular dysphonia: clinical aspects and therapeutical options. Laryngoscope. 2003;113:859–866. doi: 10.1097/00005537-200305000-00016. [DOI] [PubMed] [Google Scholar]
- 29.Neubauer J, Zhang Z. Coherent structures of the near field flow in a self-oscillating physical model of the vocal folds. J. Acoust. Soc. Am. 2007;121:1102–1110. doi: 10.1121/1.2409488. [DOI] [PubMed] [Google Scholar]
- 30.Peskin C. Ph.D Thesis. Albert Einstein College of Medicine; 1972. Flow pattern around heart valves: a digit computer method for solving equations of motion. [Google Scholar]
- 31.Pelorson X, Hirschberg A, Hassel RV, Wijnands APJ, Auregen Y. Theoretical and experimental study of quasisteady-flow separation within the glottis during phonation, application to a modified two-mass model. J. Acoust. Soc. Am. 1994;96(6):3416–3431. [Google Scholar]
- 32.Pinho S, Pontes P, Gadelha M, Biasi N. Vestibular vocal fold behavior during phonation in unilateral vocal fold paralysis. J Voice. 1999;13:36–42. doi: 10.1016/s0892-1997(99)80059-9. [DOI] [PubMed] [Google Scholar]
- 33.Robert DC. Concepts and Applications of Finite Element Analysis. 1st ed. New York: JOHN WILEY and SONS LTD; 1974. [Google Scholar]
- 34.Rosa MO, Pereira JC. A contribution to simulating a three-dimensional larynx model using the finite element method. J. Acoust. Soc. Am. 2003;114:2893–2905. doi: 10.1121/1.1619981. [DOI] [PubMed] [Google Scholar]
- 35.Sakakibara KI, Kimura M, Imagawa H, Niimi S, Tayama N. Physiological study of the supraglottal structures. Proceedings of the International Conference on voice physiology and biomechanics; August; Marseille, France. 2004. [Google Scholar]
- 36.Scherer RC. Doctoral thesis. Iowa: University of Iowa; 1981. Laryngeal fluid mechanics: steady flow considerations using static models. [Google Scholar]
- 37.Scherer RC, Vail VJ, Rockwell B. Examinaiton of laryngeal adduction measure EGGW. Producing speech: Contemporary Issues. American Institute of Physics. 1995:269–290. [Google Scholar]
- 38.Shadle CH, Barney AM, Thomas DW. An investigation into the acoustics and aerodynamics of the larynx. In: Gauffin J, Hammarberg B, editors. Vocal Fold Physiology: Acoustic, Perceptual and Physiological Aspects of Voice Mechanisms. Singular Publishing Co; 1991. pp. 73–82. [Google Scholar]
- 39.Stager SV, Bielamowicz S, Gupta A, Marullo S, Regnell JR, Barkmeier J. Quantification of static and dynamic supraglottic activity. J Speech Lang Hear Res. 2001;44:1245–1256. doi: 10.1044/1092-4388(2001/097). [DOI] [PubMed] [Google Scholar]
- 40.Story BH, Titze I. R. IR. Voice simulation with a body-cover model of the vocal folds. J. Acoust. Soc. Am. 1995;97(2):1249–1260. doi: 10.1121/1.412234. [DOI] [PubMed] [Google Scholar]
- 41.Tao C, Jiang JJ. The phonation critical condition in rectangular glottis with wide prephonatory gaps. J. Acoust. Soc. Am. 2008;123(3):1637–1641. doi: 10.1121/1.2832328. [DOI] [PubMed] [Google Scholar]
- 42.Tao C, Zhang Y, Hottinger DG, Jiang JJ. Asymmetric airflow and vibration induced by the coanda effect in a symmetric of the vocal folds. J. Acoust. Soc. Am. 2007;122(4):2270–2278. doi: 10.1121/1.2773960. [DOI] [PubMed] [Google Scholar]
- 43.Titze IR. The human vocal cords: A mathematical model part I. phonetica. 1973;28:129–170. doi: 10.1159/000259453. [DOI] [PubMed] [Google Scholar]
- 44.Triep M, Brucker Ch, Schroder W. High-speed PIV measurements of the flow downstream of a dynamic mechanical of the human vocal folds. Experiments in Fluids. 2005;39:232–245. [Google Scholar]
- 45.Von Doersten P, Izdebski K, Ross J, Cruz R. Ventricular dysphonia: a profile of 40 cases. Laryngoscope. 1992;102:1296–1301. doi: 10.1288/00005537-199211000-00018. [DOI] [PubMed] [Google Scholar]
- 46.White FM. Viscous Fluid Flow. 2nd ed. New York: McGraw-Hill, Inc; 1992. [Google Scholar]
- 47.Zemilin WR. Speech and hearing science anatomy and physiology. 3rd ed. Englewood Cliffs, NJ: Prentice hall; 1988. [Google Scholar]
- 48.Zhang Z, Neubauer J, Berry DA. Physical mechanisms of phonation onset: a linear stability analysis of an aeroelastic continuum model of phonation. J. Acoust. Soc. Am. 2007;Vol. 122(4):2279–2296. doi: 10.1121/1.2773949. [DOI] [PubMed] [Google Scholar]
- 49.Zhang C, Zhao W, Frankel SH, Mongeau L. Computational aeroacoustics of phonation, part II: effects of flow parameters and ventricular folds. J. Acoust. Soc. Am. 2002;112:2147–2154. doi: 10.1121/1.1506694. [DOI] [PubMed] [Google Scholar]
- 50.Zhao W, Zheng C, Frankel SH, Mongeau L. Computational aeroacoustics of phonation, part I: computational methods and sound generation mechanisms. J. Acoust. Soc. Am. 2002;112:2134–2146. doi: 10.1121/1.1506693. [DOI] [PubMed] [Google Scholar]


