Abstract
Cerenkov radiation is a well-known phenomenon, in which optical photons are emitted by charged particles moving faster than the speed of light in a medium. We have observed Cerenkov photons emitted from beta-emitting radiotracers such as 18F-fluorodeoxyglucose using a sensitive CCD camera. Phantom and in vivo mouse imaging experiments have demonstrated that surface measurements of the emitted Cerenkov optical photons could be used to reconstruct the radiotracer activity distribution inside an object by modeling the optical photon propagation with the diffusion equation and reconstructing the optical emission source distribution iteratively with a preconditioned conjugate gradient method (PCG). This is analogous to methods used for bioluminescence tomography. We refer to this as Cerenkov luminescence tomography (CLT), allowing the biodistribution of diagnostic and therapeutic beta-emitting radiolabeled agents to be imaged by detection and reconstruction of the optical Cerenkov signal.
Cerenkov radiation is produced when a charged particle (e.g. a β-particle produced by radioactive decay) travels in a medium with a velocity faster than the speed of light in that medium.[1-2] The particle induces coherent electromagnetic radiation with a continuous spectrum. This radiation can then propagate in the media and may be detectable at a distance. The number of emitted Cerenkov photons depends on the velocity, and therefore the energy of the particle. The speed of light in a particular material depends on the refractive index, and therefore Cerenkov light emission also increases in materials with higher refractive index. In water, which has a refractive index of 1.33, the threshold for the production of Cerenkov light for a β-particle is ~0.26 MeV. In tissue, where the index of refraction is more typically around 1.36-1.40 (the exact value depends on tissue type and to some extent on wavelength),[3] this threshold is reduced to ~0.21-0.24 MeV. The vast majority of β-emitting radionuclides used in biomedical applications, including all positron-emitting radionuclides, have end-point energies significantly higher than these thresholds and therefore produce Cerenkov light in tissues. The spectral distribution of the Cerenkov light is inversely proportional to the square of the wavelength.[1] Thus the peak of the emitted photon spectrum in the visible light range is at blue wavelengths. However, there are detectable photons even at longer wavelengths (700-900 nm) associated with good tissue penetration, and thus in vivo optical imaging of Cerenkov light in small animals is practical.[4]
In this letter, we propose a new imaging method, Cerenkov luminescence tomography (CLT), in which the distribution of radioactive tracers inside a small animal will be reconstructed from surface measurements of Cerenkov optical photons using an inverse algorithm. Optical photon propagation inside small animals is modeled with the diffusion equation. The model is described in detail elsewhere for fluorescence tomography.[5] For CLT, it is simplified in that there is no excitation source and thus the illumination intensity at each finite element node is the same. The imaging instruments and reconstruction methodology are therefore in principle the same as those used for bioluminescence optical tomography (BOT)[6]. The difference between CLT and BOT is just the source of the optical photons. CLT, like BOT, requires a very sensitive camera because the number of emitted photons per radioactive decay in the red and NIR range is relatively low. It should be noted that CLT does not compete with BOT, it is appropriate for the imaging of diagnostic and therapeutic radiopharmaceuticals, applications which are entirely distinct from reporter gene imaging using BOT.
In this letter, we use the radiotracer 2′-deoxy-2′-[18F]fluoro-D-deoxyglucose (FDG) that emits positrons from decaying 18F with an energy of up to 650 keV thus satisfying the Cerenkov threshold in water and tissues. For both phantom and in vivo studies, the Cerenkov optical luminescence was measured with a commercial optical imaging system (Caliper IVIS 100). Following optical imaging, a microPET scan (microPET II scanner) for validation of radiotracer distribution, and a microCT scan (Inveon, Siemens Preclinical Solutions) for anatomic reference, were also acquired. For PET imaging, the energy window was 150-650 keV and the coincidence timing window was 10 ns. A maximum a posteriori (MAP) algorithm was used for PET image reconstruction.[7] Reconstructed image resolution was approximately 1 mm. For the microCT scan, 180 projections were obtained (x-ray tube settings: 80 kVp, 0.2 mA) and reconstructed using the vendor-supplied filtered backprojection algorithm. The CT image (pixel size 0.2 mm) was used to generate the surface mesh for the animal studies.
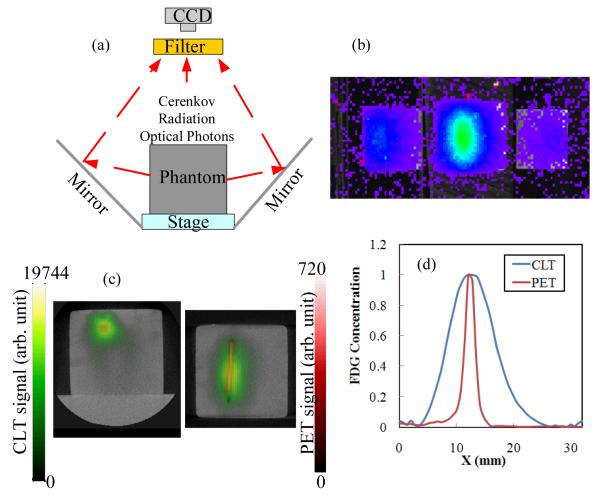
Phantom study: A transparent plastic capillary tube with an inner diameter of 1 mm and outer diameter of 1.5 mm was embedded 6.7 mm deep in a cubic phantom measuring 32×32×29 mm3. The phantom was composed of 1% intralipid, 2% agar, 20 μM bovine hemoglobin, 0.1% sodium azide, and 25 mM saline buffer mimicking the scattering and absorption properties of tissues. The phantom has an absorption coefficient of ~0.009 mm−1 and reduced scattering coefficient of ~0.86 mm−1 at the measurement wavelengths (range 695-770 nm).[5] The capillary tube contained a solution of FDG with an activity of 64.4 μCi at the time of imaging. The phantom was placed between two mirrors inside the optical imaging system, as shown in Fig. 1a. Using the two side mirrors, the CCD camera simultaneously captured images of the emitted photons from the top and two side surfaces as shown in Fig. 1b. The exposure time of the CCD camera was 5 minutes and a Cy5.5 filter selected collection of emission photons in the wavelength range 695-770 nm. This rejects short wavelength Cerenkov photons that derive from superficial locations, and collects photons in the NIR that have a reasonable probability of being detected from radioactive decays deep within the phantom. Subsequently microPET and microCT scans of the same phantom were obtained. For PET, the acquisition time was 10 minutes and the activity in the phantom at the time of imaging was 28.5 μCi.
Fig. 1.
(a) Experimental setup for phantom measurements; (b) Cerenkov luminescence measurement from phantom; (c) reconstructed CLT images of FDG concentration (green) fused with PET images (red) and CT images (grayscale) in transverse and coronal sections. (d) Horizontal profile across the target from the transverse section. Peak values are normalized to 1.
Images of the Cerenkov light measured at the surface of the phantom are shown in Fig. 1b. Optical photon propagation in the phantom was modeled by the diffusion equation, which was solved with a finite element method using a cubic mesh with 8690 nodes and 47581 tetrahedral elements. 1188 measurement points on the top and two side surfaces were extracted from Fig. 1b. In the system matrix, there are 8690 unknowns and 1188 measurements; the inverse problem, an ill-posed problem, was solved iteratively by a preconditioned conjugate gradient (PCG) method using Tikhonov regularization.[5] The FDG activity as reconstructed by CLT from the optical signals in Fig. 1b is shown in Fig. 1c (green) in transverse and coronal sections. The corresponding reconstructed microPET images are superimposed in red. Both CLT and PET images are fused with the structural microCT images to show the location of the detected signal with respect to the phantom boundaries. Figs. 1c demonstrates that CLT reconstructs the FDG activity in the correct location, albeit with lower spatial resolution as demonstrated by the increased blurring of the source. This is illustrated by a profile through the reconstructed images (Fig. 1d).
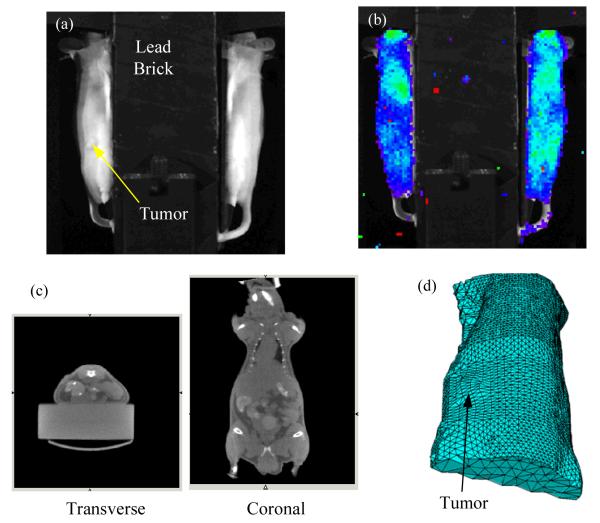
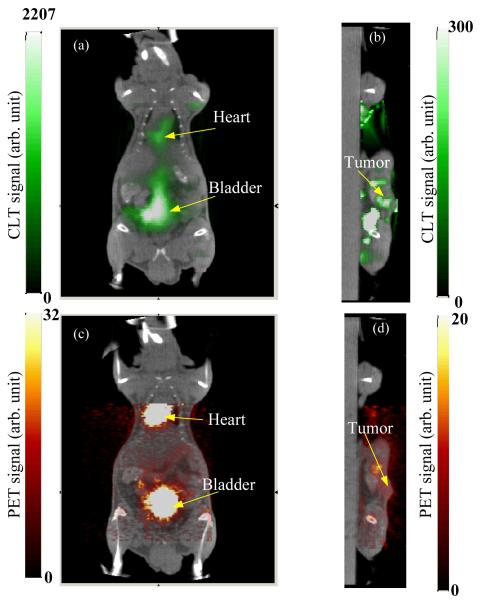
In vivo study: To demonstrate the feasibility of CLT imaging in vivo, a 34.7 g nude mouse with a xenograft tumor was scanned. About 3 million DX-3 (human melanoma) tumor cells were injected subcutaneously on the left dorsal flank. The tumor was allowed to grow for three weeks, reaching a size of approximately 7.5 mm. The mouse was injected intravenously with 352 μCi of FDG and placed between the two mirrors in the bioluminescence imaging system as shown in Fig. 2a. In this study, a 2-cm thick lead brick was placed above the mouse to prevent 511 keV annihilation photons from directly reaching the CCD camera and causing saturation of pixels. This was more of a problem in this study than the phantom study because of the higher activity used and the longer exposure time. Only the two side views of the mouse were imaged by the CCD camera and used in the CLT reconstruction (Fig. 2b). The emission filter was Cy5.5 and the CCD camera was exposed for 15 minutes. At the time of imaging, the total FDG activity was calculated to be 202 μCi. The mouse was also imaged by microPET (acquisition time 10 minutes, activity at time of imaging 110 μCi) and microCT. The microCT data (Fig. 2c) was used to extract the mouse surface for CLT image reconstruction. From the extracted mouse surface, a finite element mesh with 5776 nodes and 25411 tetrahedral elements was generated (Fig. 2d), based on which the diffusion equation was calculated to obtain the forward model of optical photon propagation in the mouse. To simplify the problem, we assumed that the optical properties inside the mouse were homogeneous and uniform. 945 measurements from the two side surfaces (Fig. 2b) were extracted. Using Tikhonov regularization, the ill-posed inverse problem was solved iteratively with the PCG method. The reconstructed CLT images, along with the microPET images are shown in Fig. 3. The CLT, PET and CT images are fused by manual coregisteration of the mouse surface. The distribution of FDG as reconstructed by CLT agrees well with the true radiotracer distribution as assessed by PET. High concentrations of FDG are seen in the heart and bladder. The tumor shows slightly elevated FDG uptake in both PET and CLT images, with good co-localization of the signal. Total FDG activities are estimated from the calibrated PET images to be approximately 56 μCi (bladder), 22 μCi (heart) and 0.8 μCi, (tumor).
Fig. 2.
(a) Experimental setup for in vivo measurement; (b) Cerenkov luminescence measurements from two side views; (c) microCT images in transverse and coronal sections; (d) finite element mesh derived from microCT imaging for use in CLT reconstruction.
Fig. 3.
Reconstructed Cerenkov luminescence tomography images fused with microCT images: (a) coronal cross section showing bladder and heart, and (b) sagittal cross section at tumor. (c, d) Corresponding fused microPET/CT images.
While the CLT images are in reasonable concordance with the PET images, the spatial resolution, due to light scattering, is much lower than that of PET. One also observes artifacts in the CLT images as shown in Fig 3b. There are several factors that contribute to these artifacts, including the low number of measurements due to the top view of the animal being blocked, inaccuracy in photon propagation modeling due to assumptions of homogeneity, and lack of spectral information in the collected data. A future design with narrower bandwidth and multispectral measurements will help remove artifacts in the reconstructed CLT images, although narrower bandwidth filters will also reduce the number of Cerenkov photons that are detected. Larger numbers of measurements can be obtained by using shielding and mirrors to allow the top and bottom surfaces of the animal to be viewed as well while eliminating direct line of sight from the subject to the CCD camera and thus interference due to direct gamma ray interactions in the CCD.
PET is a mature technology for imaging of β+ emitters such as 18F in small animals. However, a PET scanner may not always be available, while bioluminescence systems are very widely distributed. CLT provides a possible method to image PET radiotracers with a simple optical imaging system designed for bioluminescence studies. Furthermore, CLT can be utilized for imaging therapeutic β− emitters such as 90Y that are being used for radioimmunotherapy. Currently, there are no sensitive techniques for imaging β−-emitting radionuclides unless they also produce gamma rays during decay.
It is worth noting that CLT, BOT and fluorescence optical tomography (FOT)[5] are all model based optical imaging methods and suffer low spatial resolution due to optical diffusion characteristics and the ill-posed inverse problem. CLT does not address any of these challenges, however provides a pathway to image diagnostic and therapeutic beta-emitting radiolabeled agents on widely available optical imaging platforms, thus increasing the range of applications for which optical imaging techniques can be applied.
In summary, we have demonstrated the ability to reconstruct the distribution of β-emitting radionuclides such as 18F using the optical photons produced via the Cerenkov effect. A proof of principle in vivo study demonstrates that sufficient signal at the surface of a mouse can be detected for reasonable radiotracer doses and acquisition times, and that tomographic images of the radiotracer distribution can be reconstructed from these surface measurements using inverse methods.
Acknowledgements
This work was supported by NIH grants R01 CA121783 and U24 CA110804. The authors thank the staff of the Center for Molecular and Genomic Imaging for assistance with animal studies, and Dr. David Boucher, Dr. Julie Sutcliffe and Dr. Sven Hausner for assistance with the xenograft model.
REFERENCES
- 1.Jelley JV. Cerenkov Radiation and Its Applications. Brit J Appl Phys. 1955;6:227–232. [Google Scholar]
- 2.L’Annunciata MF. Handbook of Radioactivity Analysis. Academic Press; San Diego: 2003. [Google Scholar]
- 3.Vo-Dinh T. biomedical Photonics Handbook. CRC Press; Boca Raton, FL: 2003. [Google Scholar]
- 4.Robertson R, Germanos MS, Li CQ, Mitchell GS, Cherry SR, Silva MD. Optical imaging of Cerenkov light generation from positron-emitting radiotracers. Phys Med Biol. 2009;54:N355–N365. doi: 10.1088/0031-9155/54/16/N01. [DOI] [PMC free article] [PubMed] [Google Scholar]
- 5.Li CQ, Mitchell GS, Dutta J, Ahn S, Leahy RM, Cherry SR. A three-dimensional multispectral fluorescence optical tomography imaging system for small animals based on a conical mirror design. Opt Express. 2009;17:7571–7585. doi: 10.1364/oe.17.007571. [DOI] [PMC free article] [PubMed] [Google Scholar]
- 6.Chaudhari AJ, Darvas F, Bading JR, Moats RA, Conti PS, Smith DJ, Cherry SR, Leahy RM. Hyperspectral and multispectral bioluminescence optical tomography for small animal imaging. Phys Med Biol. 2005;50:5421–5441. doi: 10.1088/0031-9155/50/23/001. [DOI] [PubMed] [Google Scholar]
- 7.Qi JY, Leahy RM, Cherry SR, Chatziioannou A, Farquhar TH. High-resolution 3D Bayesian image reconstruction using the microPET small-animal scanner. Phys Med Biol. 1998;43:1001–1013. doi: 10.1088/0031-9155/43/4/027. [DOI] [PubMed] [Google Scholar]


