Abstract
Effective imaging of cancer molecular biomarker is critical for accurate cancer diagnosis and prognosis. CLT1 peptide was observed to specifically bind to the fibrin-fibronectin complexes presented in tumor extracellular matrix. In this study, we synthesized and evaluated CLT1 peptide-targeted nanoglobular Gd-DOTA monoamide conjugates for magnetic resonance (MR) imaging of the fibrin-fibronectin complexes in tumor. The targeted nanoglobular contrast agents were prepared by conjugating peptide CLT1 to G2 and G3 nanoglobule (lysine dendrimers with a cubic silsesquioxane core) Gd-DOTA monoamide conjugates via click chemistry. The T1 relaxivities of peptide targeted G2 and G3 nanoglobules were 7.92 and 8.20 mM−1s−1 at 3T, respectively. Approximately 2 peptides and 25 Gd-DOTA chelates were conjugated onto the surface of 32 amine groups of G2 nanoglobule, and 3 peptides and 43 Gd-DOTA chelates onto the surface of 64 amine groups of G3 nanoglobule. The peptide-targeted nanoglobular contrast agents showed greater contrast enhancement than the corresponding non-targeted agents in tumor at a dose of 0.03 mmol/kg in female athymic mice bearing MDA-MB-231 human breast carcinoma xenografts. The targeted MRI contrast agents have a potential for specific cancer molecular imaging with MRI.
Keywords: molecular imaging, magnetic resonance imaging, gadolinium, peptide-targeted, nanoglobule
1. Introduction
Magnetic resonance imaging (MRI) is one of the powerful imaging modalities for visualizing the anatomic structure and function of the body. However, MRI is not effective for molecular imaging because of its low sensitivity. Currently available clinical contrast agents are mostly small molecular Gd(III) chelates that enhance image contrast by shortening the relaxation times of the surrounding water protons1,2. These agents are mostly nonspecific extracellular contrast agents and not suitable for target-specific molecular imaging in both clinical and preclinical settings.3–5 There have been continuous efforts in the development of targeted contrast agents for more accurate diagnostic imaging.3,6–9 Various targeted contrast agents have been reported by conjugating Gd(III) chelates to the targeting moieties, including monoclonal antibodies and peptides, specific to the biomarkers expressed on cancer cell surface. However, these agents could not generate sufficient contrast enhancement for visualizing these biomarkers with MRI because their concentrations are below the sensitivity of contrast enhanced MRI.
The extracellular matrix in solid tumors has been increasingly recognized as a unique microenvironment that plays an important role in tumor proliferation and metastasis.10,11 Some of the tumor associated components in the extracellular matrix, including tenascins, proteoglycans, glycosaminoglycans, laminin and fibronectins, have been used as molecular targets for developing therapeutics and diagnostics.12 Oncofetal fibronectins are found abundantly present in the extracellular matrix of a spectrum of malignant human tumors, but not in normal human tissues except in female reproductive system. They form insoluble extracellular matrix via complexation with other extracellular matrix components, including collagen and fibrin. Oncofetal fibronectins in tumor stroma maintain cell morphology, facilitate cell adhesion, growth, migration and differentiation, and promote angiogenesis and oncogenic transformation. Clinical studies have shown that the strong presence of the oncofetal fibronectin is associated to intermediary and high tumor malignancy with a poor prognosis, while benign tumors have no or low presence of oncofetal fibronectin.13–15 Due to their abundance in malignant tumors, oncofetal fibronectins are suitable molecular targets for MR molecular imaging in cancer diagnosis and prognosis.
Recently, we have reported a cyclic decapeptide CGLIIQKNEC (CLT1) targeted MRI contrast agent CLT1-(Gd-DTPA) for cancer molecular imaging with contrast enhanced MRI.16 The CLT1 peptide specifically binds to the fribronectin-fibrin complexes in the extracellular matrix of different tumors with little binding to normal tissues.17 The targeted contrast agent resulted in more significant tumor enhancement than a non-targeted control agent at a clinical dose in an animal tumor model. Here, we use recently developed nanoglobules as carriers to design targeted contrast agents to increase the molar ratio of Gd(III) chelate to CLT1 peptide and to improve the targeting efficiency. Nanoglobules are a new class of lysine dendrimers with a cubic silsesquioxane core. The nanoglobules have a compact globular morphology and high functionality for conjugation, suitable for preparation of targeted contrast agents with high peptide to Gd(III) chelate ratios.
In this study, CLT1 peptide targeted nanoglobular contrast agents were synthesized by conjugating Gd-DOTA and the peptide on the surface of the generation 2 and 3 nanoglobules. Tumor specific contrast enhancement of the targeted contrast agents was investigated in female nude mice bearing MDA-MB-231 human breast cancer xenografts with corresponding non-targeted contrast agents as controls. The presence of fibronectin in tumor extracellular matrix was confirmed with immunohistochemistry. The biodistribution of the contrast agents was evaluated in the mice at 48 hours after administration.
2. Materials and Methods
All reagents were used without further purification unless otherwise stated. 2-(1H-Benzotriazol-1-yl)-1,1,3,3-tetramethyluronium hexafluorophosphate (HBTU), benzotriazol-1-yl-oxytripyrrolidinophosphonium hexafluorophosphate (PyBOP) and 1-hydroxybenzotriazole hydrate (HOBt) were purchased from Nova Biochem (Darmstadt, Germany). 1,4,7,10-Tetraazacyclododecane-1,4,7-tris-tert-butyl acetate-10-acetic acid [DOTA-tris(t-Bu)] was purchased from Macrocyclics (Dallas, TX). 3-[(2-Azido-ethylenoxy)-heptoa(2-ethylenoxy)]-propionic N-hydroxysuccinimide ester (Azido-dPEG NHS) and 3-propargyloxy-propionic N-hydroxysuccinimide ester (propargyl-PEG-NHS) were purchased from Quanta BioDesign (Powell, OH). All of the Fmoc protected amino acids and Fmoc-12-amino-4,7,10-trioxadodecanoic acid (Fmoc-NH-(PEG)2-COOH) were purchased from EMD Chemicals Inc. (Gibbstown, New Jersey). Anhydrous N,N-diisopropylethyl amine (DIPEA) and N,N-dimethylformamide (DMF) were purchased from Alfa Aesar (Ward Hill, MA). Trifluoroacetic acid (TFA) was purchased from ACROS Organics (Morris Plains, NJ).
The nanoglobular products were purified by ultrafiltration using Millipore’s Amicon® Ultra-15 centrifugal filters (3 kDa molecular weight cutoff) or by high performance liquid chromatography (HPLC) on an Agilent 1100 HPLC system equipped with a ZORBAX 300SB-C18 PrepHT column. The gradient of HPLC was 0–50% solvent B (0.05% TFA in acetonitrile) in solvent A (0.05% TFA aqueous solution) for 30 min and 50–100% solvent B in solvent A for 5 min. The Gd(III) content was measured by inductively coupled plasma-optical emission spectroscopy (ICP-OES Optima 3100XL, Perkin Elmer, Norwalk, CT). Matrix-assisted laser desorption/ionization time of flight (MALDI-TOF) mass spectra were acquired on a Voyager DE-STR spectrometer (PerSpeptive BioSystems) in linear mode with α-cyano-4-hydroxycinnamic acid as a matrix. Amino acid analysis was performed using the Hitachi L-8800 Amino Acid Analyzer (Tokyo, Japan). The size of the contrast agents was measured by dynamic laser light scattering after they were further purified using 0.1 μm Millipore filters before the measurement. A modified LLS spectrometer (ALV/DLS/SLS-5022F) equipped with a multi-τ digital time correlator (ALV5000) and a cylindrical 22 mW He-Ne laser (λ=632.8 nm, Uniphase) as the light source was used.
2.1. Synthesis of G2 nanoglobule-(PEG-azido)2 conjugate
Generations 2 (G2) nanoglobule, polylysine dendrimers with an octa(3-aminopropyl)silsesquioxane core, were synthesized as previously described.18 G2 nanoglobule, (L-lysine)16-(L-lysine)8-octa(3-aminopropyl)silsesquioxane(OAS) trifluoroacetate (90 mg, 11.8 μmol), azido-dPEG NHS (20 mg, 35.4 μmol), HBTU (13.4 mg, 35.4 μmol), HOBt (5 mg, 35.4 μmol) and an excess of DIPEA were dissolved in 2 mL of N,N -dimethylformamide anhydrous (DMF) and stirred at room temperature overnight. The product was precipitated by adding anhydrous diethyl ether into reaction solution. The dried precipitate was further purified with HPLC. Yield of G2 nanoglobule-PEG-azido conjugate was 40 mg, 69%. MALDI-TOF (m/z, [M+H]+): 4,891.10 (measured), 4,855.04 (calculated for G2 with 2 azido groups on average).
2.2. Synthesis of G2 nanoglobule-(Gd-DOTA)25-(PEG-azido)2 conjugate
G2 nanoglobule-(PEG-azido)2 conjugate (19 mg, 3.77 μmol), DOTA-tris(t-Bu) (138 mg, 241 μmol), HBTU (91 mg, 241 μmol), HOBt (33 mg, 241 μmol) and DIPEA (1.5 mL) were dissolved in DMF (3 mL) and stirred at room temperature for 24 h. After reaction, the product was added to anhydrous diethyl ether. The oil-like precipitate was washed several times with diethyl ether and the t-butyl groups were removed by dissolving the precipitate in a mixture of TFA and dichloromethane (5 mL, volume/volume = 1:1) for 24 h while stirring at room temperature. The residue was treated with ice-cold diethyl ether to give a white solid precipitate. The dried precipitate was dissolved in pure water and further purified by ultrafiltration. Yield of G2 nanoglobule-(DOTA)25-(PEG-azido)2 conjugate was 38 mg, 70%. MALDI-TOF (m/z, [M+H]+): 14,525 (measured), 14,531 [calculated for G2 nanoglobule-(DOTA)25-(PEG-azido)2].
G2 nanoglobule-(DOTA)25-(PEG-azido)2 (38 mg, 2.62 μmol) in 1.0 mL deionized water was mixed with Gd(OAc)3 (126 mg, 273 μmol) and stirred at room temperature for 2 days. The excess free Gd3+ ions were removed from the solution by adding EDTA and eluting through a PD-10 desalting column with deionized water. The product G2 nanoglobule-(Gd-DOTA)25-(azido-PEG)2 was further purified by dialysis with a membrane with a molecule weight cutoff of 1000 Da at room temperature for 96 h. Yield of G2 nanoglobule-(Gd-DOTA)25-(PEG-azido)2 was 31 mg, 63.8%.
2.3. Synthesis of peptide-PEG-propargyl conjugate
Peptide CLT1 (CGLIIQKNEC) was synthesized using standard solid-phase peptide synthesis from Fmoc-protected amino acids on a 2-chlorotrityl chloride resin. At the end of the peptide synthesis, an excess of Fmoc-NH-(PEG)2-COOH (115 mg, 260 μmol) in DMF was reacted with the peptide (82 μmol) on the beads at room temperature for 1 h. The protective group, Fmoc, was removed by reacting with piperidine in DMF. Then propargyl-PEG-NHS ester (58 mg, 260 μmol), HOBt (35 mg, 260 μmol), benzotriazol-1-yl-oxytripyrrolidinophosphonium hexafluorophosphate (PyBop, 135 mg, 260 μmol) and DIPEA were dissolved in 2 mL DMF and reacted with the PEG-peptide on the beads at room temperature for 1 h to conjugate propargyl group at the N-terminal of the peptide. The resin was completely washed with water, DMF, dichloromethane, and methanol three times each. The peptide-PEG-propargyl conjugate was then removed from the resin using TFA solution (TFA 94%, 1,2-ethanedithiol 2.5%, triisobutylsilane 2.5%, water 1.0%). The product was exposed to air to allow the formation of disulfide bonds for the cyclic peptide and then purified using preparative HPLC with a C18 column. Yield of peptide-PEG-propargyl conjugate was 32 mg, 27.8%. MALDI-TOF (m/z, [M+H]+): 1,431.67 (observed), 1,431.67 (calculated).
2.4. Preparation of CLT1 peptide targeted G2 nanoglobular Gd-DOTA monoamide conjugate
CLT1 peptide was conjugated to G2 nanoglobule-(Gd-DOTA)25-(PEG-azido)2 conjugate via “click chemistry” between the reactive propargyl group of the peptide conjugate and azido group of the nanoglobule-(Gd-DOTA)25-(PEG-azido)2 conjugate. G2 nanoglobule-(Gd-DOTA)25-(PEG-azido)2 conjugate (31 mg, 1.68 μmol) and ascorbic acid (6 μmol) were dissolved in 2 mL water, followed by the addition of copper(II) sulfate pentahydrate (4 μmol). Then peptide-PEG-propargyl conjugate (36 mg, 25.2 μmol) in 3 mL of tert-butyl alcohol was added to above solution and the reaction was stirred vigorously for 24 h at room temperature. The precipitate was removed by filtration. The product was purified by ultrafiltration and then by dialysis (molecule weight cutoff = 1000 Da) at room temperature to remove any small molecular impurities. Yield of the CLT1 targeted G2 nanoglobular Gd-DOTA monoamide conjugate was 18 mg, 46%. The Gd(III) content was measured by inductively coupled plasma optical emission spectroscopy (ICP-OES, Optima 3100XL, Perkin-Elmer). There were two peptides in each conjugate as determined by amino acid analysis and estimated from sulfur content determined by ICP-OES.
2.5. Synthesis of G2 nanoglobule-(Gd-DOTA)29 conjugate
The G2 nanoglobule (45 mg, 5.91 μmol), DOTA-tris(t-Bu) (216 mg, 378 μmol), HBTU (143 mg, 378 μmol), HOBt (51 mg, 378 μmol) and DIPEA (1.5 mL) following the general procedure of section 2.2 gave the product of G2 nanoglobule-(DOTA)29 as a solid powder (62 mg, 64%). MALDI-TOF (m/z, [M+H]+): 14,936 (observed), 15,151 (calculated for G2 nanoglobule-(DOTA)29). The 62 mg of G2 nanoglobule-(DOTA)29 conjugate with 4-fold excess Gd(OAc)3 following the procedure of section 2.2 gave the product of G2 nanoglobule-(Gd-DOTA)29 as a white solid (48 mg, 60%). The Gd(III) content measured by ICP-OES was shown in Table 1.
Table 1.
Physicochemical parameters of the targeted and non-targeted nanoglobular MRI contrast agents
| Name | Gd3+ Content (mmol Gd/g polymer) | No. of Gd-DOTA monoamide chelates (%) | r1/r2 [mM−1(Gd)s−1] B0=3T | r1/r2 [mM−1(nanoglobule)s−1) B0=3T | No. of Surface Peptide | Particles size (nm) |
|---|---|---|---|---|---|---|
| G2-Gd(III) | 1.15 | (29/32; 90%) | 7.22/12.75 | 209.38/369.75 | 0 | ~5.2 |
| G3-Gd(III) | 1.20 | (57/64; 89%) | 8.03/16.40 | 457.71/934.80 | 0 | ~5.8 |
| P-G2-Gd(III) | 1.18 | (25/30; 83%) | 7.92/10.34 | 198.00/258.50 | (2/32; 6.3%) | ~5.6 |
| P-G3-Gd(III) | 1.02 | (43/61; 70%) | 8.20/16.10 | 352.60/692.3 | (3/64; 4.7%) | ~6.2 |
Temperature of relaxivity measurements is 25 °C
2.6. Synthesis of G3 nanoglobule-(PEG-azido)3 conjugate
G3 nanoglobules were synthesized as previously described.18 G3 nanoglobule, (L-lysine)32-(L-Lysine)16-(L-Lysine)8-octa(3-aminopropyl)silsesquioxane trifluoroacetate (107 mg, 7 μmol), azido-dPEG NHS (23.6 mg, 42 μmol), HBTU (16 mg, 42 μmol), HOBt (6 mg, 42 μmol) with DIPEA were reacted according to the procedure of section 2.1 to give the product of G3 nanoglobule-PEG-azido conjugate as a white solid (98 mg, 83%). MALDI-TOF (m/z, [M+H]+): 9,481.8 (observed), 9,407.6 (calculated for G3 with 3 azido-PEG).
2.7. Synthesis of G3 nanoglobule-(Gd-DOTA)43-(PEG-azido)3 conjugate
G3 nanoglobule-(PEG-azido)3 conjugate (32 mg, 3.37 μmol), DOTA-tris(t-Bu) (232 mg, 404 μmol), HBTU (153 mg, 404 μmol), HOBt (55 mg, 404 μmol) with DIPEA were reacted according to the procedure of section 2.2 to give the product of G3 nanoglobule-(DOTA)43-(PEG-azido)3 conjugate as a white solid (52 mg, 60%). MALDI-TOF (m/z, [M+H]+): 26,189 (observed), 26,013 (calculated for G3-(DOTA)43-(PEG-azido)3). The complexation of G3 nanoglobule-(DOTA)43-(PEG-azido)3 (52 mg, 2.0 μmol ) with 4-fold excess of Gd(OAc)3 following the procedure of section 2.2 gave G3 nanoglobule-(Gd-DOTA)43-(PEG-azido)3 as a white solid (34 mg, 53%).
2.8. Preparation of CLT1 peptide targeted G3 nanoglobular Gd-DOTA monoamide conjugate
G3 nanoglobule-(Gd-DOTA)43-(PEG-azido)3 conjugate (29 mg, 0.9 μmol) with peptide-PEG-propargyl conjugate (12 mg, 8.1 μmol) were reacted according to the procedure of section 2.3 to give CLT1 peptide targeted G3 nanoglobular Gd-DOTA monoamide conjugate (26 mg, 78%). The Gd(III) content measured by ICP-OES was shown in Table 1. There were 3 peptides in each conjugate as determined by amino acid analysis and estimated from sulfur content determined by ICP-OES.
2.9. Synthesis of G3 nanoglobule-(Gd-DOTA)57 conjugate
G3 nanoglobule (35 mg, 2.28 μmol), DOTA-tris(t-Bu) (167 mg, 291 μmol), HBTU (111 mg, 291 μmol), HOBt (39 mg, 291 μmol) with DIPEA were reacted according to the procedure of section 2.2 to give the product of G3 nanoglobule-(Gd-DOTA)57 conjugate (50mg, 74%). MALDI-TOF (m/z, [M+H]+): 30,061 (calculated for G3 nanoglobule-(Gd-DOTA)57); 30167 (observed). The complexation of G3 nanoglobule-(DOTA)57 conjugate (50 mg, 1.68 μmol) with 4-fold excess Gd(OAc)3 gave G3 nanoglobule-(Gd-DOTA)57 as a white solid (29 mg, 45%). The Gd(III) content measured by ICP-OES was shown in Table 1.
2.10. Measurement of T1 and T2 relaxivities of the contrast agents
Longitudinal relaxation times (T1) of the aqueous solutions of the contrast agents of five different concentrations and water were measured on a Siemens 3T MRI scanner at room temperature using an inversion recovery prepared turbo spin echo imaging pulse sequence. The inversion times (TI) were 25, 35, 50, 75, 100, 200, 400, 800, 1600, and 3200 ms with repetition time (TR) = 5000 ms and echo time (TE) = 16.0 ms. The net magnetization from the region of interest of each sample was fit using a Marquardt-Levenberg algorithm for multiparametric nonlinear regression analysis using a MATLAB program. T1 and M0 were calculated from these data and longitudinal relaxivity r1 was determined from the slope of 1/T1 versus [Gd3+] plot. Transverse relaxation times (T2) of the samples were measured using a turbo spin echo sequence with turbo factor 3. The parameters were as follows: TE = 12, 24, 35, 47, 59, 71, 83, 94 and 106 ms; TR = 3000 ms. T2 value for a given concentration was calculated from MTE = M0e(−TE/T2) after non-linear regression with various TE. Transverse relaxivity r2 was determined from the slope of 1/T2 versus [Gd3+] plot. The Gd(III) concentration (mM) was measured by ICP-OES for r1 and r2 calculation.
2.11. Animal Tumor Model
Animal study was performed according to a protocol approved by the Institutional Animal Care and Use Committee of the University of Utah. Female athymic nu/nu mice (4–6 weeks old) weighted 18–22 g were purchased from the National Cancer Institute (Frederick, MD). The mice were subcutaneously implanted in the both flanks with 2 × 10⁶ MDA-MB-231 cells in a mixture of 50 μL culture medium and 50 μL Matrigel. The MRI study was performed when the tumor size reached 0.5–1.0 cm in diameter in 3~4 weeks.
2.12. Contrast Enhanced MRI
Tumor-bearing mice were anesthetized with an intraperitoneal injection of a mixture of 12 mg/kg xylazine and 80 mg/kg ketamine. MRI contrast agents were administered via a tail vein at a dose of 0.03 mmol-Gd/kg. The anesthetized mice were placed on a heating pad all the time before the MRI study and then wrapped in a warm towel to maintain body temperature during MRI scanning. The mice were placed in a home made mouse coil and scanned on a Siemens Trio 3T MRI scanner before and at 2, 5, 10, 15, 20 and 25 min after injection using a fat saturation 3D FLASH sequence (TR=7.8 ms, TE=2.74 ms, 25° flip angle, 0.4 mm slice thickness). Axial tumor MR images were also acquired using a 2D spin-echo sequence (TR=400 ms, TE=8.9 ms, 90° flip angle, 2.0 mm slice thickness). Signal intensity was measured and analyzed using Osirix software. Contrast to noise ratios (CNR) were calculated at each time point and averaged from different mice (N=3) for the organ/tissue. The CNR in the tumor was calculated using the following equation: , where St and Sm denote the signal in tumor and thigh muscle and σn is the standard deviation of noise estimated from the background air. The CNR in the blood was calculated using the same equation, where St (post-injection) and Sm (pre-injection) denote the signal in the regions of interest (ROI). The P values were calculated using the student’s two-tailed t test, assuming statistical significance at p < 0.05.
2.13. Immunohistochemical Study
Mice were sacrificed 24 h postinjection, and MDA-MB-231 tumor tissues were removed and fixed with 3% paraformaldehyde and embedded in paraffin. Immunohistochemistry was performed according to suppliers’ protocol (Santa Cruz Biotech., rabbit ABC staining system: cat#sc-2018). Briefly, tissue sections (4 μm thickness) were incubated in 3% hydrogen peroxide, 10% methanol for 10 min at room temperature to block endogenous peroxidase activity. The slides were boiled in antigen retrieval solution (1 mmol/L Tris-HCl, 0.1 mmol/L EDTA, pH=8.0) for 15 minutes at high power in a microwave. The sections were then incubated with primary anti-fibronectin antibody (Sigma-Aldrich, cat#F3648) at appropriate dilutions overnight. After washing with phosphate-buffered saline solution, the sections were incubated with biotinylated secondary antibody and a horseradish peroxidase-streptavidin complex for 1 h each. Tissue samples then were colorized with 3, 3′ diaminobenzidine (DAB) substrate, counterstained, mounted, and visualized with a bright-field microscope.
2.14. Biodistribution Study
The mice from the MRI study were sacrificed by cervical dislocation at 48 hours postinjection. The femur, heart, kidneys, liver, spleen, lungs, muscle, skin, and tumors were dissected, weighted, lyophilized and dissolved in concentrated ultrapure nitric acid. Each solution was diluted to 10 mg tissue/mL and the Gd concentration was determined using ICP-OES. The Gd content in different organ/tissues was calculated as the percentage of injected dose per gram of organ/tissues (% ID/g).
3. Results and Discussion
3.1. Synthesis and characterization
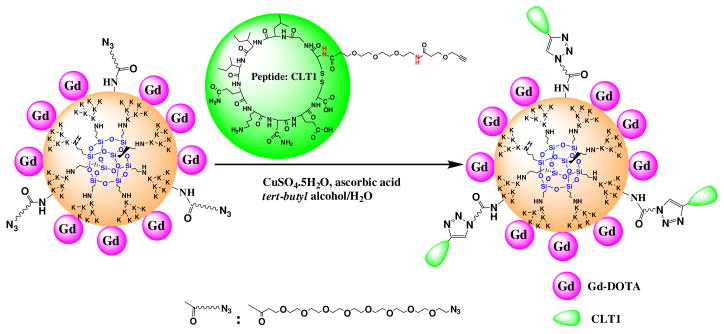
The peptide targeted nanoglobular contrast agents were synthesized by stepwise conjugation of the Gd-DOTA and CLT1 peptide on the surface of nanoglobules, Scheme 1. Azido groups were first introduced to the nanoglobules by reacting their surface amino groups with azido-dPEG NHS active ester. Gd-DOTA was then conjugated by reacting the product with 100% excess of DOTA-tris(t-Bu) in the presence of coupling agents, followed by deprotection and complexation with Gd(OAc)3. The G2 and G3 nanoglobular Gd-DOTA monoamide conjugates without azido groups were prepared as the non-targeted control agents. One fold excess of DOTA-tris(t-Bu) was used to achieve high conjugation of Gd-DOTA on the surface of the nanoglobules. Approximately 70–83% of the surface amine groups of the azido-nanoglobules and 90% of the surface amine groups of the nanoglobules (non-targeted) were conjugated with Gd-DOTA-monoamide under the reaction condition. The relatively low conjugation for the azido-nanoglobules was possibly due to the steric hindrance of the spacer for the azido group. The conjugation efficiency of non-targeted nanoglobules was higher than that in our previous work18 because a larger excess of DOTA-tris(t-Bu) was used. Higher conjugation degree could be archived on the nanoglobular surface by further increasing the amount of DOTA-tris(t-Bu) in the conjugation.19,20 MALDI-TOF mass spectra showed the nanoglobular conjugates had a broader molecular weight distribution than the corresponding free nanoglobules, possibly due to different conjugation degrees. Therefore, the measured masses of the conjugates were slightly different from their calculated masses.
Scheme 1.
Synthetic illustration of peptide CLT1-targeted nanoglobular contrast agents
CLT1 peptide with a propargyl group at the N-terminus was prepared with standard solid phase peptide synthesis. Peptide targeted nanoglobular contrast agents were synthesized by incorporating CLT1 peptide to nanoglobular azido and Gd-DOTA conjugate via click chemistry. Click chemistry was a convenient and selective approach for chemical conjugation.21 No protecting groups were required for click chemistry before the conjugation of the peptide onto the nanoglobular surface. Steric hindrance due to the close proximity of the targeting moieties to the nanoglobules might inhibit the effective binding of the targeting groups to their binding sites. Therefore, a short PEG linker was used between the peptide and contrast agent to circumvent this problem. Complexation of the nanoglobular DOTA monoamide conjugate with Gd(III) was performed before the peptide conjugation because the ligand could complex with Cu(II), a catalyst for click chemistry. A large excess of Gd(OAc)3 and long reaction time (2 days) were used to ensure complete chelation of DOTA on the surface of nanoglobular agents. No Cu(II) ions were detected by ICP-OES in the targeted contrast agents, indicating complete chelation of DOTA with Gd(III). Approximately 2 and 3 peptides on average were conjugated to G2 and G3 nanoglobular contrast agents, respectively, as determined by amino acid analysis and the sulfur content measured by ICP-OES.
The physicochemical parameters of the contrast agents are listed in Table 1. The relaxivities r1 and r2 of the nanoglobular contrast agents increased with increasing sizes. The T1 relaxivities of targeted agents was slightly higher than that of the corresponding non-targeted agents, much higher than that of CLT1-(Gd-DTPA) (T1 relaxivity = 4.22 mM−1s−1) under the same condition.16 The relaxivities of the nanoglobular contrast agents were similar to those of other reported dendrimeric Gd-DOTA-monoamide conjugates.22,23 Dynamic light scattering analysis showed that the nanoglobular contrast agents had a particle size in the range of 5.2~6.2 nm, smaller than the renal filtration threshold (ca. 8.0 nm).24 The optimal size of targeted MRI agents would be the size that allows extravasation within leaky tumor blood vessels, but not in normal vasculature,25 and allows rapid excretion after the MRI examinations.
3.2 In Vivo MR Imaging
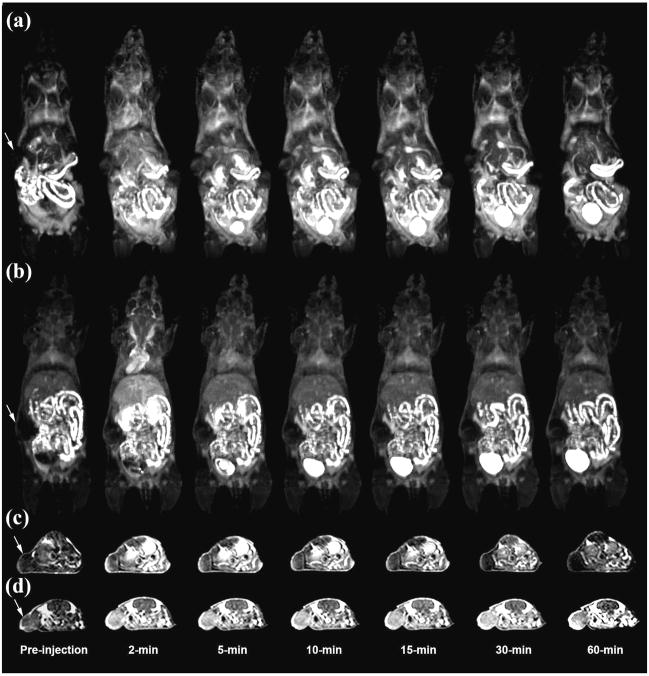
Figure 1 shows the T1-weighted 3D maximum intensity projection images and 2D axial images of mice before and after the injection of G2 and peptide targeted G2 nanoglobular agents. Strong contrast enhancement was observed in the urinary bladder 5 minutes after the injection of both agents, indicating that the unbound targeted G2 nanoglobular contrast agent could be readily excreted via renal filtration. Targeted G2 nanoglobular agent resulted in stronger contrast enhancement than the non-targeted agent in the heart and vasculature due to slight size increase by the presence of peptide moieties. The targeted G2 nanoglobular contrast agent resulted in greater enhancement within tumor tissues than the corresponding non-targeted agent as shown in T1-weighted 2D axial spin-echo images. Significant tumor enhancement was observed for the non-targeted agent in first 10 minutes and the enhancement was then gradually reduced over time. In comparison, the targeted contrast agent resulted in strong prolonged enhancement in tumor tissue for at least 60 minutes post-injection, indicating binding of the targeted agent in the tumor tissue. The enhancement of the non-targeted agent is mainly in the tumor periphery, while the targeted agent resulted in more uniform enhancement cross the tumor tissue.
Figure 1.
3D maximum intensity projection images for G2 (a) and CLT1 peptide targeted G2 (b), 2D axial T1-weighted spin-echo images of tumor tissue of the G2 (c) and peptide targeted G2 (d) nanoglobular MRI contrast agents intravenously administered at 0.03 mmol-Gd/kg in nu/nu female nude mice bearing MDA MB-231 tumor xenografts. Arrows indicate tumor.
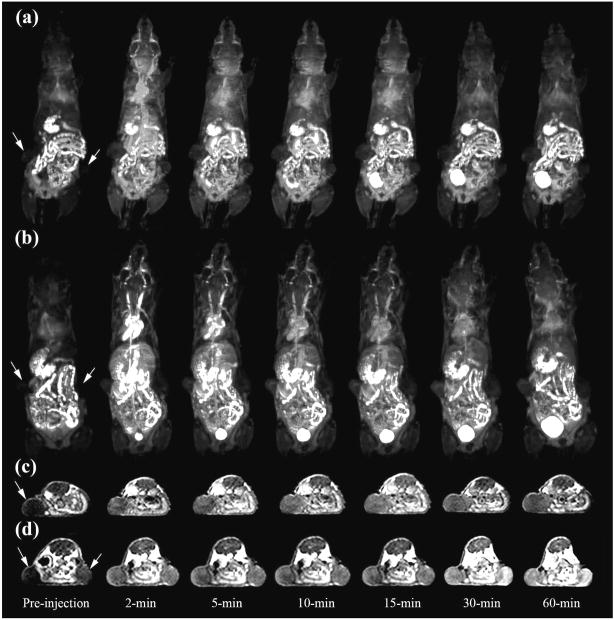
The G3 nanoglobular contrast agents had larger sizes than the G2 agents and resulted in more prolonged enhancement in the heart and vasculature, as shown in the dynamic 3D images (Figure 2). The targeted G3 nanoglobular agent had a larger size and three more peptide molecules than the non-targeted G3 agent and resulted in stronger and more prolonged cardiovascular enhancement. The targeted G3 nanoglobular agent also resulted in greater enhancement in the heart and vasculature than the targeted G2 agent, possibly due to the difference in size and number of CLT1 peptides. Strong bladder enhancement was also observed for both G3 agents, indicating the excretion of the agents via renal filtration. It has been reported that molecules with a hydrodynamic size < 6 nm could freely filter through the glomerular capillary and those > 8 nm could not be readily excreted through glomerular filtration.24 The dynamic contrast enhanced images showed that the targeted G3 nanoglobular agent with a size of approximately 6.2 nm could gradually excrete through renal filtration and accumulated in the urinary bladder. The non-targeted G3 agent resulted in more significant tumor enhancement than the non-targeted G2 agent in T1-weighted 2D spin-echo images (Fig. 2c and 1c), consistent to our previous results.18 Tumor enhancement with the non-targeted G3 agent reached the maximum and then gradually decreased over time. In comparison, the targeted G3 nanoglobular agent resulted in more significant tumor enhancement than the nontargeted G3 agent. Strong tumor enhancement with the targeted contrast agent was maintained for at least 60 minutes after administration, indicating the binding of the targeted G3 agent in the tumor tissue.
Figure 2.
3D maximum intensity projection images for G3 (a) and peptide targeted G3 (b), 2D axial T1 weighted spin-echo images of tumor tissue of the G3 (c) and peptide targeted G3 (d) nanoglobular MRI contrast agents intravenously administered at 0.03 mmolGd/kg in nu/nu female nude mice bearing MDA MB-231 tumor xenografts. Arrows indicate tumor.
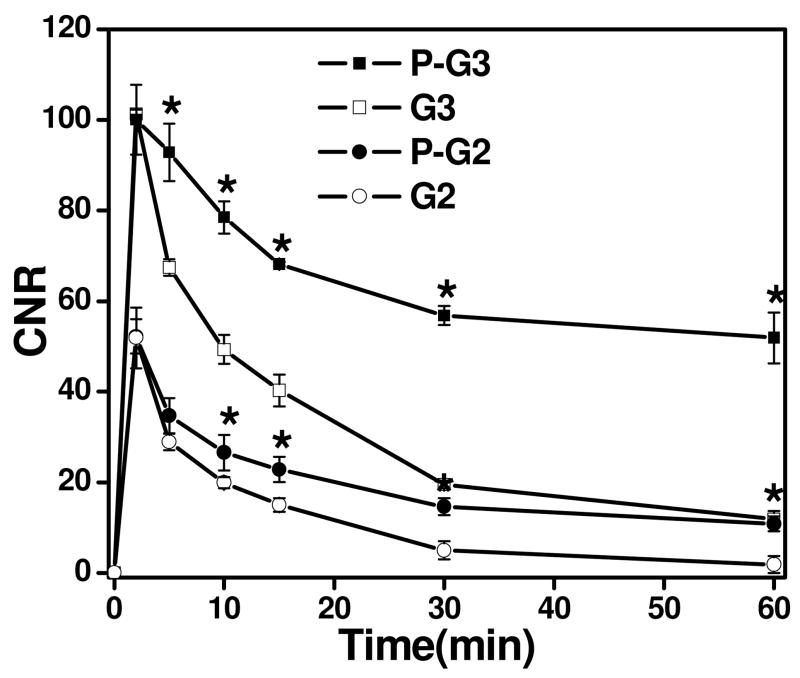
Figure 3 shows the contrast-to-noise ratios (CNR) in the blood before and after injection of the nanoglobular contrast agents. A significant increase in CNR at 2 min postinjection for all the agents was observed, which gradually decreased over time. The G3 agents showed significantly greater and prolonged CNR within blood as compared to G2 agents after 2 min postinjection (p<0.05). Correspondingly, the targeted agents exhibited greater and prolonged CNR within blood as compared to the non-targeted agents (p<0.05).
Figure 3.
Contrast to noise ratio (CNR) of blood in the heart with the G2, G3 and peptide targeted G2 (P-G2), G3 (P-G3) nanoglobular MRI contrast agents administered at 0.03 mmol-Gd/kg in nu/nu female nude mice. (* P < 0.05)
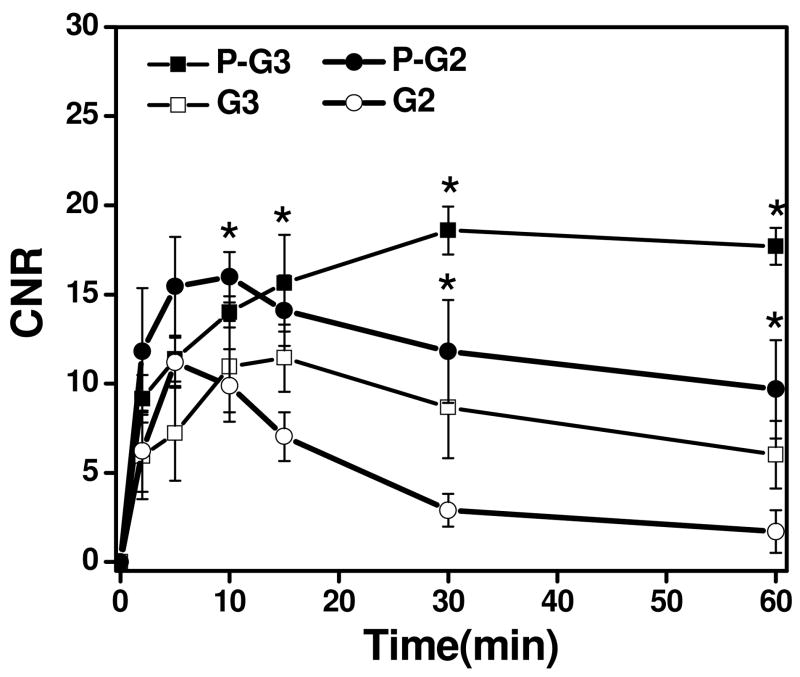
The CNR in the tumor tissue before and after the injection of the nanoglobular contrast agents is plotted in Figure 4. The targeted nanoglobular agents resulted in higher CNR than the corresponding non-targeted agent in the tumor tissue (p < 0.05). The targeted G2 agent resulted in higher CNR than the targeted G3 agent during the first 10 minutes after injection, possibly because the smaller G2 agent with two peptides passed the tumor vasculature more readily than the targeted G3 agent with three peptides. The CNR of the non-targeted agents decreased more rapidly than the corresponding targeted agents after reaching the maximum values. The targeted agents resulted in greater and prolonged CNR within tumor at least for 60 minutes after administration. In our previous study with CLT1-(Gd-DTPA) agents, it was shown that the targeted agents also resulted in strong and prolonged tumor enhancement and the co-injection of the free CLT1 peptide resulted in significantly reduced tumor enhancement for the targeted agent. The specific binding of the CLT1 peptide targeted contrast enhance agents in tumor tissues resulted in stronger and more prolonged tumor enhancement than the non-targeted controls.
Figure 4.
Contrast to noise ratio (CNR) in the tumor with the G2, G3 and peptide targeted G2(P-G2), G3 (P-G3) nanoglobular MRI contrast agents at 0.03 mmol Gd/kg in nu/nu female nude mice bearing MDA MB-231 tumor xenografts. (* P < 0.05)
It appears that the CNR of the targeted nanoglobular agents also decreased after reached the maximum value at 5 minutes post-injection for the G2 agent, but at a slower rate than the non-targeted agents. The result suggests that the binding of CLT1 to tumor fibronectin is reversible and the targeted agents can gradually dissociate from the target and excreted via renal filtration after the MRI examination. Complete clearance of the targeted agents is critical for further preclinical and clinical development.
3.3 Immunohistochemical Study
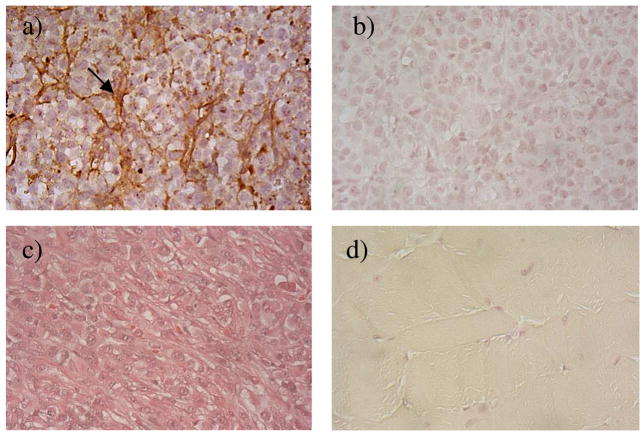
The presence of cancer-associated fibronectin in tumor extracellular matrix has been reported in the literature in a number of animal tumor models and human cancers.12 The presence of fibronectin in the MDA-MB-231 breast cancer xenografts was further confirmed by immunohistochemical staining after in vivo MR imaging. Figure 5 shows the immunostaining of fibronectin in MDA-MB-231 human breast tumor tissues. The abundant presence of fibronectin in the tumor extracellular matrix was clearly revealed after staining with an anti-fibronectin antibody. The muscle tissue did not show the existence of fibronectin after the immunohistochemical staining. The abundant presence of fibronectin in tumor extracellular matrix of MDA-MB-231 human breast tumor tissues allowed the specific binding of the CLT1 peptide targeted nanoglobular contrast agents in the tumor tissue. Since fibronectin is abundantly present in malignant tumor tissue and its presence is also associated to tumor malignancy, it is a suitable molecular target for accurate detection of malignant tumor and tumor prognosis. The CLT1 targeted nanoglobular contrast agents are promising for molecular imaging of fibronectin with MRI and for accurate cancer diagnosis and prognosis.
Figure 5.
Immunostaining of fibronectin in MDA-MB-231 breast tumor xenografts with (a) or without (b) anti-fibronectin primary antibody; tumor tissue stained with hematoxylin and eosin (c); immunostaining of muscle tissue (d). The arrow points to the fibronectin in the extracellular space of tumor tissue.
3.4 Biodistribution Studies
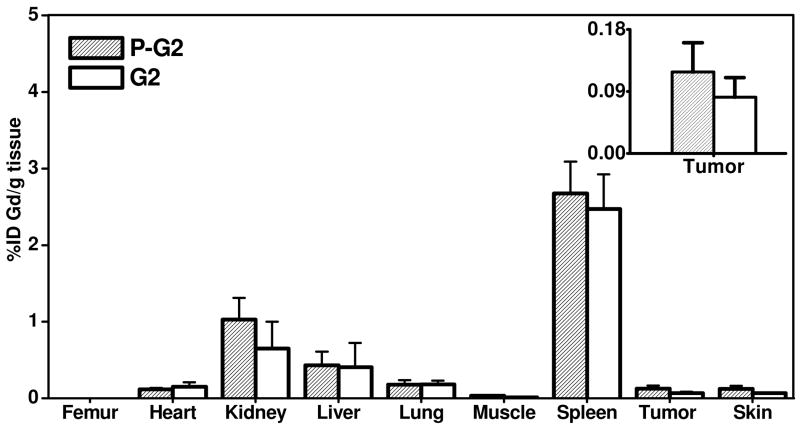
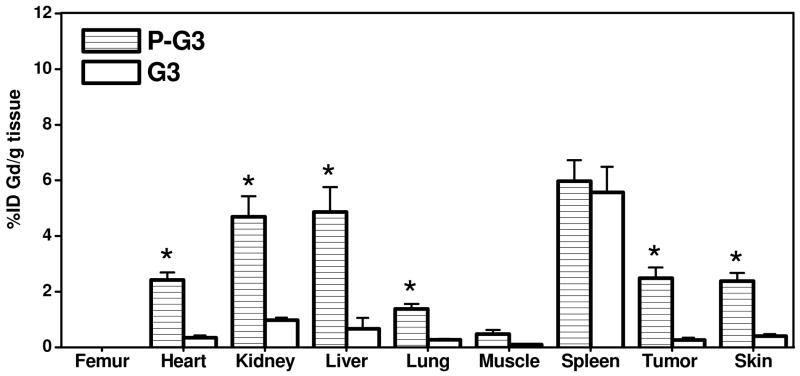
Biodistribution study was performed at 48 hours post-injection of the nanoglobular contrast agents to investigate the Gd retention within major organs and tissues. Figure 6 shows the biodistribution of the contrast agents in the heart, kidney, liver, spleen, lung, muscle, skin, and tumor. Because the tissues in biodistribution study were treated with nitric acid which could dissociate Gd(III) ion from the chelates, this analytic process can not distinguish chelated from unchelated Gd(III). The values in Figure 6 might include the tissue retention of both free and chelated Gd(III) ions. Both of the peptide targeted agents displayed higher tumor uptake than the corresponding non-targeted agents. The targeted G2 nanoglobular agent resulted in much lower tissue accumulation than the targeted G3 agent at 48 hours after injection due to its smaller size and less CLT1 peptides conjugated in the agent. The targeted G3 agent showed significantly higher accumulation in most organs (p < 0.05) except in the spleen, possibly due to its large size and slow excretion. In comparison, the retention of the targeted G2 agent was comparable to the non-targeted G2 agent (p > 0.05) in the main organs and normal tissues, indicating that CLT1 peptide did not result in high accumulation of the targeted G2 agent in normal tissues. No detectable Gd(III) was observed in the bone for all agents, possibly because of the stability of Gd-DOTA monoamide in the conjugates.
Figure 6.
Biodistribution profiles (n = 3) of the gadolinium content in the major organs and tissues for G2, G3 and peptide targeted G2 (P-G2), G3 (P-G3) nanoglobular MRI contrast agents at 48 h after administration. (* P < 0.05)
In summary, we have shown in this study that both CLT1 peptide targeted G2 and G3 nanoglobular Gd-DOTA monoamide conjugates were effective for tumor specific contrast enhancement in MRI. The binding of CLT1 peptide to the fibrin-fibrinectin only in the tumor extracellular matrix resulted in strong and prolonged tumor enhancement. The targeted G2 nanoglobular contrast agent had a smaller size and cleared more rapidly from the body than the corresponding G3 agent. Overall, the targeted G2 agent would be a more promising agent that the G3 agent for further development due to strong tumor enhancement and rapid clearance. Although a small amount of the G2 agent was observed in the body at 48 hours after the injection, the high stability of the Gd-DOTA monoamide would maintain Gd(III) in complexed form, as evidenced by no detectable presence of Gd(III) in the bone. The residual G2 agent would eventually be completely excreted from the body. Further study is ongoing to study the detailed binding mechanism and affinity of the CLT1 peptide and the targeted contrast agents in the tumor extracellular matrix, the long-term accumulation and dose effect of the targeted nanoglobular MRI contrast agents.
4. Conclusions
We designed and synthesized CLT1 peptide-targeted nanoglobular MRI contrast agents specific to fibrin-fibronectin complexes in tumor extravascular matrix for MR cancer molecular imaging. “Click chemistry” was effective for conjugating the peptide to the nanoglobular contrast agents via a short PEG. MR imaging demonstrated that the CLT1-targeted contrast agents resulted in significant enhancement in tumor at a relatively low dose as compared the non-targeted controls. The CLT1 targeted nanoglobular MRI contrast agents are promising for specific cancer molecular imaging with MRI.
Acknowledgments
This work is supported in part by the NIH R01 CA097465. We greatly appreciate Dr. Yongen Sun for his technical assistance in animal handing.
References
- 1.Caravan P, Ellison J, McMurry T, Lauffer R. Chem Rev. 1999;99:2293–2352. doi: 10.1021/cr980440x. [DOI] [PubMed] [Google Scholar]
- 2.Aime S, Crich S, Gianolio E, Giovenzana G, Tei L, Terreno E. Coordin Chem Rev. 2006;250:1562–1579. [Google Scholar]
- 3.Ni Y. Curr Med Imaging Rev. 2008;4:96–112. [Google Scholar]
- 4.Frullano L, Rohovec J, Aime S, Maschmeyer T, Prata M, de Lima J, Geraldes C, Peters J. Chem Eur J. 2004;10:5205–5217. doi: 10.1002/chem.200400369. [DOI] [PubMed] [Google Scholar]
- 5.Laurent S, Vander Elst L, Fu Y, Muller R. Bioconjugate Chem. 2004;15:99–103. doi: 10.1021/bc034114m. [DOI] [PubMed] [Google Scholar]
- 6.Na H, Song I, Hyeon T. Adv Mater. 2009;21:2133–2148. [Google Scholar]
- 7.Werner E, Datta A, Jocher C, Raymond K. Angew Chem Int Ed. 2008;47:8568–8580. doi: 10.1002/anie.200800212. [DOI] [PubMed] [Google Scholar]
- 8.Jacques V, Desreux J. Contrast Agents I. 2002;221:123–164. [Google Scholar]
- 9.Toth E, Helm L, Merbach A. Contrast Agents I. 2002;221:61–101. [Google Scholar]
- 10.Wernert N. Virchows Arch. 1997;430:433–443. doi: 10.1007/s004280050053. [DOI] [PubMed] [Google Scholar]
- 11.Pupa S, Menard S, Forti S, Tagliabue E. J Cell Physiol. 2002;192:259–267. doi: 10.1002/jcp.10142. [DOI] [PubMed] [Google Scholar]
- 12.Kaspar M, Zardi L, Neri D. Int J Canc Res. 2006;118:1331–1339. doi: 10.1002/ijc.21677. [DOI] [PubMed] [Google Scholar]
- 13.Loridon-Rosa B, Vielh P, Matsuura H, Clausen H, Cuadrado C, Burtin P. Cancer Res. 1990;50:1608–1612. [PubMed] [Google Scholar]
- 14.Dvorak H, Senger D, Dvorak A, Harvey V, Mcdonagh J. Science. 1985;227:1059–1061. doi: 10.1126/science.3975602. [DOI] [PubMed] [Google Scholar]
- 15.Neri D, Carnemolla B, Nissim A, Leprini A, Querze G, Balza E, Pini A, Tarli L, Halin C, Neri P, Zardi L, Winter G. Nat Biotechol. 1997;15:1271–1275. doi: 10.1038/nbt1197-1271. [DOI] [PubMed] [Google Scholar]
- 16.Ye F, Jeong E, Jia Z, Yang T, Parker D, Lu Z. Bioconjugate Chem. 2008;19:2300–2303. doi: 10.1021/bc800211r. [DOI] [PMC free article] [PubMed] [Google Scholar]
- 17.Pilch J, Brown D, Komatsu M, Jarvinen T, Yang M, Peters D, Hoffman R, Ruoslahti E. Proc Natl Acad Sci USA. 2006;103:2800–2804. doi: 10.1073/pnas.0511219103. [DOI] [PMC free article] [PubMed] [Google Scholar]
- 18.Kaneshiro T, Jeong E, Morrell G, Parker D, Lu Z. Biomacromolecules. 2008;9:2742–2748. doi: 10.1021/bm800486c. [DOI] [PMC free article] [PubMed] [Google Scholar]
- 19.Rudovsky J, Botta M, Hermann P, Hardcastle K, Lukes I, Aime S. Bioconjugate Chem. 2006;17:975–987. doi: 10.1021/bc060149l. [DOI] [PubMed] [Google Scholar]
- 20.Venditto V, Regino C, Brechbiel M. Mol Pharm. 2005;2:302–311. doi: 10.1021/mp050019e. [DOI] [PubMed] [Google Scholar]
- 21.Kolb H, Finn M, Sharpless K. Angew Chem Int Ed. 2001;40:2004–2021. doi: 10.1002/1521-3773(20010601)40:11<2004::AID-ANIE2004>3.0.CO;2-5. [DOI] [PubMed] [Google Scholar]
- 22.Laus S, Sour A, Ruloff R, Toth E, Merbach A. Chem Eur J. 2005;11:3064–3076. doi: 10.1002/chem.200401326. [DOI] [PubMed] [Google Scholar]
- 23.Xu R, Wang Y, Wang X, Jeong E, Parker D, Lu Z. Exp Biol Med. 2007;232:1081–1089. doi: 10.3181/0702-RM-33. [DOI] [PubMed] [Google Scholar]
- 24.Longmire M, Choyke P, Kobayashi H. Nanomedicine. 2008;3:703–717. doi: 10.2217/17435889.3.5.703. [DOI] [PMC free article] [PubMed] [Google Scholar]
- 25.Boswell C, Eck P, Regino C, Bernardo M, Wong K, Milenic D, Choyke P, Brechbiel M. Mol Pharm. 2008;5:527–539. doi: 10.1021/mp800022a. [DOI] [PMC free article] [PubMed] [Google Scholar]


