Abstract
Insulin-induced gene 2 (INSIG2) and its homolog INSIG1 encode closely related endoplasmic reticulum proteins that regulate the proteolytic activation of sterol regulatory element-binding proteins, transcription factors that activate the synthesis of cholesterol and fatty acids in animal cells. Several studies have been carried out to identify INSIG2 genetic variants associated with metabolic diseases. However, few data have been published regarding the regulation of INSIG2 gene expression. Two Insig2 transcripts have been described in rodents through the use of different promoters that produce different noncoding first exons that splice into a common second exon. Herein we report the cloning and characterization of the human INSIG2 promoter and the detection of an INSIG2-specific transcript homologous to the Insig2b mouse variant in human liver. Deletion analyses on 3 kb of 5′-flanking DNA of the human INSIG2 gene revealed the functional importance of a 350-bp region upstream of the transcription start site. Mutated analyses, chromatin immunoprecipitation assays, and RNA interference analyses unveiled the significance of an Ets-consensus motif in the proximal region and the interaction of the Ets family member SAP1a (serum response factor (SRF) accessory protein-1a) with this region of the human INSIG2 promoter. Moreover, our findings suggest that insulin activated the human INSIG2 promoter in a process mediated by phosphorylated SAP1a. Overall, these results map the functional elements in the human INSIG2 promoter sequence and suggest an unexpected regulation of INSIG2 gene expression in human liver.
Keywords: Carbohydrate/Metabolism, Gene/Promoters, Transcription/Promoter, Transcription/TCF, Gene Expression, INSIG, SREBP
Introduction
Metabolic syndrome, which is characterized by visceral obesity, dyslipidemia, hyperglycemia, and hypertension, has become one of the most significant public health challenges worldwide. Although the association of several of these risk factors has been known for more than 80 years, their clustering received scant attention until 1988, when Reaven (1) described syndrome X, which was subsequently renamed metabolic syndrome. Reaven (1) proposed that insulin resistance is the initial cause that triggers the other symptoms of syndrome X, although Lemieux et al. (2) suggested that visceral obesity and the hypertriglyceridemic waist phenotype were central components. The cause of this syndrome therefore remains unclear.
SREBP1c (sterol regulatory element-binding protein 1c) is an essential transcription factor for the genomic actions of insulin on both carbohydrate and lipid metabolism (3). Changes in this transcription factor activity might therefore be the key to linking insulin resistance with the metabolic disorders proposed by Lemieux et al. (2) at the molecular level. Indeed, type 2 diabetes and obesity, two common insulin-resistant states, are characterized by a decrease in SREBP1c mRNA levels in adipose tissue (4). In contrast, an elevated expression of SREBP1c has been found in the liver of obese (ob/ob) mice, in insulin receptor substrate-2-deficient mice and also in a transgenic mouse model of lipodystrophy (5, 6).
After their synthesis on membranes of the endoplasmic reticulum (ER)4 in an inactive form, SREBPs move in vesicles to the Golgi complex, where they are processed sequentially by two proteases (7). These cleavages release a cytosolic transcription factor domain that enters the nucleus and activates genes that produce more than a score of enzymes required for the synthesis of cholesterol and unsaturated fatty acids as well as phospholipids and triglycerides (8). In the ER, SREBPs associate with SREBP cleavage-activating protein, which functions as a sensor of cholesterol levels and, in turn, interacts with another class of ER-embedded proteins, the so-called insulin-inducible gene (INSIG) proteins. When cellular cholesterol levels are high, INSIG proteins bind and trap SREBP cleavage-activating protein, thereby retaining it in the ER and preventing it from escorting SREBPs from the ER to the site of proteolytic activation in the Golgi complex. Thus, the ER-to-Golgi migration of SREBPs is crucially dependent on INSIG proteins.
Two INSIG isoforms, designated INSIG1 and INSIG2, are known (9). The two human INSIG proteins are 59% identical and both bind SREBP cleavage-activating protein in a sterol-dependent fashion. The major differences between these two proteins relate to the regulation of their expression. Thus, INSIG1 is itself an obligatory SREBP target gene, whereas INSIG2 is expressed at a low but constitutive level, at least in cultured cells, and is not regulated by SREBPs (10).
Yabe et al. (9) reported the discovery of a liver-specific transcript of Insig2 in rodents, designated Insig2a, which differs from the ubiquitous transcript, called Insig2b, in the noncoding first exons that splice into a common second exon through the use of different promoters. Although both transcripts encode identical proteins, they differ in terms of regulation patterns. The Insig2a transcript is down-regulated by insulin, and the resulting drop in Insig2a allows SREBP1c, the predominant isoform in the liver, to be processed independently of hepatic cholesterol levels. However, the direct role of insulin on suppression of the Insig2a promoter has not been demonstrated.
Different loci linked to body mass index and/or obesity in mice (11) and humans (12), including the locus where the INSIG2 gene is located, have been detected by genome-wide linkage analyses. Moreover, using a comprehensive single nucleotide polymorphism map constructed over 62 common strains of mice, Insig2 was identified as a strong candidate susceptibility gene for total plasma cholesterol levels, free fatty acids, aortic lesions, and fat pad mass (13).
Although no data are yet available on human polymorphic variation in components of the INSIG family, Herbert et al. (14) identified a genetic variant associated with obesity in the genomic region where INSIG2 is located using a dense whole genome scan of DNA samples from Framingham Heart Study participants.
In light of the above findings, our objective was to clone and characterize the functional elements in the human INSIG2 promoter. Our results demonstrate for the first time that members of the Ets family of transcription factors are involved in the regulation of human INSIG2 expression and therefore of SREBP processing.
EXPERIMENTAL PROCEDURES
Plasmid Constructs
A PCR fragment of the 5′ upstream region of human INSIG2 gene was cloned into the pGEM-T easy vector (Promega). INSIG2-luc vector was obtained by subcloning into the SacI restriction site of pGL3-basic vector. The −2912, −1887, −1422, −859, −347, and −152/−11 luc plasmids were obtained by restriction digestion from INSIG2-luc. Mutagenesis was performed using the QuickChange site-directed mutagenesis kit (Stratagene), using INSIG2-luc as a template. All constructs were confirmed by DNA sequencing. Vector pcDNA3-ELK1 was a gift from Dr. Robert A. Hipskind (Hannover Medical School, Germany). Vectors pCAGGS, pCA-SAP1a, and pCA-SAP1a DBD were obtained from Dr. Hiroshi Kubota (Institute for Frontier Medical Sciences, Kyoto, Japan). pcDNA-SAP1a was obtained by subcloning from pCA-SAP1a. Vector pcDNA-E2F was provided by Dr. Yoshikuni Nagamine (Howard Hughes Medical Institute, Duke University Medical Center). Vector pcDNA-NRF2 was obtained from Dr. Jose Blesa (Instituto de Biomedicina de Valencia, Spain). Ras expression vector pCEFL-K5-KRasV12 was a gift from Dr. José María Rojas (Centro Nacional de Microbiología, Spain).
Cell Culture and Luciferase Assay
Human embryonic kidney 293T (HEK293T) cells were maintained in Dulbecco's modified Eagle's medium containing 25 mmol/liter glucose, 100 units/ml penicillin, and 100 μg/ml streptomycin supplemented with 10% fetal bovine serum. Cells were seeded in 6-well culture dishes and transiently transfected using Lipofectamine 2000 (Invitrogen) according to the manufacturer's protocol. Each well received 3.8 μg of INSIG2 reporter plasmids and 200 ng of a Renilla luciferase construct (pRL-TK) as internal control. The human liver carcinoma HepG2 cell line was cultured in the same medium as HEK293T, but transfection assays were performed in 24-well culture dishes using 850 ng of INSIG2 reporter plasmids and 50 ng of the pRL-TK vector. In ELK1 and SAP1a overexpression experiments, 50 ng of each vector was added together with 0, 10, 25, or 50 ng of K-Ras expression vector. Luciferase activities were measured 24 or 48 h after transfection in a Wallac 1420 VICTOR luminometer according to the technical manual for the Dual-Luciferase reporter assay system (Promega).
Rat hepatocytes were isolated from fed rats by the collagenase method (15) and seeded in Williams E medium supplemented with 25 mm glucose, 100 nm insulin, 1 μm dexamethasone, 5% fetal bovine serum, and antibiotics. Transfection assays were performed in 6-well culture dishes using Lipofectamine with 3.8 μg of INSIG2 reporter plasmids and 200 ng of the pRL-TK control vector. For metabolic studies, hepatocytes were incubated for 6 h in Dulbecco's modified Eagle's medium, 1 g/liter (low) glucose medium 24 h after transfection and then cultured in either low or high (4.5 g/liter) glucose medium for an additional 24 h, either unstimulated or stimulated with 100 nm insulin. Transactivation activities were measured as above.
Human hepatocytes in a monolayer were obtained from 3H Biomedical (Uppsala, Sweden) and maintained in Williams E medium supplemented with 25 mm glucose, 100 nm insulin, 1 μm dexamethasone, 5% fetal bovine serum, and antibiotics. Where indicated, the medium was changed to culture medium supplemented with 400 μm palmitic acid dissolved in methanol or vehicle alone for 24 h, and the cells were incubated with or without 100 nm insulin for a further 24 h.
Total RNA Preparation and Quantitative RT-PCR
Total cellular RNA was isolated from mouse or rat liver, human hepatocytes, and HEK293T or HepG2 cells using TRIzol reagent (Invitrogen), following the manufacturer's instructions. Human RNA was purchased from Ambion (Applied Biosystems). Total RNA (1 μg) was reverse transcribed into cDNA using Expand reverse transcriptase (Roche Applied Science) and random hexamer primers (Roche Applied Science). cDNA was used as a template for conventional PCR using specific primers of INSIG2 isoforms for each species (sequence available upon request).
In siRNA experiments, HepG2 cells were transfected with 200 nm human synthetic predesigned ELK1 short interfering RNA (siRNA) (ID number 42834), SAP1a (ID number 3286), or silencer negative control siRNA (Ambion). After incubation for 48 h, cells were used for RNA preparation and subsequent real-time quantitative PCR analysis of knockdown. ELK1, SAP1a, and INSIG2 mRNA expression levels were quantified using the ABI 7500 fast instrument and Taqman technology (Assays-on-demand gene expression product, Applied Biosystems). INSIG2b and SREBP1c mRNA levels were monitored by SYBR Green using primers designed specifically for these isoforms. All real-time quantitative PCRs were performed in triplicate. Relative changes were calculated, employing the second derivative comparative Ct method using GAPDH as the internal reference gene.
Protein analysis was carried out by Western blot as described previously (16), using antibodies against ELK1 (sc-355) or SAP1a (sc-13030) (Santa Cruz Biotechnology, Inc., Santa Cruz, CA).
Electrophoretic Mobility Shift Assays
Double-stranded DNA oligonucleotides end-labeled with [γ-32P]dATP were used to perform electrophoretic mobility shift assays as described previously (15). Binding reactions were carried out for 20 min at room temperature using in vitro translated human ELK1, SAP1a, NRF2α, or E2F proteins, prepared with the TNT T7-coupled reticulocyte lysate system (Promega), 9 fmol of probe, and 2 μg of dI/dC. In supershift assays, specific antibodies (Santa Cruz Biotechnology, Inc.) were added for 1 h on ice prior to the addition of probes. For competition experiments, a 25-fold excess of unlabeled oligonucleotide was added to the reaction mixture. DNA-protein complexes were resolved on a 6% (w/v) nondenaturing polyacrylamide gel in 0.5× TBE buffer (1× TBE is 90 mm Tris, 90 mm boric acid, and 1 mm EDTA).
Chromatin Immunoprecipitation (ChIP) Assay
ChIP assays were performed using isolated nuclei from formaldehyde-cross-linked HEK293T and HepG2 cells. DNA was sheared by sonication, and the precleared chromatin was incubated with 2 μg of the corresponding antibodies against ELK1 (sc-355), SAP1a (sc-1426), SRF (sc-335), and RNA polymerase II (sc-899) (Santa Cruz Biotechnology, Inc.). Samples were immunoprecipitated with protein A/G-Sepharose preblocked with bovine serum albumin, tRNA, and sonicated λ-DNA. After RNase and proteinase K treatment, and reverse cross-linking, DNA was purified using QIAQUICK columns (Qiagen). The amount of DNA in each chromatin immunoprecipitate was quantified by real-time PCR on a 7500 Fast System (Applied) using SYBR Green PCR reagent. A standard curve was established for each amplicon by 10-fold serial dilutions of the input sample. Analysis of the c-fos promoter was used as a positive control for ELK1 and SRF proteins. The PCR primers used to detect target sequences were as follows: INSIG2 (promoter), 5′-CTCCAGTTTCCCGCAGACC-3′ and 5′-TCCGGTTCCTGCTGTCAATAA-3′; c-fos (promoter), 5′-GCGAGCAGTTCCCGTCAAT-3′ and 5′-GAAAGGCCGTGGAAACCTG-3′, GAPDH (coding region), 5′-AGCCACATCGCTCAGACACC-3′ and 5′-ACCCGTTGACTCCGACCTT-3′. Each ChIP assay was performed at least twice to ensure reproducibility.
Statistical Analysis
Statistical significance was estimated using Student's two-tailed t test for unpaired observations. A p value of less than 0.05 was considered to be significant.
RESULTS
INSIG2a Transcript Is Not Detected in Human Liver
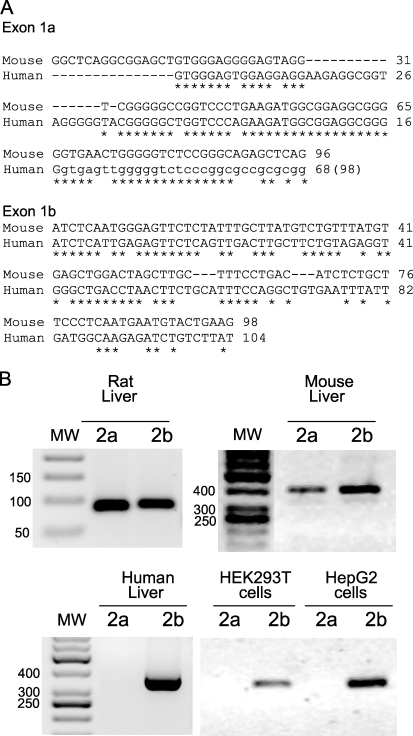
A comparative analysis of human and murine genomic sequences showed a high degree of identity and similar organization in terms of nucleotide sequence between rodents and humans in both the 1a and 1b exons (Fig. 1A). This high sequence homology allowed us to design primers to assess INSIG2a and -2b expression in human, rat, and mouse liver by RT-PCR analysis. Both mRNA variants were detected in mouse and rat liver, thereby confirming previous studies. However, INSIG2b was the only form of INSIG2 detected in human liver (Fig. 1B). To confirm this result, we analyzed the expression of INSIG2 variants in HEK293T and HepG2 cells. No trace of the INSIG2a transcript was found in any of the two human cell lines analyzed, as predicted by in silico analysis.
FIGURE 1.
Alternative sequences at the 5′-end of INSIG2 mRNA from mouse or human liver. A, the nucleotide sequences of the first exons of mouse Insig2a and -2b were aligned with human sequence on the basis of coding exon 2 to predict the putative exons in the human gene. B, total RNA from the indicated tissues or cell lines was analyzed by RT-PCR analysis as described under “Experimental Procedures.” Specific primers were used to determine the presence of each variant in different organisms and cell types. Variant Insig2a is only present in mouse and rat liver and is not detected in human liver or cell lines. MW, molecular weight.
Functional Promoter Analysis of the 5′-Flanking Region of the Human INSIG2 Gene
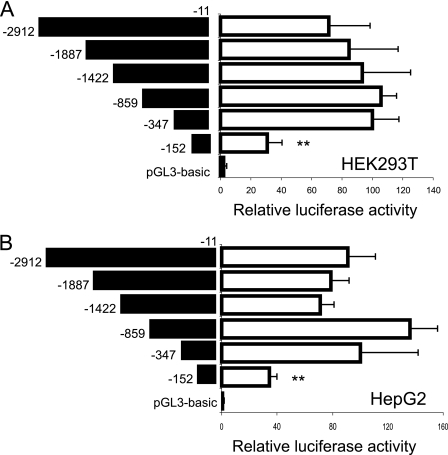
Because the 2a transcript is not expressed in the human liver, we analyzed the region upstream of exon 1b to determine the cis elements responsible for transactivation of the INSIG2 gene. Serial 5′ truncations of the human INSIG2 promoter were made upstream of the luciferase reporter gene, and these constructs were transfected into HEK293T (Fig. 2A) or HepG2 cells (Fig. 2B). Analysis of these reporter constructs revealed that a 350-bp region upstream of the transcription start site was sufficient to retain full promoter activity. Moreover, the first 150 bp still retain 40% of the promoter activity in both cell lines, suggesting that this fragment contains a basal promoter region critical for human INSIG2 gene expression.
FIGURE 2.
Characterization of the human INSIG2 gene proximal promoter region. The sequences in the INSIG2 promoter shown on the left were inserted into the multiple cloning regions of the pGL3-basic vector and transfected into HEK293T (A) or HepG2 (B) cells. The results represent relative firefly/Renilla luciferase activities, considering the −347/−11 construct as 100% activation. Values are the mean ± S.E. from four separate experiments.
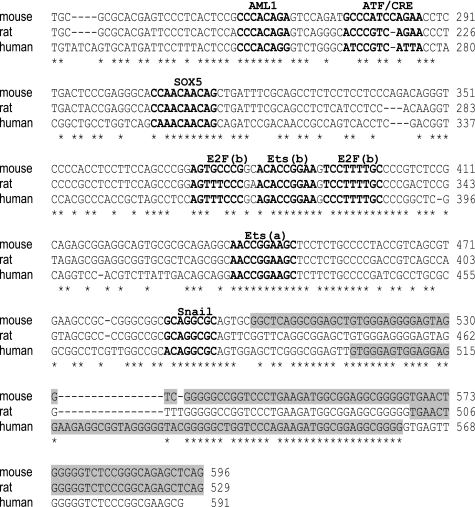
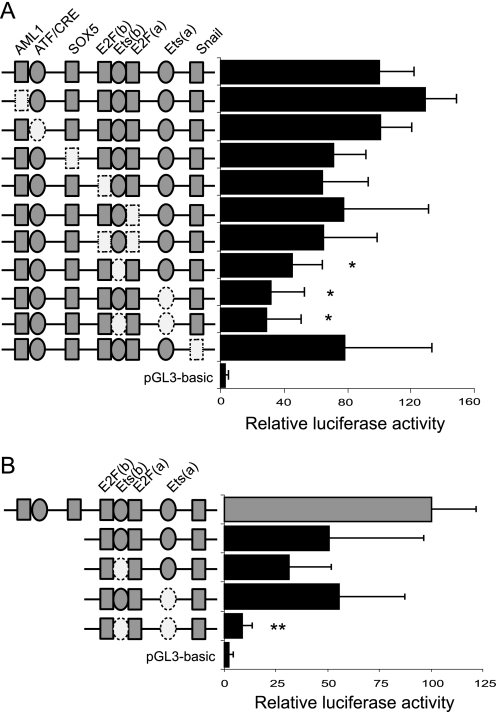
After aligning the genomic sequences from mice and rats with the corresponding identified proximal promoter region of human INSIG2, we identified several highly putative conserved binding sites using a theoretical transcription factor binding site search (TRANSFAC data base; Fig. 3). The contribution of individual binding sites within the human INSIG2 proximal promoter was defined by site-directed mutagenesis of the promoter. Upon transient transfection into HEK293T cells, a dramatic drop in the reporter activity was observed when the Ets elements were muted. Moreover, the Ets-a site mutation was found to have the greatest effect (Fig. 4A). We repeated the experiments with the −152/−11 construct. In this context, we only observed changes when the two Ets sites were mutated, with a luciferase activity similar to that of the pGL3-basic vector (Fig. 4B), indicating that the environment has a key role in dictating the functional specificity of Ets sites. Similar results were obtained upon transfection into HepG2 cells (data not shown).
FIGURE 3.
Identification of conserved putative binding sites found in the human INSIG2 promoter. The INSIG2 promoter sequences from humans, mice, and rats are aligned, including the exon 1 situation (shaded sequence). Several highly conserved transcription factor binding sites were identified. The putative binding sites are shown in the figure and underlined on the sequences.
FIGURE 4.
Ets binding sites are critical for INSIG2 promoter activity. Mutation of diverse predicted binding sites in the proximal promoter was analyzed by luciferase assays. Activities of the mutated constructs on −347/−11 luc (A) and −152/−11 luc (B) transfected in HEK293T cells are shown. The results represent relative firefly/Renilla luciferase activities considering the wild type −347/−11 luc construct as 100% activation. Values are the mean ± S.E. from four separate experiments.
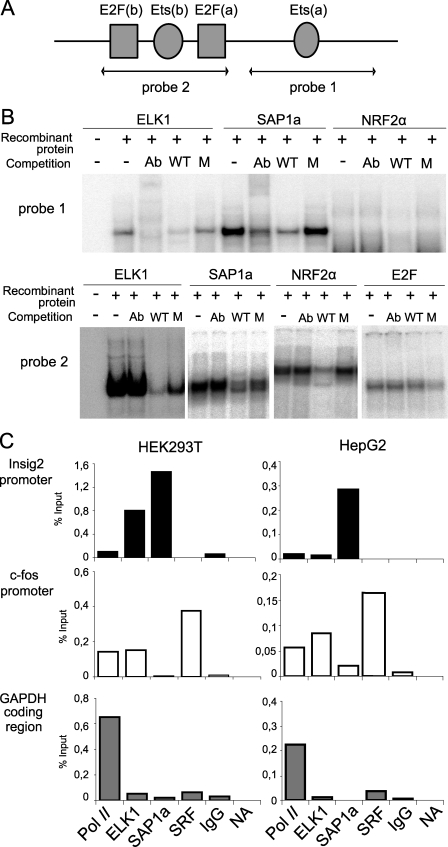
TRANSFAC analysis recognized ELK1, SAP1a, and NRF2 transcription factors as the putative binding proteins associated with the Ets elements. To determine whether these proteins can indeed bind to the Ets-binding motifs of the INSIG2 promoter, we performed electrophoretic mobility shift assays using different probes covering Ets elements (Fig. 5A) in the presence of these in vitro translated human recombinant proteins. As shown in Fig. 5B, bands representing specific protein-DNA interactions were only observed using ELK1 and SAP1a proteins at the Ets-a (probe 1) binding site. The complex was abolished in the presence of unlabeled oligonucleotides and partially supershifted with specific monoclonal antibodies. Moreover, no interactions were observed when this binding site was mutated. E2F recombinant protein was not able to bind to its putative element. These results demonstrate that at least one Ets element essential for basal human INSIG2 promoter activity binds ELK1 and SAP1a transcription factors in vitro.
FIGURE 5.
ELK1 and SAP1a proteins bind to the INSIG promoter. A, DNA sequence for human INSIG2 proximal promoter. The arrows indicate the probes used in the experiment. B, representative autoradiogram from a typical electrophoretic mobility shift assay realized with recombinant human proteins incubated with 32P-probes. Anti-ELK1, anti-SAP1a, anti-NRF2a, or anti-E2F antibodies (Ab) were used for supershift assays, and competitions were carried out with a 25-fold molar excess of non-radiolabeled wild type (WT) or mutant (M) probes. C, ChIP assay was performed with HEK293T and HepG2 cells. Immunoprecipitation of samples was performed with anti-ELK1, anti-SAP1a, or anti-SRF antibodies. A positive control of transcriptionally active genes was performed using anti-RNA-polymerase II antibody, and a negative reaction was included using a nonspecific IgG antibody or in the absence of antibody. The relative -fold enrichment of ELK1, SAP1a, or SRF binding sites is compared with the value of no antibody, which is set to 0. Representative quantitative PCRs of three independent experiments are shown.
Association of ELK1 and SAP1a proteins to the INSIG2 promoter was also demonstrated using the standard ChIP assay followed by real-time PCR (Fig. 5C). After immunoprecipitation, ELK1 and SAP1a were present in the human INSIG2 promoter on genomic DNA extracted from growing HEK293T, whereas only SAP1a was able to enrich the INSIG2 promoter sequence from HepG2 chromatin. ELK1 and SAP1a usually form a ternary nucleoprotein complex with the SRF, although this does not bind to the human INSIG2 promoter in vivo. As a positive control, we analyzed the c-fos promoter, a classic gene controlled by the Ets factors associated with SRF. No enrichment was seen using primers amplifying the GAPDH coding region or nonspecific IgG antibody. In order to verify the results obtained, the same samples employed for the ChIP assay were used for the RNApol-ChIP assay, as described previously (17). The α-RNA polymerase antibody precipitated mainly coding chromatin fragments.
Phosphorylated SAP1a Induces INSIG2 Promoter Activity
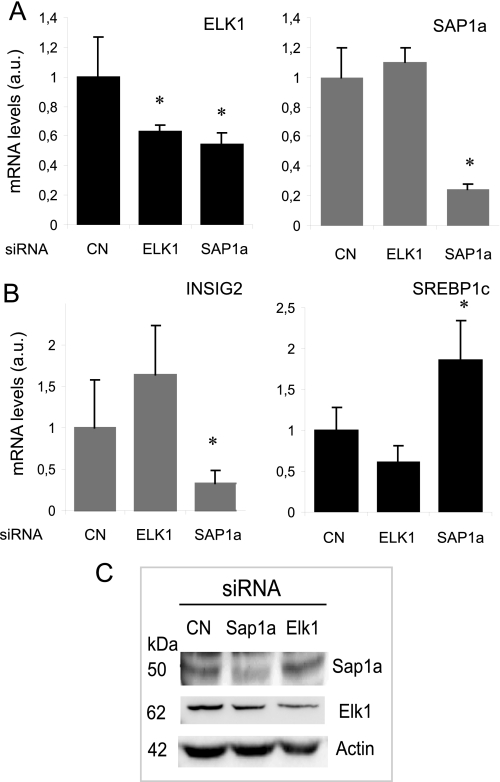
The above results indicated that ELK1 and SAP1a may be critical factors for the INSIG2 gene regulation. We investigated the effect on INSIG2 promoter activity of knocking down ELK1 and SAP1a into the HepG2 cell line to determine their specific role. A significant knockdown of either ELK1 or SAP1a was observed with siRNA targeting ELK1 (40%) or SAP1a (80%) but not with the unrelated siRNA used as control (Fig. 6A). Moreover, SAP1a interference also reduced the ELK1 mRNA levels (50%). Western blot analysis verified that ELK1 and SAP1a levels remained low in ELK1 and SAP1a knockdown, respectively (Fig. 6C). We have observed unchanged ELK1 protein levels after knocking down SAP1a. Thus, the identification of the ELK gene as a potential SAP1a target could be a false positive. Under these conditions, a significant reduction in INSIG2 expression was only observed when SAP1a siRNA was used. As a result, an increase in the expression of SREBP1 was also observed (Fig. 6B). These observations provide supporting evidence that SAP1a may be one of the transactivators of the human INSIG2 promoter.
FIGURE 6.
Knockdown experiments confirm that SAP1a regulates INSIG2 promoter activity. HepG2 cells were transfected with siRNA targeting ELK1 and SAP1a, and total mRNA was extracted. The level of knockdown was analyzed at the mRNA level using quantitative PCR for ELK1 or SAP1a (A). The effect of RNA interference was evaluated by measuring endogenous INSIG2 and SREBP1 gene expression (B). All data were normalized to GAPDH expression. The asterisks indicate a significant difference (*, p < 0.05) compared with cells with the negative siRNA control used as calibrator. The knockdown effect on ELK1 and SAP1a protein levels was analyzed by Western blot (C). Nuclear extracts from HepG2 cells transfected with siRNA targeting ELK1 or SAP1a were fractionated by SDS-PAGE, and immunoblots were developed using anti-ELK1, anti-SAP1a, and anti-actin antibodies. A representative blot of three experiments is shown. a.u., arbitrary units.
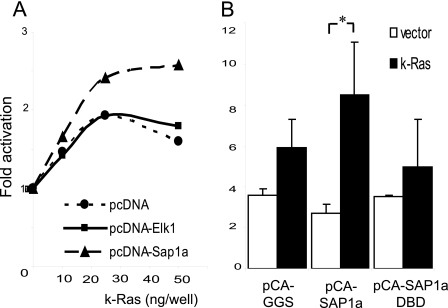
To assess the transcriptional activity of SAP1a on the human INSIG2 promoter, a construct containing the minimal human INSIG2 promoter region linked to a luciferase reporter plasmid was analyzed in HepG2 cells cotransfected with SAP1a or ELK1 expression vectors or a dominant negative form that express only the binding domain of SAP1a. Because the ability of SAP1a to mediate transcriptional activation is dependent on its phosphorylation state, which in turn is regulated by ERKs (18), the experiments were performed in the presence of a constitutively active form of K-Ras, which activates endogenous ERKs (19). As shown in Fig. 7A, phosphorylated SAP1a activated INSIG2 promoter. Furthermore, the effect was specific because overexpression of neither ELK1 nor SAP1a negative dominant (SAP1aDBD) factors affected the INSIG2 promoter transactivation (Fig. 7B).
FIGURE 7.
The phosphorylated form of SAP1a regulates the human promoter. A construct containing the minimal human INSIG2 promoter region linked to a luciferase reporter plasmid was analyzed in HepG2 cells cotransfected with pcDNA-ELK1 or pcDNA-SAP1a expression vectors and increasing amounts of expression vector for a permanent active Ras protein (A) or pcDNA-SAP1a or SAP1a DBD (dominant negative form) in the presence or absence of 50 ng/well K-Ras expression vector (B). After cell lysis, firefly and Renillla luciferase activities were measured. Results represent relative firefly/Renilla luciferase activities. Values are the mean ± S.E. from four separate experiments.
Insulin Induces INSIG2 Promoter Activation via SAP1a
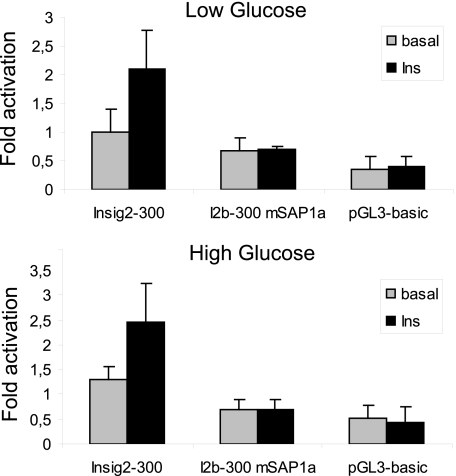
Insulin regulates genes through two major signaling pathways, namely the Ras-MAPK cascade and the PI-3-kinase pathway in hepatocytes (20, 21). In view of the role of insulin in the SREBP pathway and the role of phosphorylated SAP1a in INSIG2 promoter activity through the Ras pathway, we evaluated the effect of insulin on the human INSIG2 promoter activation and the role of SAP1 in this effect. For this experiment, we used primary rat hepatocytes because cell lines do not respond properly to insulin. A strong induction in luciferase activity was observed in rat hepatocytes transiently transfected with a construct containing the −347/−11 INSIG2 promoter region after 24 h of insulin treatment (Fig. 8). This effect was not observed if the SAP1a binding site was mutated, suggesting that SAP1a is physiologically important for INSIG2 gene regulation by insulin in the hepatocytes.
FIGURE 8.
Insulin regulates human INSIG2 promoter activity. Wild type −347/−11 INSIG2 promoter construct (INSIG2–300) or a mutated construct where the SAP1a binding site is mutated by in vitro mutagenesis (mSAP1a) was transfected into rat hepatocytes for 24 h. Cells were incubated in Dulbecco's modified Eagle's medium containing low (1 g/liter) or high (4.5 g/liter) glucose in the absence (basal) or presence of 100 nm insulin (Ins). After 24 h, the cells were lysed for luciferase assays. The relative firefly/Renilla luciferase activities of the constructs as well as their response to glucose or insulin were compared with the activity of the wild-type construct with low glucose, which was set to 1 ± S.E. Values are the mean ± S.E. from four separate experiments. The asterisks indicate significant difference (*, p < 0.05), as determined using Student's t test.
There are two signals that contribute to lipogenic enzyme induction in liver: glucose levels and insulin. We also explored the contribution of glucose to INSIG2 promoter activation. As shown in Fig. 8, INSIG2 transactivation was not affected by glucose concentration.
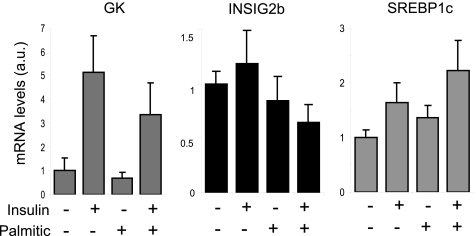
A series of molecular and physiologic alterations occurs in the setting of insulin resistance that results in the accumulation of triglycerides in liver. SREBP1c regulation of lipogenesis is highly involved in the development of fatty livers in animal models of insulin resistance (22). However, taking into account the insulin-dependent regulation of SREBP1c, it might be anticipated that this isoform would not be activated in states of insulin resistance. To explore the relationship of the unexpected regulation of the human INSIG2 gene by insulin with this paradox, we induced insulin resistance in human hepatocytes. First of all, we verified that a monolayer culture human hepatocytes only expressed the INSIG2b variant (data not shown). As shown in Fig. 9, the palmitic acid treatment induced insulin resistance in the human hepatocytes as the decrease of GK expression denotes. In this condition, there was a decrease in the levels of INSIG2b with a subsequent increase in SREBP1c levels, suggesting that INSIG2b regulation by insulin could play a role in the regulation of SREBP1c expression in insulin resistance states.
FIGURE 9.
Palmitic acid prevents insulin stimulation of INSIG2 promoter activity. Human hepatocytes were treated with 100 nm insulin and/or 400 μm palmitic acid to induce insulin resistance. Total RNA was extracted, and endogenous INSIG2b and SREBP1c gene expression was analyzed by RT-quantitative PCR. Glucokinase (GK) expression was used as a control of insulin action. All data were normalized to GAPDH expression.
DISCUSSION
The present study has several major findings. First, we have demonstrated that human liver or human cell lines only express the INSIG2b variant. Second, we have characterized the minimal human INSIG2 promoter located on the first 300 bp. Third, we have identified an Ets binding site involved in the INSIG2 promoter activation. Finally, SAP1a is shown to be an essential transcription factor that binds this human INSIG2 promoter region. Moreover, phosphorylated SAP1a activates the human INSIG2 promoter and is one of the mechanisms that controls its insulin-dependent regulation.
Yabe et al. (9) identified a liver-specific mRNA for Insig2 from mouse liver, thereby suggesting its existence in humans given the sequence homology between species. We therefore sought to examine whether transcriptional regulation in humans was also mediated through the use of different promoters. The analysis of INSIG2 mRNA expression in human liver and in different human cell lines by RT-PCR showed that the INSIG2b variant was the only mRNA form detected in human samples (Fig. 1B). The oligonucleotides were designed on the basis of conserved sequences of exons 1a and 1b between humans and mice (55 and 50% identical, respectively) and the similar genome structure between humans and rodents. However, we cannot exclude the possibility that an exon 1a could be located in another region of the human INSIG2 gene. To test this hypothesis, we are currently conducting 5′-rapid amplification of cDNA end analyses from human liver RNA. To date, we have not yet found two different 5′ transcripts.
In this report, we have identified the core human INSIG2 promoter region. The human promoter is enclosed in a 300-bp region of DNA (Fig. 2). The analysis of potential sites for regulation of this sequence allowed us to define the presence of at least one active binding site for proteins SAP1a and ELK1 belonging to the TCF subfamily of Ets transcription factors. The Ets gene family codes for transcription factors that are involved in the generation of human cancers and in cell transformation and development (23). Ets proteins contain a conserved DNA binding region of about 85 amino acids, called the Ets domain, that binds specifically to DNA sequences with a core GGA element. This element is involved in protein-protein interactions that are essential for biological activity (24). Ets members are classical activators that may play a primary role in formation of the initiation complex on minimal core promoters lacking the TATA sequence, such as thymidylate synthetase (25) or cytochrome c oxidase subunit IV (26). The human INSIG2 promoter may be another gene where Ets proteins could be a component of the general transcription complex around the start site.
SAP1a and ELK1 are expressed at similar levels in the majority of tissues (27), although SAP1a seems to be more abundant than ELK1 in liver. Accordingly, SAP1a was found to be the exclusive Ets factor that binds the INSIG2 promoter in the hepatic cell line HepG2, whereas both factors are able to recognize Ets binding site in HEK293T cells (Fig. 5C), indicating that the cellular environment has a key role in dictating the functional specificity of individual Ets domain proteins, as shown by Boros et al. (28).
The TCF proteins form complexes with SRF dimers, as in the c-fos gene promoter (29). However, SRF-independent autonomous DNA binding of a TCF has been reported in the absence of SRF. One example is the E74 gene in Drosophila, which is activated by ELK1 and SAP1A in the absence of SRF (30). Similarly, ELK1 and SAP1A regulate the mouse Cct promoter (chaperon-containing t-complex polypeptide 1) independently of SRF (31). The human INSIG2 promoter would probably fall within this category of genes regulated by TCF factors without SRF as a partner.
Boros et al. (28) provided insights into target gene selection by members of the Ets domain transcription factors, highlighting redundancy of binding at some promoters but highly selective function at others. The heterotypic interactions with other transcription factors dictates this differential selection (28). Our data pointed to this latter event. As shown in Fig. 2, a region between 347 and 152 bp must play an important role in the control of the INSIG2 promoter because its absence implies a 50% decrease in the activity of the human promoter. To date, we have not been able to identify proteins that might bind these sequences.
The Ets family of transcription factors is an effector of a series of signaling pathways, including the MAPK kinase pathways, ERK1/2, p38, and JNK, as well as the phosphatidylinositol 3-kinase pathway (32). ELK1 is poorly activated by p38 MAPK, whereas SAP1a serves as a convergence point for all three major classes of mammalian MAPK pathways. Janjnecht et al. (33) demonstrated that SAP1a is phosphorylated by p38 MAPK, which efficiently activates c-fos transcription in 293 cells. In this report, we have demonstrated that INSIG2 promoter transactivation by SAP1a is dependent on its phosphorylation status and is achieved by activation of the Ras protein. This is particularly important because the Ras-MAPK route, especially ERK1/2, is one of the cascades involved in regulating the metabolic response to insulin (34). Although TCFs historically regulate genes of immediate response, some literature reports describe the hormonal or nutritional regulation exerted by some of these factors. In 3T3-F442A preadipocytes, for example, ELK1 and SAP1A proteins mediate the induction of Egr1 transcription caused by growth hormone in an SRF-dependent manner (35, 36). It has also been shown that the ternary complex between ELK1 and SRF binds to two active sites in the human LXRβ promoter to regulate the glucose-dependent response of LXRβ gene expression (37). Furthermore, ELK1 and SAP1a specifically bind to insulin response elements in the prolactin, somatostatin, and thymidine kinase genes, independently of SRF binding (38). Our data suggest that SAP1a could be involved in both human INSIG2 basal activity and also in some other type of metabolic regulation. We are therefore currently preparing transgenic mice that express luciferase gene reporter under the wild-type human promoter and the promoter mutated on the ELK1/SAP1a binding site. If the above hypothesis is correct, we should be able to observe a different luciferase gene expression under fasting/refeeding conditions.
INSIG genes were initially identified as the most abundant insulin-induced genes in a hepatic cell line (39); therefore, it is not surprising that our data show a positive regulation of human INSIG2 gene expression by insulin. However, the current findings do not explain the paradox whereby insulin induces the expression of SREBP1c and its negative regulators INSIG1 and INSIG2 simultaneously. Yellaturu et al. (40) have recently proposed that the stimulation of SREBP1c processing by insulin is mediated by a selective depletion of the INSIG2a protein by promoting decay of its cognate mRNA. It might be anticipated that SREBP1c would not be activated in states of insulin resistance. However, even in the presence of profound insulin resistance, the hepatic SREBP1c transcription is stimulated (41). Our data (Fig. 9) show that INSIG2b regulation by insulin could play an important role in explaining this paradox.
We could not definitely rule out the possibility that human liver presents an INSIG2 mRNA variant equivalent to Insig2a present in the liver of rodents. However, our data raise a question regarding the regulation of hepatic SREBP1c processing in response to insulin and provide the base for further research to develop a full understanding of additional signal transduction pathways that control the expression of INSIG2.
In conclusion, we have cloned and characterized the proximal human INSIG2 promoter. Our data demonstrate for the first time that members of the Ets family of transcription factors are involved in the regulation of human INSIG2 expression and therefore of SREBP processing. Using deletion constructions and siRNA knockdown analysis, we have identified one functional SAP1a binding site that controls basal promoter activity. Moreover, insulin activates the human INSIG2 promoter in a process that is probably mediated by phosphorylated SAP1a, thereby suggesting an unexpected mechanism of INSIG2 gene expression regulation. Our findings provide a basis for the characterization of signal transduction pathways that control the expression of human INSIG2 in the liver.
Acknowledgments
We thank Dr. Jane Mellor (Department of Biochemistry, University of Oxford) and co-workers for indispensable help with ChIP assays.
This work was supported by Ministry of Science and Innovation Grant SAF2006-06760 and the Carlos III Health Institute (Red Temática de Investigación Cooperativa en Enfermedades Cardiovasculares (RECAVA) RD06/0014/0025).
- ER
- endoplasmic reticulum
- INSIG
- insulin-inducible gene
- HEK293T
- human embryonic kidney 293T
- GAPDH
- glyceraldehyde-3-phosphate dehydrogenase
- ERK
- extracellular signal-regulated kinase
- RT
- reverse transcription
- siRNA
- small interfering RNA
- ChIP
- chromatin immunoprecipitation
- SRF
- serum response factor
- MAPK
- mitogen-activated protein kinase
- JNK
- Jun N-terminal kinase
- SREBP
- sterol regulatory element-binding protein
- TCF
- ternary complex factor.
REFERENCES
- 1.Reaven G. M. (1988) Diabetes 37, 1595–1607 [DOI] [PubMed] [Google Scholar]
- 2.Lemieux I., Pascot A., Couillard C., Lamarche B., Tchernof A., Alméras N., Bergeron J., Gaudet D., Tremblay G., Prud'homme D., Nadeau A., Després J. P. (2000) Circulation 102, 179–184 [DOI] [PubMed] [Google Scholar]
- 3.Foufelle F., Ferré P. (2002) Biochem. J. 366, 377–391 [DOI] [PMC free article] [PubMed] [Google Scholar]
- 4.Sewter C., Berger D., Considine R. V., Medina G., Rochford J., Ciaraldi T., Henry R., Dohm L., Flier J. S., O'Rahilly S., Vidal-Puig A. J. (2002) Diabetes 51, 1035–1041 [DOI] [PubMed] [Google Scholar]
- 5.Shimomura I., Matsuda M., Hammer R. E., Bashmakov Y., Brown M. S., Goldstein J. L. (2000) Mol. Cell 6, 77–86 [PubMed] [Google Scholar]
- 6.Tobe K., Suzuki R., Aoyama M., Yamauchi T., Kamon J., Kubota N., Terauchi Y., Matsui J., Akanuma Y., Kimura S., Tanaka J., Abe M., Ohsumi J., Nagai R., Kadowaki T. (2001) J. Biol. Chem. 276, 38337–38340 [DOI] [PubMed] [Google Scholar]
- 7.Brown M. S., Goldstein J. L. (1999) Proc. Natl. Acad. Sci. U.S.A. 96, 11041–11048 [DOI] [PMC free article] [PubMed] [Google Scholar]
- 8.Horton J. D., Goldstein J. L., Brown M. S. (2002) J. Clin. Invest. 109, 1125–1131 [DOI] [PMC free article] [PubMed] [Google Scholar]
- 9.Yabe D., Komuro R., Liang G., Goldstein J. L., Brown M. S. (2003) Proc. Natl. Acad. Sci. U.S.A. 100, 3155–3160 [DOI] [PMC free article] [PubMed] [Google Scholar]
- 10.Goldstein J. L., DeBose-Boyd R. A., Brown M. S. (2006) Cell 124, 35–46 [DOI] [PubMed] [Google Scholar]
- 11.Cheverud J. M., Ehrich T. H., Hrbek T., Kenney J. P., Pletscher L. S., Semenkovich C. F. (2004) Diabetes 53, 3328–3336 [DOI] [PubMed] [Google Scholar]
- 12.Deng X., Cagen L. M., Wilcox H. G., Park E. A., Raghow R., Elam M. B. (2002) Biochem. Biophys. Res. Commun. 290, 256–262 [DOI] [PubMed] [Google Scholar]
- 13.Cervino A. C., Li G., Edwards S., Zhu J., Laurie C., Tokiwa G., Lum P. Y., Wang S., Castellini L. W., Lusis A. J., Carlson S., Sachs A. B., Schadt E. E. (2005) Genomics 86, 505–517 [DOI] [PubMed] [Google Scholar]
- 14.Herbert A., Gerry N. P., McQueen M. B., Heid I. M., Pfeufer A., Illig T., Wichmann H. E., Meitinger T., Hunter D., Hu F. B., Colditz G., Hinney A., Hebebrand J., Koberwitz K., Zhu X., Cooper R., Ardlie K., Lyon H., Hirschhorn J. N., Laird N. M., Lenburg M. E., Lange C., Christman M. F. (2006) Science 312, 279–283 [DOI] [PubMed] [Google Scholar]
- 15.Casado M., Callejas N. A., Rodrigo J., Zhao X., Dey S. K., Boscá L., Martín-Sanz P. (2001) FASEB J. 15, 2016–2018 [DOI] [PubMed] [Google Scholar]
- 16.Fernández-Alvarez A., Tur G., López-Rodas G., Casado M. (2008) FEBS Lett. 582, 177–184 [DOI] [PubMed] [Google Scholar]
- 17.Sandoval J., Rodríguez J. L., Tur G., Serviddio G., Pereda J., Boukaba A., Sastre J., Torres L., Franco L., López-Rodas G. (2004) Nucleic Acids Res. 32, e88. [DOI] [PMC free article] [PubMed] [Google Scholar]
- 18.Strahl T., Gille H., Shaw P. E. (1996) Proc. Natl. Acad. Sci. U.S.A. 93, 11563–11568 [DOI] [PMC free article] [PubMed] [Google Scholar]
- 19.Oliva J. L., Zarich N., Martínez N., Jorge R., Castrillo A., Azañedo M., García-Vargas S., Gutiérrez-Eisman S., Juarranz A., Boscá L., Gutkind J. S., Rojas J. M. (2004) J. Biol. Chem. 279, 33480–33491 [DOI] [PubMed] [Google Scholar]
- 20.Cheatham B., Kahn C. R. (1995) Endocr. Rev. 16, 117–142 [DOI] [PubMed] [Google Scholar]
- 21.Myers M. G., Jr., Sun X. J., White M. F. (1994) Trends Biochem. Sci. 19, 289–293 [DOI] [PubMed] [Google Scholar]
- 22.Yahagi N., Shimano H., Hasty A. H., Matsuzaka T., Ide T., Yoshikawa T., Amemiya-Kudo M., Tomita S., Okazaki H., Tamura Y., Iizuka Y., Ohashi K., Osuga J., Harada K., Gotoda T., Nagai R., Ishibashi S., Yamada N. (2002) J. Biol. Chem. 277, 19353–19357 [DOI] [PubMed] [Google Scholar]
- 23.Li R., Pei H., Watson D. K. (2000) Oncogene 19, 6514–6523 [DOI] [PubMed] [Google Scholar]
- 24.Wasylyk B., Hahn S. L., Giovane A. (1993) Eur. J. Biochem. 211, 7–18 [DOI] [PubMed] [Google Scholar]
- 25.Jolliff K., Li Y., Johnson L. F. (1991) Nucleic Acids Res. 19, 2267–2274 [DOI] [PMC free article] [PubMed] [Google Scholar]
- 26.Virbasius J. V., Scarpulla R. C. (1991) Mol. Cell. Biol. 11, 5631–5638 [DOI] [PMC free article] [PubMed] [Google Scholar]
- 27.Giovane A., Pintzas A., Maira S. M., Sobieszczuk P., Wasylyk B. (1994) Genes Dev. 8, 1502–1513 [DOI] [PubMed] [Google Scholar]
- 28.Boros J., O'Donnell A., Donaldson I. J., Kasza A., Zeef L., Sharrocks A. D. (2009) Nucleic Acids Res. 37, 7368–7380 [DOI] [PMC free article] [PubMed] [Google Scholar]
- 29.Buchwalter G., Gross C., Wasylyk B. (2004) Gene 324, 1–14 [DOI] [PubMed] [Google Scholar]
- 30.Mo Y., Vaessen B., Johnston K., Marmorstein R. (1998) Mol. Cell 2, 201–212 [DOI] [PubMed] [Google Scholar]
- 31.Yamazaki Y., Kubota H., Nozaki M., Nagata K. (2003) J. Biol. Chem. 278, 30642–30651 [DOI] [PubMed] [Google Scholar]
- 32.Yordy J. S., Muise-Helmericks R. C. (2000) Oncogene 19, 6503–6513 [DOI] [PubMed] [Google Scholar]
- 33.Janknecht R., Hunter T. (1997) EMBO J. 16, 1620–1627 [DOI] [PMC free article] [PubMed] [Google Scholar]
- 34.Avruch J. (1998) Mol. Cell Biochem. 182, 31–48 [PubMed] [Google Scholar]
- 35.Clarkson R. W., Shang C. A., Levitt L. K., Howard T., Waters M. J. (1999) Mol. Endocrinol. 13, 619–631 [DOI] [PubMed] [Google Scholar]
- 36.Watson D. K., Robinson L., Hodge D. R., Kola I., Papas T. S., Seth A. (1997) Oncogene 14, 213–221 [DOI] [PubMed] [Google Scholar]
- 37.Nilsson M., Dahlman-Wright K., Karelmo C., Ebeling M., Gustafsson J. A., Steffensen K. R. (2007) Nucleic Acids Res. 35, 4858–4868 [DOI] [PMC free article] [PubMed] [Google Scholar]
- 38.Jacob K. K., Ouyang L., Stanley F. M. (1995) J. Biol. Chem. 270, 27773–27779 [DOI] [PubMed] [Google Scholar]
- 39.Diamond R. H., Du K., Lee V. M., Mohn K. L., Haber B. A., Tewari D. S., Taub R. (1993) J. Biol. Chem. 268, 15185–15192 [PubMed] [Google Scholar]
- 40.Yellaturu C. R., Deng X., Park E. A., Raghow R., Elam M. B. (2009) J. Biol. Chem. 284, 31726–31734 [DOI] [PMC free article] [PubMed] [Google Scholar]
- 41.Browning J. D., Horton J. D. (2004) J. Clin. Invest. 114, 147–152 [DOI] [PMC free article] [PubMed] [Google Scholar]


