Abstract
Phosphatidylcholine is made in all nucleated mammalian cells via the CDP-choline pathway. Another major pathway for phosphatidylcholine biosynthesis in liver is catalyzed by phosphatidylethanolamine N-methyltransferase (PEMT). We have now identified 3T3-L1 adipocytes as a cell culture model that expresses PEMT endogenously. We have found that PEMT mRNA and protein levels increased dramatically in 3T3-L1 cells upon differentiation to adipocytes. 5′-Deletion analysis of the PEMT promoter-luciferase constructs stably expressed in 3T3-L1 adipocytes identified a regulatory region between −471 and −371 bp (relative to the transcriptional start site). Competitive and supershift assays demonstrated binding sites for transcription factors Sp1, Sp3 (−408 to −413), and YY1 (−417 to −420). During differentiation of 3T3-L1 cells to adipocytes, the amount of Sp1 protein decreased by ∼50% just prior to activation of PEMT. Transduction of 3T3-L1 adipocytes with retrovirus containing Sp1 cDNA demonstrated that Sp1 inhibited PEMT transcriptional activity. Similarly, short hairpin RNA directed against Sp1 in 3T3-L1 adipocytes enhanced PEMT transcriptional activation. Chromatin immunoprecipitation assays confirmed that Sp1 binds to the PEMT promoter, and this interaction decreases upon differentiation to adipocytes. These experiments directly link increased PEMT expression in adipocytes to decreased transcriptional expression of Sp1. In addition, our data established that Sp1 binding was required for tamoxifen-mediated inhibition of Pemt promoter activity.
Keywords: Adipocyte, Enzymes, Gene Regulation, Phosphatidylcholine, Phosphatidylethanolamine, CTP:Phosphocholine Cytidylyltransferase, Phosphatidylethanolamine Methyltransferase
Introduction
Phosphatidylcholine (PC)3 is the predominant phospholipid of all cell membranes and of the circulating blood lipoproteins (1). In mammalian species, there are two major pathways for PC synthesis. The majority of PC is formed by the CDP-choline pathway (1), which is regulated by the activity of CTP:phosphocholine cytidylyltransferase and for which a dietary source of choline is required. In the liver, substantial amounts of PC can also be synthesized by phosphatidylethanolamine N-methyltransferase (PEMT) (2, 3). PEMT is a small integral membrane protein (22 kDa) that catalyzes three sequential methylations of phosphatidylethanolamine using S-adenosylmethionine as a methyl donor (4, 5). PEMT contributes ∼30% of total hepatic PC synthesis, whereas the enzymes of the CDP-choline pathway produce the remaining 70% (4, 6–8). Despite being the smaller contributor to hepatic PC production in the liver, the significance of the PEMT pathway was underscored when Pemt−/− mice were fed a choline-deficient diet that attenuated the CDP-choline pathway. The mice developed severe liver pathology and died within 5 days (9). PC derived from PEMT has been shown to have an important role in the secretion of hepatic triacylglycerols in vivo (10, 11). It is well established that dyslipidemia is strongly associated with fatty liver and cardiovascular disease (12–14). Recently, our laboratory has linked PEMT expression with the development of steatohepatitis (15, 16) and atherosclerosis (17). Thus, knowledge of the factors that regulate Pemt gene expression might be useful for designing new therapeutic regimens.
Even though PEMT plays an important role in hepatic lipid metabolism, the transcriptional regulation of Pemt gene expression is not well understood. The Pemt gene is localized to mouse chromosome 11 and spans 35 kb; it contains 7 exons and 6 introns (18). The promoter lacks a TATA box but contains a GC-rich region that is characteristic of many TATA-less gene promoters (19). Pemt gene expression is regulated in both a tissue-dependent and developmental manner (4, 20). It was previously shown that PEMT expression is activated during the perinatal period in rat liver (20). Recently, it has also been shown that Pemt gene expression is induced by estrogen in human and mouse primary hepatocytes (21). In this study, we have identified 3T3-L1 adipocytes as a cell culture model that expresses PEMT endogenously. Thus, the aim of the study was to elucidate transcription factors and respective cis-acting elements that regulate gene expression of Pemt in 3T3-L1 adipocytes.
EXPERIMENTAL PROCEDURES
Materials
Dexamethasone, 3-isobutyl-1-methylxanthine, bovine insulin, tamoxifen, and mithramycin A were purchased from Sigma. The luciferase vectors, pGL3 basic, and pGL3 control vectors containing the cDNA for Photinus pyralis, the pSV-β-galactosidase vector, the dual luciferase reporter assay system, and the β-galactosidase assay system were obtained from Promega (Madison, WI). The pBK-CMV vector was purchased from Stratagene (La Jolla, CA); pCL-ECO was purchased from IMGENEX (San Diego), and pBabe-puro was obtained from Addgene (Cambridge, MA). Lipofectamine™ Plus, Lipofectamine™ 2000, Dulbecco's modified Eagle's medium (DMEM), α-minimum essential medium, and fetal bovine serum (FBS) were from Invitrogen. Anti-Sp1 antibody, anti-Sp3 antibody, anti-SREBP-1, and anti-IgG antibodies were purchased from Santa Cruz Biotechnology; anti-protein-disulfide isomerase antibody was purchased from StressGen Biotechnologies (Victoria, British Columbia, Canada); anti-YY1 antibody was from Cedarlane Laboratories Ltd. (Burlington, Ontario, Canada), and anti-TBP antibody was obtained from Upstate Biotechnology, Inc. (Lake Placid, NY). The polyclonal antibody directed against the C-terminal end of rat PEMT was raised in a rabbit in our laboratory (4).
Cell Culture and Differentiation of NIH 3T3-L1 Fibroblasts
COS-7 African green monkey kidney cells, C3H10T1/2 mouse embryonic fibroblasts, and NIH 3T3-L1 fibroblasts (ATCC) were cultured in high glucose Dulbecco's modified Eagle's medium (DMEM) supplemented with 10% (v/v) fetal bovine serum (FBS). Hepa-1c1c7 mouse hepatoma cells were cultured in α-minimum essential medium, 10% (v/v) FBS, and H2.35 mouse hepatocytes were cultured in high glucose DMEM, 5% (v/v), FBS, and 200 nm dexamethasone. All cell lines were obtained from ATCC and grown in medium supplemented with penicillin G (100 units/ml) and streptomycin (100 units/ml) in a 5% CO2-humidified incubator at 37 °C. To induce differentiation, NIH 3T3-L1 fibroblasts were cultivated in growth medium until confluent. Two days after reaching confluency, cells were induced to differentiate by the addition of 0.25 μm dexamethasone, 0.5 mm 3-isobutyl-1-methylxanthine, and 3 μg/ml insulin for 3 days. Cells were then incubated in normal growth media until differentiated. Medium was replaced every 2 days. Cells were considered adipocytes when > 90% had large cytoplasmic lipid droplets.
Adult mouse cultured primary hepatocytes were isolated from male Pemt+/+ mice with a mixed genetic background of 129/J and C57BL/6J using the collagenase perfusion technique as described previously (22). The cells were plated at a density of 0.5 × 10⁶ on collagen-coated 60-mm dishes in DMEM supplemented with 4% FBS, 100 nm dexamethasone, and 1 nm insulin.
Animal Care
All animal procedures were performed in accordance with the University of Alberta Animal Policy and Welfare Committee, which adheres to the principles for biomedical research involving animals developed by the Council for International Organizations of Medical Sciences. Male C57BL/6J mice (The Jackson Laboratory, Bar Harbor, ME) were 8–12 weeks old and maintained on standard chow diet containing 6% (w/w) fat and 0.02% (w/w) cholesterol (LabDiet). Tamoxifen (Sigma) was dissolved at a concentration of 0.2 mg/ml in sesame oil containing 1% benzyl alcohol. The mice were injected subcutaneously with either tamoxifen 0.5 mg/kg mouse weight or vehicle 2.5 μl (sesame oil, 1% benzyl alcohol)/g of mouse weight. The mice were injected at the same time on 5 consecutive days and anesthetized 4 h following the final injection.
Immunoblot Analyses
Cell lysates (50 μg) from NIH 3T3-L1 cells during differentiation were heated for 10 min at 90 °C in 62.5 mm Tris-HCl (pH 8.3), 10% glycerol, 5% (v/v) 2-mercaptoethanol, 1% SDS, and 0.004% bromphenol blue. The samples were electrophoresed on a 10% SDS-polyacrylamide gel in 25 mm Tris-HCl (pH 8.5), 192 mm glycine, and 0.1% SDS buffer. The proteins were transferred to polyvinylidene fluoride by electroblotting in transfer buffer (125 mm Tris-HCl (pH 8.3)), 960 mm glycine, 10% (v/v) methanol). Following transfer, the membrane was incubated overnight at 4 °C with 5% skim milk in 10 mm Tris-HCl (pH 7.4), 100 mm NaCl, 0.1% Tween 20 (T-TBS) followed by 1 h at room temperature or overnight at 4 °C with antibody raised against the protein indicated. Anti-PEMT and anti-Sp1 antibodies were diluted (1:5000) in 1% milk, T-TBS. Anti-protein-disulfide isomerase and anti-TBP antibodies were diluted (1:4000) in 4% bovine serum albumin, T-TBS. Immunoreactive proteins were detected using enhanced chemiluminescence system (Amersham Biosciences) according to the manufacturer's instructions.
RNA Isolation and PCR Analysis
Total RNA was isolated from liver tissue or cultured cells using the TRIzol® reagent (Invitrogen) according to the manufacturer's instructions. First strand cDNA synthesis from 2 μg of total RNA was performed using SuperScript™ II reverse transcriptase (Invitrogen) primed by oligo(dT)12–18. PCR was performed using the indicated gene-specific primers given in Table 1. Amplicons were visualized with ethidium bromide on an agarose gel or measured using real time quantitative PCR using the Rotor-gene 3000 instrument (Montreal Biotech) and analyzed with the Rotor-Gene 6.0.19 program (Montreal Biotech).
TABLE 1.
PCR primer sequences
The abbreviations for the mRNAs are as follows: CYC, cyclophilin; PPAR, peroxisome proliferator-activated receptor; C/EBP, CAAT element-binding protein; FABP4, fatty acid-binding protein 4.
| Gene | Forward sequence | Reverse sequence |
|---|---|---|
| PEMT | CCGCTCGAGCTGTATGAGCTGGCTGCTGGGTTAC | CCTGTCAGCTTCTTTTGTGCA |
| CYC | TTCAAAGACAGCAGAAAACTTTCG | TCTTCTTGCTGGTCTTGCCATTCC |
| C/EBPα | TGGACAAGAACAGCAACGAG | TCACTGGTCAACTCCAGCAC |
| PPARγ | GAAAAGACAACGGACAAATCAC | TACGGATCGAAACTGGCAC |
| FABP4 | TGGAAGCTTGTCTCCAGTGA | AATCCCCATTTACGCTGATG |
| 18 S | AGGACCGTCGTTCTATTTTGTTG | CGGGCCGGGTGAGGTTT |
Plasmid Construction
The Pemt promoter region −1000 to +130 was obtained by PCR amplification using mouse liver genomic DNA as a template. We used a numbering system based on the transcriptional start site (+1) determined previously (18). The primers (forward 5′-CGGGGTACCCCGCAGCCTGCCACTTGGCACACC-3′ and reverse 5′-CCCAAGCTTGGGCAGAACCAGAAGGAAATGGGA-3′) were designed to contain restriction enzyme sites for HindIII and KpnI. The promoter region was purified from agarose gel using the Qiax II gel extraction kit (Qiagen Inc., Mississauga, Ontario, Canada), according to the manufacturer's instructions, and directionally ligated into double-digested (HindIII and KpnI) pGL3 basic to generate −1000 luciferase. All other promoter sections were generated by PCR using −1000 luciferase as a template and then double-digested and ligated into pGL3 basic as outlined previously. The reverse primer remained the same with various forward primers for −471 luciferase (5′-CGGGGTACCCCGAGGGAGGGCACAGTGTATGAAT-3′), −371 luciferase (5′-CGGGGTACCCCGGTACCTTGCTTCTTTCTT-3′), −271 luciferase (5′-CGGGGTACCCCGAGAGGGCGAAGAGTATGCAAT-3′), −171 luciferase (5′-GGGGTACCCCGGTGTATGGTACATGTCAC-3′), and −71 luciferase (5′-CGGGGTACCCCGCTTGCACCCTGGGTGCTGTTG-3′).
The cDNA for full-length mouse Sp1 was obtained by RT-PCR. Briefly, total RNA was obtained from mouse liver and reverse-transcribed with SuperScript™ II primed by oligo(dT)12–18. Primers used in the subsequent PCR amplification of Sp1 cDNA were forward, 5′-CCGGAATTCGGACAATGAGCGACCAAGATCACTCCATG-3′, and reverse, 5′-CCGGAATTCCGGTTAGAAACCATTGCCACTGATATT-3′ containing restriction enzyme sites for EcoRI. The PCR product was digested with EcoRI and gel-purified prior to being ligated into pBabe.puro.
DNA oligonucleotides for the synthesis of short hairpin RNA were synthesized by the University of Alberta DNA Core Facility. For each specific gene, we designed DNA oligonucleotides that are predicted to form a stem-loop structure when transcribed to RNA. The sequence of the forward DNA oligonucleotide included the unique nucleotide target sequence in both the sense and antisense orientation, separated by a spacer sequence (5′-TTCAAGAGA-3′) and flanked by BglII and HindIII restriction site overhangs. The target sequence specific for Sp1 was 5′-GGCTGCTACCCCAACTTAC-3′. As a negative control, we used a sequence that did not have homology with expressed genes and is referred to as Scrambled (5′-ACTACCGTTGTTATAGGTGGT-3′) (23). After annealing, the double-stranded DNA was directionally cloned into pSuper.retro.puro (OligoEngine, Seattle, WA) double-digested with BglII and HindIII.
Site-directed mutagenesis was applied to introduce a mutation of the Sp1-binding element in the −471 luciferase plasmid. For that purpose, the core sequence of the Sp1 element 5′-GGGAGG-3′ was replaced with 5′-GGGAAA-3′ using the QuikChange® site-directed mutagenesis kit (Stratagene, La Jolla, CA). The resulting construct was termed −471MSp1 luciferase. The identity of the all generated plasmids was confirmed by sequencing.
Nuclear Extract Preparations and Electrophoretic Mobility Shift Assays (EMSAs)
Nuclear extracts from mouse liver and 3T3-L1 cells were prepared as described previously (24, 25). Promoter-derived oligonucleotides (40 bp) were synthesized by the University of Alberta DNA Core Facility. Complementary oligonucleotides (1 nmol of each) containing 5′ overhangs were heated at 90 °C for 10 min in 100 μl of annealing buffer (10 mm Tris-HCl (pH 7.5), 100 mm NaCl, and 1 mm EDTA). The annealing mixtures were slowly cooled to room temperature, and 50 pmol of double-stranded oligonucleotide were labeled by filling in end-recessed 3′ ends using Klenow fragment in the presence of [α-32P]dCTP. For each binding reaction (40 μl), 2 μg of poly(dI-dC)·poly(dI-dC), 20 μl of a 2× binding buffer (12.5 mm HEPES (pH 7.9), 25 mm KCl, 2 mm MgCl, 0.07% Triton X-100, 13.3% glycerol, 5 mm dithiothreitol), 20 μg of nuclear extract, and labeled probe (150,000 cpm) were incubated for 1 h at 4 °C. For competitive EMSAs, 100-fold molar excess of nonlabeled double-stranded oligonucleotides were incubated with nuclear extracts for 15 min at 4 °C before addition of labeled probe. Commercially available antibody (2 μg) was added to the binding reactions 15 min before the labeled probe for supershift assays. Binding reactions were terminated by the addition of 8 μl of gel loading buffer (30% glycerol (v/v), 0.25% bromphenol blue (w/v), 0.25% xylene cyanol (w/v)). The protein-DNA complexes were separated on an 8 or 7% (for some competitive/supershift assays) nondenaturing PAGE with Tris borate/EDTA buffer system (89 mm Tris, 89 mm borate, 2 mm EDTA (pH 8.3)) at 4 °C and detected by autoradiography of a dried gel.
Stable and Transient Transfections
3T3-L1 stable cell lines were generated by transfecting preadipocytes at 30% confluency in 100-mm dishes with 10 μg of luciferase reporter construct and 1 μg of pBK-CMV containing the neomycin cassette, using the calcium phosphate precipitation method (26). Stable cell lines were selected with Geneticin® (G-418 sulfate, Invitrogen) and confirmed by PCR amplification using commercially available primers RVP3 and GLP (Promega Corp.) that flank the multiple cloning site. The copy number and level of differentiation of each clone were determined by PCR. To measure luciferase activity, samples were collected from 3T3-L1 stable cell lines at various time points during the differentiation period. Luciferase activity was assayed using commercial kits on a MicroBeta liquid scintillation counter (PerkinElmer Life Sciences) and normalized to protein concentration.
Cultured cell lines (H2.35, Hepa-1c1c7, COS-7, and C3H10T1/2 (2 × 10⁵/60-mm dish)) and freshly isolated adult mouse hepatocytes in primary culture (5 × 10⁵/60-mm dish) were transiently transfected with 1 μg of luciferase reporter construct and 1 μg of pSV-β-galactosidase using Lipofectamine™ 2000 (hepatocytes) or Lipofectamine™ Plus reagent (cell lines). After 20–48 h, cell extracts were assayed for luciferase activity and normalized to β-galactosidase activity to adjust for transfection efficiency.
Retroviruses
The packaging human renal epithelium cell line 293T/17 was transiently transfected with the murine leukemia virus packaging vector (pCL-ECO), an expression retroviral vector (pBabe.puro or pSuper.retro.puro) using Lipofectamine™ Plus reagent. After 24 h, the conditioned medium was filtered (0.45-μm filters), supplemented with Polybrene (8 μg/ml, and used to infect 3T3-L1 cells stably transfected with −471 luciferase. Transduced 3T3-L1 cells were selected with medium containing 2.5 μg/ml puromycin (Sigma) for 48 h. 3T3-L1 cells were then cultured and differentiated as described above.
Chromatin Immunoprecipitation Assays
3T3-L1 preadipocytes and adipocytes were fixed with 1% formaldehyde (27). Cells were washed twice with cold phosphate-buffered saline and resuspended in 0.8 ml of radioimmunoprecipitation assay (RIPA) buffer containing 0.1% SDS, 0.1% sodium deoxycholate, 1% Triton X-100, 1 mm EDTA, 0.5 mm EGTA, 140 mm NaCl, 10 mm Tris-HCl (pH 8) supplemented with protease inhibitor mixture (Sigma). The cells were sonicated (four times for 30 s) using a Sonicator Ultrasonic Processor XL (Misonix Farmingdale, NY) followed by centrifugation at 10,000 × g for 10 min at 4 °C. The supernatants were collected and diluted with RIPA buffer to 0.2 μg/μl DNA. Protein G-Sepharose beads (Sigma) were pretreated with 0.1 mg/ml sonicated salmon sperm and 1 mg/ml bovine serum albumin for 2 h at 4 °C. Immunoprecipitation was performed by incubating 1 ml of diluted supernatant (200 μg of DNA) with 4 μg of anti-Sp1, anti-YY1, or anti-IgG antibodies for 30 min at room temperature. The pretreated protein G-Sepharose beads (50 μl, 50% with 1× RIPA), 5 μg of sonicated salmon sperm, and 10 μg of bovine serum albumin were added, and the immunoprecipitation was continued for 16 h at 4 °C. The protein G-Sepharose beads were washed three times with 1× RIPA, three times with 1× RIPA supplemented with 1 m NaCl, 2 times with LiCl buffer (0.25 m LiCl, 1% Nonidet P-40, 1% sodium deoxycholate, 1 mm EDTA, 10 mm Tris-HCl, 500 mm NaCl (pH 8)), and twice with TE buffer (20 mm Tris-HCl (pH 8), 1 mm EDTA). The protein-DNA complexes were eluted from the beads at room temperature for 15 min each with 200 μl of 1.5% SDS for 15 min, followed by 150 μl of 0.5% SDS. The fractions were combined and incubated at 68 °C for 16 h to reverse cross-links. Protein was digested with proteinase K, and DNA was extracted by phenol/chloroform followed by ethanol precipitation. To detect the Pemt promoter, the following primers were used for standard PCR: forward, 5′-TTCGGTAAGGAACCTGACC-3′, and reverse, 5′-GAACATTCGCTGGGCAATTC-3′.
Statistical Analysis
Values are expressed as means ± S.E. A significant difference between the means was determined using the unpaired Student's two-tailed t test for most analyses. To compare differences between multiple groups, one-way analysis of variance using Tukey post hoc analysis or analysis of variance on the ranks using Kruskal-Wallis post hoc analysis were used where appropriate. A probability of p < 0.05 was considered significant.
RESULTS
3T3-L1 Cells Express PEMT mRNA upon Differentiation to Adipocytes
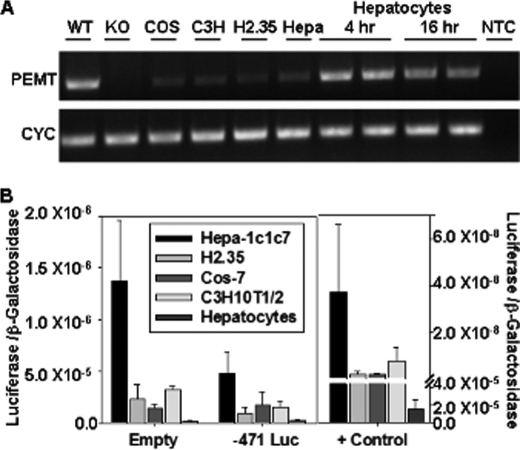
Despite the important role that PEMT plays in hepatic lipid metabolism, very little is known about its transcriptional regulation. Therefore, the goal of this study was to identify promoter elements and trans-acting factors that regulate expression of the Pemt gene. Previous research on this topic was impeded by the lack of immortalized cell lines that express PEMT. We found very low levels of PEMT mRNA in several immortalized cell lines, including the monkey kidney cell line COS-7, the mouse hepatoma cell lines H2.35 and Hepa-1c1c7, and the mouse embryonic fibroblast cell line C3H10T1/2 (Fig. 1A). PEMT is highly expressed in the liver making primary cultures of mouse hepatocytes an obvious choice for studies on gene expression. However, although PEMT mRNA levels are initially high in primary cultures of mouse hepatocytes (Fig. 1A), expression decreases rapidly within 16 h of isolation. These results are consistent with the de-differentiation of hepatocytes that occurs in culture (28). When each cell type was transiently transfected with luciferase reporter construct −471 luciferase containing the mouse Pemt promoter (−471 to +130), the luciferase activity was lower than that from the promoter-less parent pGL3 basic (empty) plasmid (Fig. 1B). Because luciferase activity was detected at high levels in each cell type when the reporter gene was under the control of a strong SV40 promoter (pGL3 control), the low level of luciferase activity was not due to inefficient transfection efficiency. Therefore, the low level of Pemt gene expression observed in both immortalized cell lines and primary cultures of mouse hepatocytes was not sufficient to investigate promoter function.
FIGURE 1.
Expression of PEMT in various cell types. A, total RNA was extracted from COS-7 (COS), C3H10T1/2 (C3H), H2.35, Hepa-1c1c7 (Hepa) cells, and primary mouse hepatocytes, reverse-transcribed to cDNA, and Pemt and cyclophilin (CYC) mRNAs were detected by PCR. Amplicons were visualized with ethidium bromide on a 2% agarose gel. Duplicate samples of isolated primary adult mouse hepatocytes were collected 4 and 16 h post-isolation. Total RNA was isolated from the liver of adult male PEMT wild type (WT) and knock-out (KO) mice for positive and negative controls, respectively. A nontemplate control (NTC) represents a negative control for PCR in the absence of cDNA template. Results are from a single experiment that was repeated once with similar results. B, cells were transiently transfected in duplicate with −471 luciferase (Luc), the empty pGL3 basic vector as a negative control (empty), or the pGL3 control vector containing the SV40 promoter upstream of luciferase cDNA (+ control) as a positive control for transfection efficiency. Luciferase activity was measured 20–48 h post-transfection and expressed relative to β-galactosidase activity. Values represent the means ± S.E. of three independent experiments.
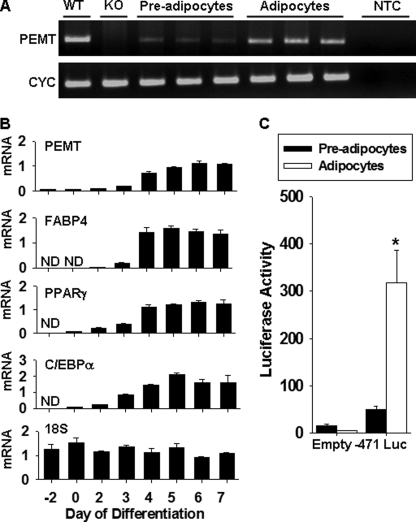
However, PEMT mRNA is expressed in 3T3-L1 mouse embryonic fibroblasts following adipocyte differentiation (Fig. 2, A and B). Analysis of the level of PEMT mRNA by PCR before and after differentiation demonstrated that PEMT mRNA was barely detectable in preadipocytes and increased dramatically (∼20-fold) following differentiation to adipocytes (Fig. 2B). PEMT mRNA levels remained low during the early stages of differentiation and increased markedly by day 4 during the late stage of adipocyte differentiation. This process is characterized by the expression of AP2/FABP4 and follows increased expression of mRNAs encoding peroxisome proliferator-activated receptor γ and CAAT element-binding protein α (Fig. 2B). Consistent with the increase in PEMT mRNA during 3T3-L1 differentiation, we found that luciferase activity from the Pemt promoter increased when 3T3-L1 fibroblasts stably expressing PEMT-luciferase constructs differentiated into adipocytes (Fig. 2C). In contrast, luciferase activity was lower in adipocytes than preadipocytes when 3T3-L1 cells stably expressing pGL3 basic lacking a promoter upstream of the luciferase reporter gene were differentiated. These data establish that 3T3-L1 adipocytes provide a suitable cellular model for identification of elements in the Pemt gene using promoter-activity assays.
FIGURE 2.
Pemt mRNA is increased during 3T3-L1 differentiation to adipocytes. A, total RNA was extracted from triplicate cultures of 3T3-L1 preadipocytes and adipocytes, reverse-transcribed to cDNA, and Pemt and cyclophilin (CYC) mRNAs were detected by PCR. NTC is a nontemplate control (duplicate lanes). Amplicons were visualized with ethidium bromide on a 2% agarose gel. WT, wild type; KO, knock-out. B, 3T3-L1 fibroblasts were differentiated into adipocytes, and cells were collected on the indicated days. Day 0 indicates 2 days at post-confluence and the start of the differentiation protocol. Total RNA was isolated, reverse-transcribed to cDNA and Pemt, FABP4, peroxisome proliferator-activated receptor γ (PPARγ), and CAAT element-binding protein α mRNA levels measured by quantitative PCR. 18 S RNA levels were measured by quantitative PCR by generating a single-stranded DNA template using the reverse primer. mRNA and 18 S RNA levels were normalized to cyclophilin using a standard curve. All data are means ± S.E. from three separate independent experiments. ND refers to nondetectable amplicon within the indicated sample. C, 3T3-L1 fibroblasts were stably transfected with −471 luciferase (Luc) or the empty pGL3 basic vector (Empty) as a negative control. Luciferase activity was measured in preadipocytes and adipocytes and normalized to cellular protein. Values represent means ± S.E. of three separate independent experiments (*, p < 0.05).
Region −471/−371 Is Important for Activation of PEMT mRNA Expression
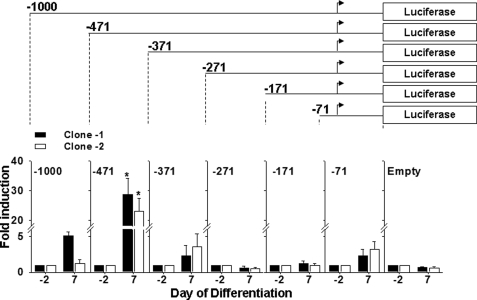
To identify section(s) of the mouse Pemt promoter that may be important for regulating activation of the Pemt gene, we generated 3T3-L1 clones that stably express different sections of the mouse Pemt promoter. Serial deletions from the 5′ end of the Pemt promoter were constructed and ligated into the luciferase reporter gene pGL3 basic, and stable cell lines were created. Luciferase activity was measured before (day −2) and after (day 7) differentiation to adipocytes. Two clones (clone −1 and clone −2) were analyzed for each promoter length and normalized for cell protein, copy number, and level of adipocyte differentiation. Compared with the promoter-less parent vector (pGL3 basic), transfection of −471 luciferase into preadipocytes resulted in no change in luciferase expression (Fig. 3). Following differentiation of 3T3-L1 cells into adipocytes, the −471 luciferase construct exhibited a 20–30-fold increase in luciferase expression. Deletion to −371 bp resulted in the absence of any measurable promoter activity, suggesting that transcription factor-binding sites located in the region between −471 and −371 bp may be important for regulating the activation of Pemt gene expression. Because this promoter region is more active in 3T3-L1 adipocytes than in preadipocytes, subsequent experiments focused on characterization of the sequence between −471 and −371 of the mouse Pemt promoter.
FIGURE 3.
Mouse Pemt promoter region −471/+130 bp is activated during 3T3-L1 differentiation. 3T3-L1 cells stably expressing various lengths of the Pemt promoter upstream of the luciferase reporter gene were generated and differentiated to adipocytes. Cells were collected before (−2) and following (+7) differentiation to adipocytes, and luciferase activity was measured and normalized to cellular protein. The results are reported as fold induction at day 7 compared with luciferase activity at −2 days. Two stable cell lines (clone −1 and clone −2) are shown for each plasmid construct. The negative control was an empty pGL3 basic vector (Empty). Values represent means ± S.E. of four independent experiments (*, p < 0.05).
Identification of Sp- and YY1-binding Sites within the Activation Region of the Pemt Promoter
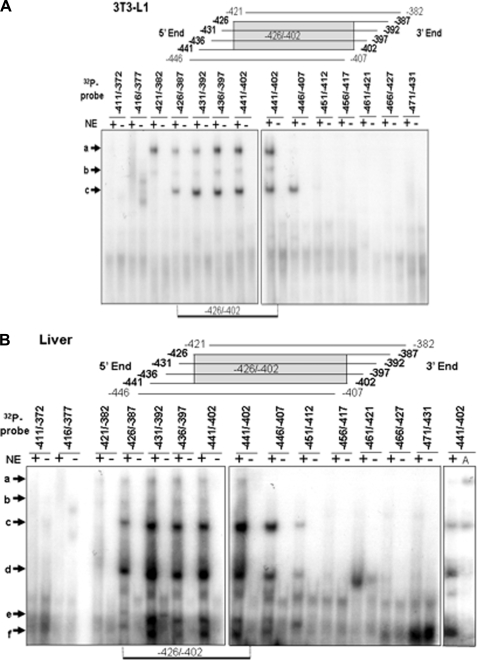
In an attempt to identify the cis-elements responsible for regulating the activation of Pemt gene expression, we utilized EMSA. We used 13 overlapping DNA oligonucleotides from the −471/−371 region to identify the sections that bind nuclear proteins. Each oligonucleotide was labeled with 32Pi and incubated with nuclear extract isolated from 3T3-L1 adipocytes. Three different protein-DNA complexes were generated as indicated by the appearance of bands labeled “a” through “c” (Fig. 4A). DNA oligonucleotides that contained the Pemt promoter region −426 to −402 generated all three DNA-protein complexes.
FIGURE 4.
EMSA analysis of binding of nuclear extracts to Pemt promoter. Sections of the mouse PEMT promoter 40 bp in length were labeled with 32Pi and incubated without (−) or with (+) nuclear extract (NE) isolated from 3T3-L1 adipocytes (A) or mouse liver (B). The resulting DNA-protein complexes (a–f) were separated on 8% polyacrylamide gels and visualized by autoradiography. The results are representative of three independent experiments with similar results. B refers where the nuclear extract is primarily from mouse liver, and A refers to nuclear extract isolated from 3T3-L1 adipocytes.
Comparison of the binding patterns produced with nuclear extracts from mouse liver or 3T3-L1 cells revealed that mouse liver generates three protein-DNA complexes (d–f) that are not detected with nuclear extract from 3T3-L1 cells (Fig. 4B). When a nuclear extract isolated from mouse liver was incubated with the 13 overlapping DNA oligonucleotides, those that contained the Pemt promoter region −426 to −402 generated all six DNA-protein complexes (Fig. 4B). Together these results indicate that nuclear proteins that regulate the trans-activation of the Pemt gene expression might bind the −426 to −402 promoter section. Comparison of the −426 to −402 sequence of the Pemt promoter with the TRANSFAC data base revealed that this region contains two candidate binding sites, one for the Sp family of transcription factors and one for YY1, a member of the gli-Kruppel class of zinc finger transcription factors (29).
Transcription Factors Sp1, Sp3, and YY1 Bind to the Mouse Pemt Promoter
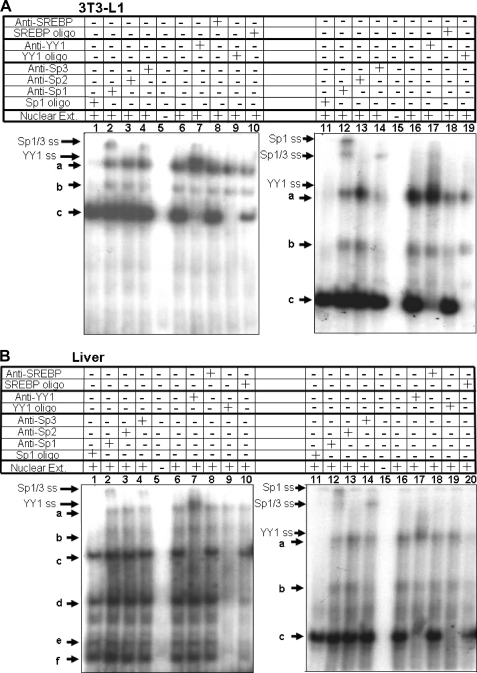
The Sp transcription factor family includes several members (Sp1, Sp2, Sp3, and Sp4) that share significant sequence homology and recognize GC boxes with similar specificity (30). To determine which of these proteins bind to the Pemt promoter, we performed supershift assays with antibodies specific for individual Sp proteins. Antibodies specific for Sp1 were added to an EMSA reaction with the 32Pi-labeled Pemt −441/−402 promoter fragment and nuclear extracts isolated from 3T3-L1 cells (Fig. 5A) and mouse liver (Fig. 5B). In the absence of antibody, incubation of 32Pi-labeled Pemt −441/−402 promoter fragment with nuclear extracts isolated from 3T3-L1 cells generates three different protein-DNA complexes (a–c) (Fig. 5A, lanes 6 and 16). Upon addition of Sp1-specific antibody to the EMSA reaction, the mobility of complex a was retarded such that a new upper band appeared in lane 2 (Fig. 5A, left panel). The accompanying decrease in the intensity of complex a in the presence of anti-Sp1 antibody was detected when complexes were resolved using a 6% nondenaturing polyacrylamide gel (Fig. 5A, lane 12, right panel). The addition of anti-Sp3 antibodies decreased the intensity of complexes a and b with an accompanying supershifted complex (Fig. 5A, lanes 4 and 14). The disappearance of more than one band is likely due to the different isoforms of Sp3 (115, 80, and 78 kDa) (30); the experimental conditions might be unable to resolve the protein-DNA complexes generated by Sp1 from those of full-length Sp3. We further illustrated that both complexes a and b contain Sp family members by adding oligonucleotides corresponding to the consensus GC box (GGGGCGGG) to EMSA reactions. In the presence of the consensus GC box, formation of both complexes was prevented (Fig. 5A, lanes 1 and 11). Together, these results indicate the presence of Sp1 in complex a and Sp3 in complexes a and b. Antibodies raised against Sp2 did not alter the mobility or formation of any complex (Fig. 5A, lanes 3 and 13). Sp4 in the mouse is primarily in the brain and thus is not considered to regulate expression in the liver (30).
FIGURE 5.
Supershift analysis of protein binding to the Pemt promoter using EMSA. The −441/−402 section of the mouse Pemt promoter was labeled with 32Pi and incubated without (−) or with (+) nuclear extract from 3T3-L1 cells (A) or mouse liver (B). Unlabeled oligonucleotides containing the consensus sequence for YY1, the Sp family of transcription factors, or sterol response-element binding protein (SREBP) were added to the binding reaction at 100-fold molar excess, as indicated. Antibodies raised against Sp1, Sp2, Sp3, YY1, or SREBP were used in binding reactions as indicated. Resulting DNA-protein complexes (a–f) and supershifted (SS) complexes (indicated by arrowheads) were separated using 8% (left panel) or 7% (right panel) polyacrylamide gels and visualized by autoradiography. The results are representative of three independent experiments with similar results.
Next, we investigated whether the Pemt promoter interacted with the nuclear protein YY1. Addition of antibodies specific for YY1 to the EMSA reaction reduced the mobility of complex c so that it co-migrated with complex a (Fig. 5A, lanes 7 and 17). The addition of the unlabeled competitor YY1 consensus sequence reduced the appearance of complexes c–f (Fig. 5, A and B, lanes 9 and 19), consistent with results presented in Fig. 5 indicating that the YYI-binding site is important for generating several complexes. However, the supershift with anti-YY1 (Fig. 5A, lanes 7 and 17) suggests that only complex c contains the YY1 protein. Because similar DNA-transcription factor complexes containing Sp1, Sp3, and YY1 are formed with both 3T3-L1 (Fig. 5A) and liver (Fig. 5B) nuclear extracts, similar mechanisms may regulate the Pemt promoter in these cells.
Inhibition of Sp1 Binding to the Mouse Pemt Promoter Increases Pemt Reporter Activity
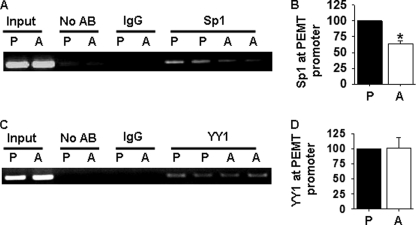
Next, we determined whether Sp1 and/or YY1 protein bound to the Pemt promoter in vivo. We performed chromatin immunoprecipitation assays using preadipocytes and adipocytes to determine the temporal binding pattern of each transcription factor. Sp1 and YY1 were detected at the Pemt promoter before and after differentiation of 3T3-L1 cells (Fig. 6). Significantly fewer Pemt promoter fragments were pulled down by immunoprecipitation of Sp1 in 3T3-L1 adipocytes than in preadipocytes (Fig. 6, A and B), indicating that less Sp1 had bound to the Pemt promoter. In contrast, similar amounts of YY1 protein were present at the Pemt promoter in either preadipocytes or adipocytes (Fig. 6, C and D). The temporal binding pattern of Sp1 to the Pemt promoter is consistent with a regulatory role for Sp1 as an inhibitor of Pemt gene transcription.
FIGURE 6.
Chromatin immunoprecipitation analysis of Sp1 binding to the Pemt promoter. A, in vivo association of Sp1 with the Pemt promoter. Protein-DNA complexes were immunoprecipitated from lysates of 3T3-L1 preadipocytes (P) and adipocytes (A) without or with antibodies (AB) to IgG or Sp1. The Pemt promoter was detected by PCR. DNA purified from sonicated cell lysates was used as a positive control (input). B, results of densitometric analysis of bands from three independent experiments using Sp1 antibody and are means ± S.E. (*, p < 0.05). C, in vivo association of YY1 with the Pemt promoter. Protein-DNA complexes were immunoprecipitated from lysates of 3T3-L1 preadipocytes (P) and adipocytes (A), without or with antibodies (AB) to IgG or YY1. The Pemt promoter was detected by PCR. DNA purified from sonicated cell lysates was used as a positive control (input). D, results of densitometric analysis of bands from three independent experiments using YY1 antibody and are means ± S.E.
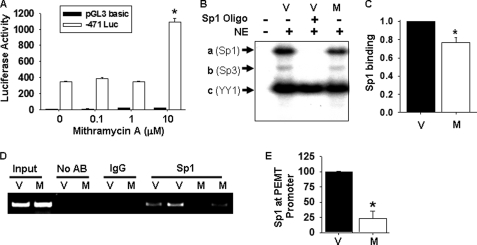
To obtain further support for the proposal that reduction of Sp1 binding at the Pemt promoter increases promoter activity, we used the cell-permeable agent mithramycin A to inhibit the binding of Sp1 to the DNA. Mithramycin A binds to GC-rich DNA sequences, thereby precluding the binding of nuclear proteins, including Sp1 (31). When adipocytes stably expressing −471 luciferase were treated with 10 μm mithramycin A for 24 h, luciferase activity was significantly increased compared with that in vehicle-treated cells (Fig. 7A). The mithramycin A-mediated increase in promoter activity was accompanied by reduced formation of complex, the Sp1-Pemt promoter complex (complex a) in EMSA experiments (Fig. 7B). The amount of Sp1-Pemt complexes generated (complex a) was normalized to the amount of YY1-Pemt promoter complexes (complex c) in an attempt to account for variation in gel loading (Fig. 7C). In addition, significantly fewer Pemt promoter fragments were pulled down by immunoprecipitation of Sp1 in 3T3-L1 adipocytes treated with mithramycin A than with vehicle (Fig. 7, D and E), indicating that less Sp1 had bound to the Pemt promoter. Together, these results suggest that decreased Sp1 binding promotes increased Pemt promoter activity.
FIGURE 7.
Analysis of mithramycin A-mediated inhibition of Sp1 binding to the Pemt promoter. A, 3T3-L1 stably expressing −471 luciferase (Luc) were differentiated to adipocytes and treated with the indicated concentration of mithramycin A (in 1% dimethyl sulfoxide) or vehicle in 10% FBS, DMEM for 24 h. Luciferase activity was normalized to cellular protein. Values are means ± S.E. of three independent experiments (*, p < 0.05). B, 3T3-L1 adipocytes were incubated with vehicle (V) or mithramycin (M, 10 μm) for 24 h. Cells were then washed twice with phosphate-buffered saline. Nuclear extract (NE) was obtained and incubated with 32Pi-labeled Pemt promoter (−441/−402). The resulting DNA-/protein complexes (a–c) were separated on an 8% polyacrylamide gel. A 100-fold molar excess of unlabeled DNA oligonucleotide containing the Sp family consensus sequence was added to the binding reaction as indicated. C, results of densitometric analysis of bands from three independent EMSA experiments are shown as a ratio of intensity of complex a (Sp1) to complex c (YY1) (*, p < 0.05). D, in vivo association of Sp1 with the Pemt promoter. Protein-DNA complexes were immunoprecipitated from lysates of 3T3-L1 adipocytes treated with vehicle (V) or mithramycin (M, 10 μm) for 24 h using antibodies (AB) to IgG or Sp1. The Pemt promoter was detected by PCR. DNA purified from sonicated lysates was used as a positive control (input). E, results of densitometric analysis of band from three independent experiments using Sp1 antibody and are means ± S.E. (*, p < 0.05).
Expression of the Mouse Pemt Gene Is Regulated by SP1 in 3T3-L1 Adipocytes
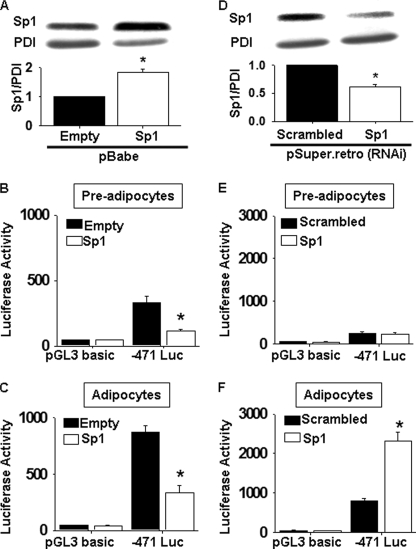
To determine whether Sp1 directly inhibits transcription from the mouse Pemt promoter, Sp1 was overexpressed using a retrovirus containing Sp1 cDNA in preadipocytes that stably express the Pemt promoter construct −471 luciferase. Overexpression of Sp1 significantly reduced the ability of the Pemt promoter construct −471 luciferase to drive luciferase activity in both 3T3-L1 preadipocytes and adipocytes (Fig. 8, B and C), indicating that Sp1 is a negative regulator of the Pemt promoter. To investigate whether reduction of Sp1 protein increased Pemt promoter activity, we constructed retroviruses that contained short hairpin sequences corresponding to Sp1. A 50% decrease in Sp1 protein significantly increased luciferase activity from −471 luciferase in 3T3-L1 adipocytes compared with the scrambled RNA interference control (Fig. 8, D–F). Thus, Sp1 inhibits Pemt promoter activity independent of the differentiation status of the cells. However, the reduction of Sp1 was insufficient to induce Pemt gene transcription in preadipocytes.
FIGURE 8.
Analysis of influence of Sp1 on Pemt promoter/luciferase activity. A, 3T3-L1 preadipocytes stably expressing the pGL3 basic vector without (pGL3 basic) or with the Pemt promoter section −471 to +130 bp (−471 luciferase (Luc)) upstream of the luciferase reporter gene were treated with retrovirus generated from either an empty pBabe vector (Empty, black bars) or pBabe.puro containing cDNA encoding Sp1 (Sp1, white bars). Cell lysates from 3T3-L1 fibroblasts transduced with the indicated virus were immunoblotted with antibodies raised against Sp1 and protein-disulfide isomerase (PDI). Densitometric analysis of immunoblots is shown below the immunoblot. Values represent means of three separate independent experiments. Luciferase activity was measured and normalized to cellular protein in 3T3-L1 preadipocytes (B) and adipocytes (C). D, 3T3-L1 preadipocytes stably expressing the pGL3 basic vector without (pGL3 basic) or with the Pemt promoter section −471 to +130 bp (−471 luciferase) upstream of the luciferase reporter gene were transduced with retrovirus generated from either pSuper.retro. containing scrambled (Scrambled RNAi) or Sp1 (Sp1 RNAi) short hairpin RNA sequences. Luciferase activity was measured in preadipocytes (E) and adipocytes (F) and normalized to cellular protein. Values are means ± S.E. of three independent experiments (*, p < 0.05).
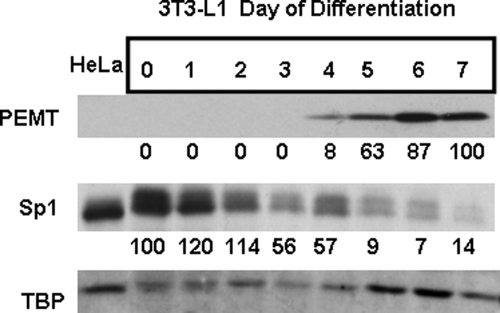
To further address the functional significance of Sp1-mediated regulation of Pemt gene expression during 3T3-L1 differentiation, the temporal expressions of Sp1 and PEMT were evaluated by immunoblot analysis (Fig. 9). The reduction of Sp1 protein levels during 3T3-L1 differentiation is consistent with release of Sp1-mediated inhibition of Pemt gene transcription and thus activation in adipocytes.
FIGURE 9.
Analysis of Sp1, PEMT, and TBP protein levels by immunoblotting. 3T3-L1 fibroblasts were differentiated into adipocytes. Day 0 represents 2 days at post-confluence and the starting point of the differentiation protocol. Cells were harvested at the indicted times (top row of numbers). 3T3-L1 homogenates (50 μg of protein) were separated on 0.4% SDS, 10% polyacrylamide gels, electroblotted on to polyvinylidene fluoride membranes, and probed with antibodies raised against Sp1, PEMT, or TATA-binding protein (TBP). The results are representative of three independent experiments. The numbers below each gel represent the mean of densitometric analysis of three immunoblots relative to the amount of TBP detected. HeLa whole cell lysate (50 μg, Santa Cruz Biotechnology) was used as a positive control for the indicated nuclear proteins.
Inhibition of the Mouse Pemt Promoter by Tamoxifen Is Mediated by Sp1
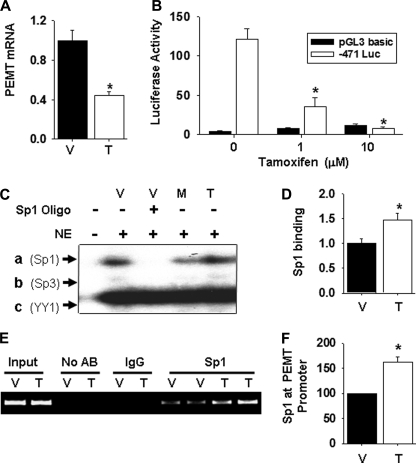
We next examined whether Sp1 binding regulates Pemt gene expression in response to an estrogen receptor modulator. It was recently shown that tamoxifen, a common breast cancer treatment drug, inhibits expression of PEMT in rodents (32). To determine whether we could reproduce this tamoxifen-mediated effect in mice, we injected animals for five consecutive days with either vehicle (sesame oil, 1% benzyl alcohol) or tamoxifen (0.5 mg/kg/day). Analysis of hepatic PEMT mRNA levels by quantitative PCR revealed that following tamoxifen treatment the mRNA level of PEMT was significantly reduced compared with the vehicle (Fig. 10A). When adipocytes stably expressing −471 luciferase were treated with either 1 or 10 μm tamoxifen for 7 days, luciferase activity was significantly decreased compared with that in vehicle-treated cells (Fig. 10B). The tamoxifen-mediated decrease in promoter activity was accompanied by increased formation of the Sp1-Pemt promoter complexes (complex a) in EMSA experiments (Fig. 10, C and D). The amount of Sp1-Pemt promoter complexes generated (complex a) was normalized to the amount of YY1-Pemt promoter complexes (complex c) in an attempt to account for variation in gel loading (Fig. 10D). In addition, significantly more Pemt promoter complexes were pulled down by immunoprecipitation of Sp1 in 3T3-L1 adipocytes treated with tamoxifen than with vehicle (Fig. 10, E and F), indicating that more Sp1 had bound to the Pemt promoter.
FIGURE 10.
Tamoxifen inhibits PEMT expression by increasing Sp1 binding. A, total RNA was extracted from the liver of adult male PEMT wild type mice injected subcutaneously with either tamoxifen (0.5 mg/kg/day in sesame oil, 1% benzyl alcohol) or vehicle for 5 consecutive days. The RNA was reverse-transcribed to cDNA, and Pemt mRNA levels were detected by quantitative PCR. mRNA levels were normalized to cyclophilin using a standard curve. Data represents means ± S.E. (*, p < 0.05, n = 5–7 mice). B, 3T3-L1 stably expressing −471 luciferase (Luc) were differentiated to adipocytes and treated with the indicated concentration of tamoxifen (in 1% dimethyl sulfoxide) or vehicle in 10% FBS, DMEM for 7 days. Luciferase activity was normalized to cellular protein. Values are means ± S.E. of three independent experiments (*, p < 0.05). C, 3T3-L1 adipocytes were incubated with vehicle (V) or tamoxifen (T, 10 μm) for 7 days or mithramycin (M, 10 μm) for 24 h. Cells were then washed twice with phosphate-buffered saline. Nuclear extract was obtained and incubated with 32Pi-labeled Pemt promoter (−441/−402). DNA-protein complexes (a–c) were separated on an 8% polyacrylamide gel. A 100-fold molar excess of unlabeled DNA oligonucleotide containing the Sp family consensus sequence was added to the binding reaction as indicated. D, densitometric analysis of results of three independent EMSA experiments are shown as a ratio of intensity of complex a (Sp1) to the intensity of complex c (YY1) (*, p < 0.05). E, in vivo association of Sp1 with the Pemt promoter. Protein-DNA complexes were immunoprecipitated from lysates of 3T3-L1 adipocytes treated with vehicle (V) or tamoxifen (T, 10 μm) for 7 days using antibodies (AB) to IgG or Sp1. The Pemt promoter was detected by PCR. DNA purified from sonicated lysates was used as a positive control (input). F, results of densitometric analysis of band from three independent experiments using Sp1 antibody and are means ± S.E. (*, p < 0.05).
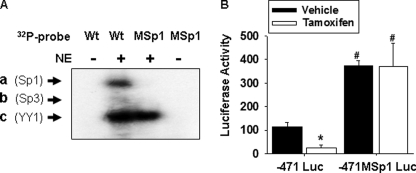
To confirm that tamoxifen was inhibiting Pemt promoter activity via the Sp1-binding site, we mutated the GC element (5′-GGGAAGG-3′) by replacing two guanine nucleotides with adenine (5′-GGGAAA-3′). We demonstrated that this mutation prevented Sp1 binding to the Pemt promoter in EMSA experiments. The −442 to −402 section of the Pemt promoter was 32Pi-labeled and incubated with nuclear extract to generate the three different protein-DNA complexes observed previously (Fig. 11A). When we 32Pi-labeled the −441 to −402 section of the Pemt promoter containing a mutation within the Sp1-binding site (MSp1), the formation of Sp1 containing complexes was prevented, indicating the inability to bind Sp1 protein (Fig. 11A). When adipocytes stably expressing −471MSp1 luciferase were treated with tamoxifen, there was no change in luciferase activity compared with the vehicle control (Fig. 11B). Therefore, the tamoxifen-mediated decrease in Pemt promoter activity requires the Sp1-binding site. Together, these results establish that tamoxifen inhibits Pemt gene expression by promoting Sp1 binding to the promoter.
FIGURE 11.
Tamoxifen requires the Sp1-binding site to inhibit Pemt gene expression. A, −441/−402 section of the mouse promoter containing the wild type GC element (Wt) or the mutated GC element (MSp1) was 32Pi-labeled and incubated without (−) or with nuclear extract (NE) from mouse liver (+). Resulting DNA-protein complexes (a–c) were separated using an 8% polyacrylamide gel and visualized by autoradiography. The results are representative of three independent experiments. B, 3T3-L1 adipocytes stably expressing −471 luciferase (Luc) or −471MSp1 luciferase (containing a mutation in the Sp1-binding site) were differentiated to adipocytes and treated with 10 μm tamoxifen (in 1% dimethyl sulfoxide) or vehicle in 10% FBS, DMEM for 7 days. Luciferase activity was normalized to cellular protein. Values are means ± S.E. of three independent experiments (*, p < 0.05 compared with 3T3-L1 adipocytes stably expressing −471 luciferase treated with vehicle; #, p < 0.05, compared with 3T3-L1 adipocytes stably expressing −471 luciferase treated with vehicle or tamoxifen, analysis of variance).
DISCUSSION
Sp1 Is an Inhibitor of Pemt Gene Transcription
Sp1 is responsible for recruiting basal transcriptional machinery to TATA-less promoters (33–35) as well as acting as an activator or an inhibitor at target promoters (36–39). We have found that Sp1 regulates Pemt gene expression in 3T3-L1 cells by acting as a transcriptional repressor. Sp1 has previously been shown to promote repression of target genes by recruiting histone deacetylases both directly (37) and indirectly (36, 40, 41) to specific promoters. Typically, Sp1 physically interacts with several nuclear proteins in a dynamic complex to perform transcriptional repression (42) as well as de-repression and activation (40). The complexity of Pemt gene expression during 3T3-L1 adipogenesis was apparent from our observation that reduction in Sp1 protein was not sufficient to release repression of Pemt gene transcription in preadipocytes. It is likely that Sp1 is only part of the transcriptional machinery that cooperatively inhibits Pemt gene expression, and thus modification of additional repressors might limit regulation by Sp1. This mechanism could potentially include the transcription factors YY1 and Sp3 because they physically interact with Sp1 in some cell types (43, 44). However, we determined that the amount of YY1 binding at the Pemt promoter remained similar before and after activation of Pemt gene transcription, thus suggesting that the abundance of YY1 protein does not regulate PEMT expression in adipocytes. The activation of PEMT in 3T3-L1 adipocytes might also be promoted upon binding of an activation complex that is expressed during adipogenesis. Although the decrease in Sp1 is required for Pemt gene expression during differentiation, the finding that a decrease in Sp1 is not sufficient precludes the likelihood that decreasing Sp1 in other immortalized cell models or primary mouse hepatocytes will promote Pemt gene expression. There is also evidence for additional regulation upstream of the −471-bp section of the mouse Pemt promoter. When we extended the length of the PEMT promoter upstream of the luciferase reporter gene from −471 to −1000 bp (Fig. 3), transcriptional activation was prevented suggesting additional repressor binding sites.
Implications for Transcriptional Regulation of the Pemt Gene in Mouse Liver
Our results demonstrate that elements of the transcriptional regulation of the Pemt promoter may be conserved between mouse liver and 3T3-L1 cells. In gel shift assays, Sp1, Sp3, and YY1 proteins from mouse liver nuclear extract bound to the Pemt promoter. Sp1 regulates the transcription of other genes involved in hepatic lipid metabolism (45), including PC metabolism (23, 38). Sp1 regulates CTP:phosphocholine cytidylyltransferase expression during the cell cycle, and another enzyme in the CDP-choline pathway, choline kinase, may also be regulated by Sp1 because two putative binding sites have been recently identified (46). The CDP-choline pathway is typically up-regulated in the liver when PEMT activity is repressed, for example during hepatic regeneration (47) and growth (20, 48, 49). The inverse transcriptional regulation of Pemt gene expression and the CDP-choline pathway could potentially be achieved with the contribution of Sp1. For example, such coordinate regulation might promote the synthesis of PC via the CDP-choline pathway during rapid proliferation and through the PEMT pathway in quiescent cells. We observed the highest levels of Sp1 protein in 3T3-L1 cells during rapid proliferation, which is consistent with previous reports of cell cycle-dependent regulation of Sp1 (50, 51). Thus, Sp1-mediated repression of Pemt gene expression may be part of a cellular response to promote growth.
We have observed three additional transcription factor-Pemt promoter complexes in the EMSAs with nuclear extract from liver but not with nuclear extract from 3T3-L1 cells, suggesting that liver-specific expression of the Pemt gene might, in part, be controlled by these factors. We have been unable to identify these factors but have ruled out binding sites for NF1, Chop, CAAT element-binding protein, GATA, SF1, MycMax, HNF1, HNF3/6, liver X receptor, glucocorticoid receptor, signal transducers and activators of transcription, peroxisome proliferator-activated receptor, SMAD, CHREBP, NFκβ, NFAT, NKX2.5, and SREBP (data not shown). Because tamoxifen binds estrogen receptors (ER) (52) and recent evidence has suggested that estrogen activates Pemt gene transcription (21), we introduced a double-stranded oligonucleotide containing the estrogen receptor element in gel mobility experiments, but this also did not alter the binding pattern of nuclear factors to the Pemt promoter.
Alternatively, our data established that the Sp1-binding site was required for tamoxifen-mediated inhibition of Pemt promoter activity. In support of this finding, it is known that estrogen and tamoxifen can affect expression from genes lacking a classical ER element (53–55). Specifically, it has been determined that only 11% of genes regulated by estrogen/estrogen receptor modulators contain a classical ER element (53). The remainder of genes appear to be regulated by AP1, Sp1, FOXA1, or NFκB promoter sites (53). Gene regulation by nonclassical ER signaling events is complex, including physical interactions between ER and other transcription factors (54, 56), ER-mediated changes in expression levels of regulatory factors (57, 58), and post-translational modification of nuclear proteins via intracellular signaling cascades (e.g. cAMP/protein kinase A, mitogen-activated protein kinase (MAPK)/phosphatidylinositol 3-kinase) (55, 59, 60). Although the upstream signaling events remain to be elucidated, our results clearly establish that activation of ER by tamoxifen promotes the assembly of an Sp1 inhibitory complex at the Pemt promoter. In conclusion, this study demonstrates that the −471 to +130 section of the Pemt promoter is essential for Pemt gene expression in 3T3-L1 adipocytes and establishes that Sp1 transcriptionally regulates Pemt gene expression in adipocytes under native conditions and in response to tamoxifen treatment.
Acknowledgments
We thank Vernon Dolinsky, Chieko Aoyama, David Shields, Jean Vance, and Claudia Banchio for helpful advice and discussion.
This work was supported in part by Canadian Institutes of Health Research Grant MOP 5182.
- PC
- phosphatidylcholine
- EMSA
- electrophoretic mobility shift assay
- ER
- estrogen receptor
- PE
- phosphatidylethanolamine
- PEMT
- PE N-methyltransferase
- DMEM
- Dulbecco's modified Eagle's medium
- FBS
- fetal bovine serum
- RIPA
- radioimmune precipitation assay buffer.
REFERENCES
- 1.Vance D. E., Vance J. E. (eds) (2008) Biochemistry of Lipids, Lipoproteins and Membranes, 5th Ed., pp. 214–244, Elsevier B. V., San Diego, CA [Google Scholar]
- 2.Vance D. E., Ridgway N. D. (1988) Prog. Lipid Res. 27, 61–79 [DOI] [PubMed] [Google Scholar]
- 3.Bremer J., Greenberg D. M. (1960) Biochim. Biophys. Acta 37, 173–175 [DOI] [PubMed] [Google Scholar]
- 4.Cui Z., Vance J. E., Chen M. H., Voelker D. R., Vance D. E. (1993) J. Biol. Chem. 268, 16655–16663 [PubMed] [Google Scholar]
- 5.Shields D. J., Lehner R., Agellon L. B., Vance D. E. (2003) J. Biol. Chem. 278, 2956–2962 [DOI] [PubMed] [Google Scholar]
- 6.DeLong C. J., Shen Y. J., Thomas M. J., Cui Z. (1999) J. Biol. Chem. 274, 29683–29688 [DOI] [PubMed] [Google Scholar]
- 7.Reo N. V., Adinehzadeh M., Foy B. D. (2002) Biochim. Biophys. Acta 1580, 171–188 [DOI] [PubMed] [Google Scholar]
- 8.Sundler R., Akesson B. (1975) J. Biol. Chem. 250, 3359–3367 [PubMed] [Google Scholar]
- 9.Walkey C. J., Yu L., Agellon L. B., Vance D. E. (1998) J. Biol. Chem. 273, 27043–27046 [DOI] [PubMed] [Google Scholar]
- 10.Noga A. A., Zhao Y., Vance D. E. (2002) J. Biol. Chem. 277, 42358–42365 [DOI] [PubMed] [Google Scholar]
- 11.Noga A. A., Vance D. E. (2003) J. Biol. Chem. 278, 21851–21859 [DOI] [PubMed] [Google Scholar]
- 12.Saadeh S. (2007) Nutr. Clin. Pract. 22, 1–10 [DOI] [PubMed] [Google Scholar]
- 13.Loria P., Lonardo A., Targher G. (2008) Clin. Sci. 115, 1–12 [DOI] [PubMed] [Google Scholar]
- 14.Glass C. K., Witztum J. L. (2001) Cell 104, 503–516 [DOI] [PubMed] [Google Scholar]
- 15.Li Z., Agellon L. B., Vance D. E. (2005) J. Biol. Chem. 280, 37798–37802 [DOI] [PubMed] [Google Scholar]
- 16.Li Z., Agellon L. B., Allen T. M., Umeda M., Jewell L., Mason A., Vance D. E. (2006) Cell Metab. 3, 321–331 [DOI] [PubMed] [Google Scholar]
- 17.Zhao Y., Su B., Jacobs R. L., Kennedy B., Francis G. A., Waddington E., Brosnan J. T., Vance J. E., Vance D. E. (2009) Arterioscler. Thromb. Vasc. Biol. 29, 1349–1355 [DOI] [PubMed] [Google Scholar]
- 18.Walkey C. J., Cui Z., Agellon L. B., Vance D. E. (1996) J. Lipid Res. 37, 2341–2350 [PubMed] [Google Scholar]
- 19.Ince T. A., Scotto K. W. (1995) J. Biol. Chem. 270, 30249–30252 [DOI] [PubMed] [Google Scholar]
- 20.Cui Z., Shen Y. J., Vance D. E. (1997) Biochim. Biophys. Acta 1346, 10–16 [DOI] [PubMed] [Google Scholar]
- 21.Resseguie M., Song J., Niculescu M. D., da Costa K. A., Randall T. A., Zeisel S. H. (2007) FASEB J. 21, 2622–2632 [DOI] [PMC free article] [PubMed] [Google Scholar]
- 22.Klaunig J. E., Goldblatt P. J., Hinton D. E., Lipsky M. M., Chacko J., Trump B. F. (1981) In Vitro 17, 913–925 [DOI] [PubMed] [Google Scholar]
- 23.Banchio C., Schang L. M., Vance D. E. (2004) J. Biol. Chem. 279, 40220–40226 [DOI] [PubMed] [Google Scholar]
- 24.Andrews N. C., Faller D. V. (1991) Nucleic Acids Res. 19, 2499. [DOI] [PMC free article] [PubMed] [Google Scholar]
- 25.Deryckere F., Gannon F. (1994) BioTechniques 16, 405. [PubMed] [Google Scholar]
- 26.Jordan M., Wurm F. (2004) Methods 33, 136–143 [DOI] [PubMed] [Google Scholar]
- 27.Spencer V. A., Sun J. M., Li L., Davie J. R. (2003) Methods 31, 67–75 [DOI] [PubMed] [Google Scholar]
- 28.Baker T. K., Carfagna M. A., Gao H., Dow E. R., Li Q., Searfoss G. H., Ryan T. P. (2001) Chem. Res. Toxicol. 14, 1218–1231 [DOI] [PubMed] [Google Scholar]
- 29.Shi Y., Seto E., Chang L. S., Shenk T. (1991) Cell 67, 377–388 [DOI] [PubMed] [Google Scholar]
- 30.Suske G. (1999) Gene 238, 291–300 [DOI] [PubMed] [Google Scholar]
- 31.Miller D. M., Polansky D. A., Thomas S. D., Ray R., Campbell V. W., Sanchez J., Koller C. A. (1987) Am. J. Med. Sci. 294, 388–394 [DOI] [PubMed] [Google Scholar]
- 32.Lelliott C. J., López M., Curtis R. K., Parker N., Laudes M., Yeo G., Jimenez-Liñan M., Grosse J., Saha A. K., Wiggins D., Hauton D., Brand M. D., O'Rahilly S., Griffin J. L., Gibbons G. F., Vidal-Puig A. (2005) FASEB J. 19, 1108–1119 [DOI] [PubMed] [Google Scholar]
- 33.Pugh B. F., Tjian R. (1991) Genes Dev. 5, 1935–1945 [DOI] [PubMed] [Google Scholar]
- 34.Boyer T. G., Krug J. R., Maquat L. E. (1989) J. Biol. Chem. 264, 5177–5187 [PubMed] [Google Scholar]
- 35.Lin S. Y., Black A. R., Kostic D., Pajovic S., Hoover C. N., Azizkhan J. C. (1996) Mol. Cell. Biol. 16, 1668–1675 [DOI] [PMC free article] [PubMed] [Google Scholar]
- 36.Kim S., Kang J. K., Kim Y. K., Seo D. W., Ahn S. H., Lee J. C., Lee C. H., You J. S., Cho E. J., Lee H. W., Han J. W. (2006) Biochem. Biophys. Res. Commun. 342, 1168–1173 [DOI] [PubMed] [Google Scholar]
- 37.Doetzlhofer A., Rotheneder H., Lagger G., Koranda M., Kurtev V., Brosch G., Wintersberger E., Seiser C. (1999) Mol. Cell. Biol. 19, 5504–5511 [DOI] [PMC free article] [PubMed] [Google Scholar]
- 38.Banchio C., Schang L. M., Vance D. E. (2003) J. Biol. Chem. 278, 32457–32464 [DOI] [PubMed] [Google Scholar]
- 39.Roder K., Kim K. H., Sul H. S. (2002) Biochem. Biophys. Res. Commun. 294, 63–70 [DOI] [PubMed] [Google Scholar]
- 40.Zhang Y., Liao M., Dufau M. L. (2006) Mol. Cell. Biol. 26, 6748–6761 [DOI] [PMC free article] [PubMed] [Google Scholar]
- 41.Feng D., Kan Y. W. (2005) Proc. Natl. Acad. Sci. U.S.A. 102, 9896–9900 [DOI] [PMC free article] [PubMed] [Google Scholar]
- 42.Chang Y. C., Illenye S., Heintz N. H. (2001) Mol. Cell. Biol. 21, 1121–1131 [DOI] [PMC free article] [PubMed] [Google Scholar]
- 43.Lee J. S., Galvin K. M., Shi Y. (1993) Proc. Natl. Acad. Sci. U.S.A. 90, 6145–6149 [DOI] [PMC free article] [PubMed] [Google Scholar]
- 44.Zhang Y., Dufau M. L. (2003) Mol. Cell. Biol. 23, 6958–6972 [DOI] [PMC free article] [PubMed] [Google Scholar]
- 45.Douglas D. N., Dolinsky V. W., Lehner R., Vance D. E. (2001) J. Biol. Chem. 276, 25621–25630 [DOI] [PubMed] [Google Scholar]
- 46.Aoyama C., Ishidate K., Sugimoto H., Vance D. E. (2007) Biochim. Biophys. Acta 1771, 1148–1155 [DOI] [PubMed] [Google Scholar]
- 47.Houweling M., Cui Z., Tessitore L., Vance D. E. (1997) Biochim. Biophys. Acta 1346, 1–9 [DOI] [PubMed] [Google Scholar]
- 48.Pelech S. L., Power E., Vance D. E. (1983) Can. J. Biochem. Cell Biol. 61, 1147–1152 [DOI] [PubMed] [Google Scholar]
- 49.Sesca E., Perletti G. P., Binasco V., Chiara M., Tessitore L. (1996) Biochem. Biophys. Res. Commun. 229, 158–162 [DOI] [PubMed] [Google Scholar]
- 50.Grinstein E., Jundt F., Weinert I., Wernet P., Royer H. D. (2002) Oncogene 21, 1485–1492 [DOI] [PubMed] [Google Scholar]
- 51.Kutoh E., Margot J. B., Schwander J. (1999) Cancer Lett. 136, 187–194 [DOI] [PubMed] [Google Scholar]
- 52.Singh M. N., Martin-Hirsch P. L., Martin F. L. (2008) Med. Sci. Monit. 14, RA144–RA148 [PubMed] [Google Scholar]
- 53.Levy N., Tatomer D., Herber C. B., Zhao X., Tang H., Sargeant T., Ball L. J., Summers J., Speed T. P., Leitman D. C. (2008) Mol. Endocrinol. 22, 287–303 [DOI] [PMC free article] [PubMed] [Google Scholar]
- 54.Safe S., Kim K., Kim K. (2008) J. Mol. Endocrinol. 41, 263–275 [DOI] [PMC free article] [PubMed] [Google Scholar]
- 55.Zhang D., Trudeau V. L. (2006) Comp. Biochem. Physiol. 144, 306–315 [DOI] [PubMed] [Google Scholar]
- 56.Dong J., Tsai-Morris C. H., Dufau M. L. (2006) J. Biol. Chem. 281, 18825–18836 [DOI] [PubMed] [Google Scholar]
- 57.Lai K., Harnish D. C., Evans M. J. (2003) J. Biol. Chem. 278, 36418–36429 [DOI] [PubMed] [Google Scholar]
- 58.Dong S., Zhang Z., Takahara H. (2007) Mol. Endocrinol. 21, 1617–1629 [DOI] [PubMed] [Google Scholar]
- 59.Qin C., Samudio I., Ngwenya S., Safe S. (2004) Mol. Carcinog. 40, 160–170 [DOI] [PubMed] [Google Scholar]
- 60.Ngwenya S., Safe S. (2003) Endocrinology 144, 1675–1685 [DOI] [PubMed] [Google Scholar]


