Abstract
Intestinal barrier function is reduced in inflammatory bowel disease (IBD). Tumor necrosis factor (TNF) and interleukin (IL)-13, which are up-regulated in IBD, induce barrier defects that are associated with myosin light chain kinase (MLCK) activation and increased claudin-2 expression, respectively, in cultured intestinal epithelial monolayers. Here we report that these independent signaling pathways have distinct effects on tight junction barrier properties and interact in vivo. MLCK activation alters size selectivity to enhance paracellular flux of uncharged macromolecules without affecting charge selectivity and can be rapidly reversed by MLCK inhibition. In contrast, IL-13-dependent claudin-2 expression increases paracellular cation flux in vitro and in vivo without altering tight junction size selectivity but is unaffected by MLCK inhibition in vitro. In vivo, MLCK activation increases paracellular flux of uncharged macromolecules and also triggers IL-13 expression, claudin-2 synthesis, and increased paracellular cation flux. We conclude that reversible, MLCK-dependent permeability increases cause mucosal immune activation that, in turn, feeds back on the tight junction to establish long-lasting barrier defects. Interactions between these otherwise distinct tight junction regulatory pathways may contribute to IBD pathogenesis.
Keywords: Cell/Epithelial, Cytokines/Action, Cytokines/Tumor Necrosis Factor, Organisms/Mouse, Tissue/Organ Systems/Intestine, Tissue/Organ Systems/Epithelium
Introduction
Many symptoms of inflammatory bowel disease (IBD),4 including diarrhea, nutrient malabsorption, and intestinal protein loss, can be attributed to defective epithelial transport and barrier function. The latter, which is defined by the tight junction, may be regulated by both physiological and pathophysiological stimuli. Studies in cultured monolayers and animal models have demonstrated that tumor necrosis factor (TNF), which is central to Crohn disease pathogenesis, causes tight junction barrier dysfunction via a process that requires myosin light chain kinase (MLCK) activation (1, 2). Consistent with involvement of this pathway in human disease, MLCK activity is increased in intestinal epithelia of patients with active IBD (3). Additional cytokines also influence intestinal epithelial barrier function and several of these, including LIGHT and IL-1β, do so in an MLCK-dependent fashion that is similar to TNF (4–6). However, other cytokines, including IL-13, have been reported to reduce tight junction barrier function by inducing epithelial apoptosis and stimulating synthesis of claudin proteins, such as claudin-2 (7–8). This appears to be relevant to human disease, as lamina propria mononuclear cell IL-13 production and epithelial claudin-2 expression are increased in ulcerative colitis and Crohn disease (7, 8). In addition, in vivo studies show that IL-13 is a critical mediator of tissue fibrosis in chronic inflammatory disease (9, 10).
Because TNF-induced barrier loss occurs rapidly (11), whereas in vitro IL-13-induced barrier loss develops over longer intervals (7, 8), we have proposed that these cytokines might be responsible for either rapid and reversible tight junction regulation or more durable barrier loss, respectively (12). However, the complexities of in vivo human disease have prevented further exploration of this hypothesis.
To define the consequences of MLCK-dependent tight junction regulation in vivo, we recently developed transgenic mice with intestinal epithelial-specific expression of constitutively active MLCK (CA-MLCK) (13). These mice demonstrated increased intestinal paracellular permeability to uncharged macromolecules that was completely corrected by MLCK inhibition. However, overall growth and development of these mice was normal, and they did not develop spontaneous disease. Nevertheless, these transgenic mice did display subtle evidence of mucosal immune activation and, when studied using an adoptive transfer model of colitis, developed more severe disease than non-transgenic littermates (13).
Our ongoing studies of the barrier defects in CA-MLCK transgenic mice demonstrated altered tight junction ion selectivity, with increased Na+ permeability, within colonic mucosa. Although this might have been a direct effect of MLCK-dependent myosin II regulatory light chain (MLC) phosphorylation, analyses of cultured intestinal epithelial monolayers failed to demonstrate increased Na+ permeability as a result of CA-MLCK expression or TNF-dependent MLCK activation. In contrast, IL-13 increased Na+ permeability of cultured intestinal epithelial monolayers by mechanisms that required claudin-2 synthesis. Moreover, expression of both mucosal IL-13 and epithelial claudin-2 was elevated in CA-MLCK transgenic mice. These data suggest that in vivo MLCK activation causes tight junction barrier regulation by two distinct mechanisms: direct cytoskeletal regulation and indirect immune-mediated claudin-2 regulation. These studies therefore provide new insight into the interplay between distinct mechanisms of epithelial barrier regulation and mucosal immune activation in vivo.
EXPERIMENTAL PROCEDURES
Cell Culture
Caco-2BBe and T84 intestinal epithelial cells were grown on collagen-coated polycarbonate Transwells (Corning Life Sciences, Corning, NY). Caco-2BBe cells expressing CA-MLCK under control of a tet-off inducible expression system were maintained in medium with doxycycline, as previously described (14). CA-MLCK expression was induced 3 weeks after plating by transfer to culture medium without doxycycline. Medium with 50 ng/ml of doxycycline was used to completely suppress expression. T84 cells were maintained in a 1:1 mixture of Dulbecco's modified Eagle's and Ham's F-12 medium (15). Cytokines (R&D Systems, Minneapolis, MN), LY 294002 (Cayman Chemical, Ann Arbor, MI), suberoylanilide hydroxamic acid (SAHA; Cayman Chemical), and Z-VAD-fmk (EMD Chemicals, Gibbstown, NJ) were added to basolateral medium. PIK, a highly specific membrane-permeant inhibitor of MLCK, was applied apically (2).
Electrophysiology
Transepithelial resistance (TER) and dilution potential measurements of cultured monolayers were made using a standard current clamp (University of Iowa Bioengineering, Iowa City, IA), as previously described (11). T84 monolayers were studied 10 days after plating and NaCl dilution potentials were determined from the shift in the reversal potential after replacing apical or basolateral medium with medium in which 260 mm mannitol was substituted for the Ham's F-12 NaCl. Dilution potentials of Caco-2BBe monolayers in Hanks' balanced salt solution were determined similarly, by substituting 110 mm mannitol for 55 mm NaCl. PNa+/PCl− was determined using the Goldmann-Hodgkin-Katz equation, known Na+ and Cl− concentrations, and measured dilution potentials. Liquid junction potentials, measured using cell-free Transwells, were <0.1 mV. For experiments in which sterility was required over extended intervals, TER was monitored using an epithelial voltohmmeter (World Precision Instruments, Sarasota, FL).
Mouse colonic tissue was analyzed in Ussing chambers with 0.3-cm2 surface area (Physiologic Instruments, San Diego, CA) using 3 m KCl electrodes. Where indicated recombinant murine IL-13 (1 μg, PreproTech, Rocky Hill, NJ) was injected intraperitoneally 12 h prior to tissue harvest. Recording buffers contained 118 mm NaCl, 5 mm KCl, 1 mm CaCl2, 1.2 mm MgSO4, 2 mm NaH2PO4, 10 mm HEPES, 10 mm glucose, and 22 mm NaHCO3, pH 7.4, and were continuously bubbled with 95% O2 and 5% CO2 at 37 °C. Acquire and Analyze 2.3 software was used to calculate resistance from the potential generated with 50 μA square wave current pulses. NaCl dilution potentials were obtained after replacing apical or basolateral buffers with buffer in which 59 mm NaCl was replaced with 118 mm mannitol. Complete solution equilibration and diffusion into tissue spaces occurred in less than 10 min. KCl electrode-medium liquid junction potentials of −1.2 ± 0.1 mV were subtracted from dilution potential recordings. PNa+/PCl− was calculated as above.
Dextran Flux
Flux of fluorescein isothiocyanate-labeled 4-kDa dextran (FITC-dextran; 1 mg/ml) across cultured monolayers was determined in the apical to basolateral direction, as previously described (11). Mucosal to serosal FITC flux (0.5 mg/ml) was assessed in mouse proximal colon segments mounted in Ussing chambers. FITC concentrations were determined using a standard curve and fluorescent plate reader (BioTek, Winooski, VT).
Immunoblotting
Cell lysates were separated by SDS-PAGE and transferred to polyvinylidene difluoride membranes, as described previously (16). Immunoblots were performed using antibodies to occludin, claudin-1, claudin-2, claudin-4 (Invitrogen), STAT-1, STAT-3, STAT-6, Akt, or phosphorylated proteins STAT-1 (tyrosine 701), STAT-3 (tyrosine 705), STAT-6 (tyrosine 641), and Akt (serine 473) (Cell Signaling Technology, Boston, MA) followed by horseradish peroxidase-conjugated secondary antibodies (Cell Signaling Technology). Proteins were detected by enhanced chemiluminescence and densitometry performed using ImageJ software (17).
Immunofluorescent Staining and Microscopy
Monolayers were fixed with 1% paraformaldehyde and stained as previously described using antibodies to cleaved caspase-3 (Biocare Medical, Concord, CA). Tight junction proteins were detected in monolayers fixed with −20 °C methanol and bis(sulfosuccinimidyl)suberate, as previously described (18), to preserve intracellular vesicles. Immunostains of mouse intestine were performed as previously described (13). In all cases, Alexa dye-conjugated secondary antibodies (Molecular Probes) were used. Multidimensional imaging was performed using an epifluorescence microscope (DMLB; Leica Microsystems, Bannockburn, IL) equipped with a 63× NA 1.32 PL APO oil immersion objective, an 88000 filter set (Chroma Technology, Rockingham, VT), and a Retiga EXI camera (QImaging, Surrey, BC, Canada) controlled by MetaMorph 7 (Molecular Devices, Sunnyvale, CA). Z-stacks were collected in 0.2-μm steps and deconvolved using AutoDeblur X (Media Cybernetics, Bethesda, MD).
Claudin-2 Knockdown
T84 cells were transfected with Lipofectamine 2000 (Invitrogen) and either claudin-2-targeted (sense sequence GGUAGCAGGUGGAGUCUUUUU) or control small interfering RNA (siRNA) (Dharmacon, Lafayette, CO) as previously described (19). Confluent monolayers were treated with cytokines after 3 days. TER and dilution potentials were measured on the fifth day after siRNA transfection.
Quantitative Reverse Transcription-PCR
Cultured monolayers were harvested in RLT buffer (Qiagen, Valencia, CA). Proximal colon was minced and sonicated in TRIzol (Invitrogen) followed by chloroform extraction. In both cases, RNA was purified using the RNeasy Mini Kit with DNase treatment (Qiagen). Reverse transcription reaction with poly(T) primers was performed using the Protoscript First Strand cDNA synthesis kit (New England Biolabs, Ipswitch, MA). Transcript expression from each gene of interest was determined using SYBR Green real time PCR (Bio-Rad) and validated primers designed to amplify 75–250-base pair products spanning intron-exon boundaries. Data for each sample were normalized to glyceraldehyde-3-phosphate dehydrogenase transcript levels prior to group analysis.
Human Biopsies
All patient materials for this study were obtained under a University of Chicago Institutional Review Board approved protocol. Formalin-fixed, paraffin-embedded tissue from biopsy specimens of patients with ulcerative colitis as well as normal biopsies obtained during screening colonoscopies were immunohistochemically stained for claudin-2 expression as previously reported (20).
Statistical Analysis
Student's t test was used to compare means, with statistical significance taken as p ≤ 0.05. Error bars show mean ± S.E.
RESULTS
Intestinal Epithelial Expression of Constitutively Active Myosin Light Chain Kinase Alters Colonic Epithelial Tight Junction Ion Selectivity in Vivo
We recently reported a transgenic mouse that expresses CA-MLCK under control of the intestinal epithelial-specific 9kB villin promoter (13, 21). This CA-MLCK expression augments MLC phosphorylation within colonic epithelia and also increases in vivo paracellular flux of uncharged macromolecules (13) in a manner consistent with previous in vitro and in vivo studies of MLCK-dependent tight junction regulation (1–2, 14, 22). Importantly, the increased macromolecular flux that is present in these transgenic mice can be normalized by the specific MLCK inhibitor PIK (13). Intestinal epithelial proliferative and apoptotic rates are not affected by CA-MLCK expression (13).
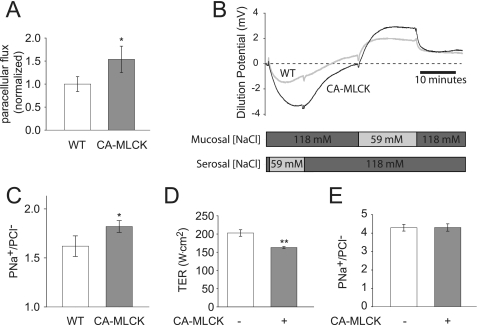
To better characterize paracellular barrier function in CA-MLCK transgenic mice, colonic segments were mounted in Ussing chambers. This demonstrated increased flux of the paracellular probe FITC (Fig. 1A), consistent with in vivo analyses of macromolecular barrier function in these mice (13). Ion selectivity was assessed using dilution potentials and demonstrated a symmetrical increase in permeability of Na+ (PNa+) relative to PCl− (Fig. 1, B and C). To determine whether transcellular Na+ transport pathways, such as those mediated by Na+-H+ exchangers (NHE1, NHE2, and NHE3) or the epithelial Na+ channel, contributed to the observed change in PNa+, these transporters were inhibited with 200 μm amiloride. This had no effect on PNa+/PCl− in colons from wild type or CA-MLCK transgenic mice (data not shown). Thus, the increased dilution potentials observed are due to increased paracellular permeability of Na+ relative to Cl− (Fig. 1C).
FIGURE 1.
CA-MLCK expression alters tight junction ion selectivity in vivo but not in vitro. A, paracellular FITC flux was increased by 54 ± 29% in the proximal colon of CA-MLCK (gray bar) transgenic mice relative to wild type (WT) littermates (white bar) (n = 8 wild type and 6 CA-MLCK mice). B, dilution potentials were recorded and mucosal and serosal NaCl concentrations were varied as indicated. Representative tracings from CA-MLCK (black line) and wild type (gray line) proximal colon are shown. C, PNa+/PCl−, calculated from stable dilution potentials, was elevated in CA-MLCK transgenic mice (gray bar) relative to wild type (WT) littermates (white bars) (n = 18 wild type and 13 CA-MLCK mice). D, induction of CA-MLCK expression (gray bar) reduced TER in Caco-2 monolayers. E, CA-MLCK expression (gray bar) in Caco-2 monolayers had no effect on ion selectivity (*, p ≤ 0.05; **, p ≤ 0.01, S.E.).
CA-MLCK Expression Affects Barrier Function, but Not Ion Selectivity, of Cultured Intestinal Epithelia
To better define the mechanism by which PNa+/PCl− was increased in the colon of CA-MLCK mice, Caco-2 intestinal epithelial monolayers expressing CA-MLCK were studied. CA-MLCK expression increases paracellular permeability of uncharged macromolecules in these monolayers (14), but ion selectivity has not been studied. Although CA-MLCK expression reduced TER of cultured intestinal epithelial monolayers (Fig. 1D), PNa+/PCl− was unaffected (Fig. 1E). Thus, although MLCK activation and MLC phosphorylation increase global paracellular ion flux, they do not alter tight junction ion selectivity in vitro. This suggests that factors present in intact mucosa, but absent in cultured epithelial monolayers, may be responsible for the observed effects of CA-MLCK expression on ion selectivity in vivo.
Tumor Necrosis Factor and Interleukin-13 Reduce TER Similarly but Have Distinct Effects on Paracellular Ion and Size Selectivity
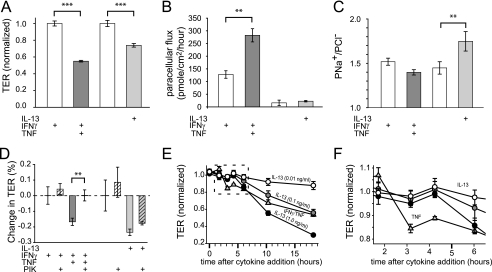
One major difference between native mucosa and cultured epithelial monolayers is the presence of immune cells and their products in the former. Importantly, mucosal TNF is elevated in CA-MLCK transgenic mice (13). The effects of TNF on transepithelial resistance and paracellular flux of uncharged macromolecules have been well studied in vitro (2, 11, 23). However, TNF has not been reported to affect PNa+/PCl− (24). To directly assess the effects of TNF on PNa+/PCl−, T84 intestinal epithelial monolayers were studied following pre-conditioning with IFNγ (for 24 h to induce TNF receptor expression (16)). TNF caused TER to fall by 45 ± 1% within 4 h (Fig. 2A) and increased paracellular dextran flux (Fig. 2B). However, there was no significant effect on ion selectivity (Fig. 2C). Consistent with previous studies (25), there was no increase in apoptosis following TNF treatment. Thus, like CA-MLCK expression in cultured intestinal epithelial monolayers, in vitro TNF treatment reduced TER and increased macromolecular flux without altering ion selectivity or inducing apoptosis.
FIGURE 2.
IL-13 and TNF cause barrier dysfunction by different mechanisms. A, TNF (dark gray bar; 2.5 ng/ml) and IL-13 (light gray bar; 0.1 ng/ml) reduced TER of T84 monolayers cells at 4 and 12 h, respectively. Prior to TNF treatment, monolayers were cultured with IFNγ (white bar; 2.5 ng/ml) for 24 h to induce TNF receptor expression, which also reduced TER. TER was normalized to untreated controls (3.06 ± 0.22 kΩ cm2) for IL-13 or IFNγ-treated controls (1.83 ± 0.02 kΩ cm2) for TNF-induced changes. B, TNF (dark gray bar), but not IL-13 (light gray bar), increased the paracellular permeability of 4-kDa dextran. Note that IFNγ pretreatment (white bar) alone also caused an increase in 4-kDa dextran permeability, consistent with the observed effect on TER. C, IL-13 (light gray bar), but not TNF (dark gray bar), increased PNa+/PCl− of T84 monolayers. D, the specific MLCK inhibitor PIK (all hatched bars; 330 μm) corrected barrier dysfunction after TNF (dark gray hatched bars), but not IL-13 (light gray hatched bars), treatments. E, barrier dysfunction induced by TNF (triangles; 2.5 ng/ml) developed more rapidly than after IL-13 treatment (circles; 0.1, 1, or 10 ng/ml, as indicated). F, data for the first 5 h after cytokine treatment (from E) demonstrate a dose-independent delay in TER loss induced by IL-13 relative to TNF. IL-13-induced barrier dysfunction occurred between 4 and 6 h, whereas TNF-induced barrier dysfunction was first apparent between 2 and 3 h after initiation of cytokine treatment (**, p ≤ 0.01; ***, p ≤ 0.001, S.E.).
IL-13 has also been reported to alter tight junction barrier function in vitro (7, 8, 26). IL-13 treatment of T84 monolayers reduced TER (Fig. 2A). Moreover, IL-13 caused an increase in PNa+/PCl− (Fig. 2C) similar to that observed in CA-MLCK transgenic mice. However, IL-13 had no effect on paracellular macromolecular flux (Fig. 2B). Thus, despite similar effects on TER, TNF and IL-13 had distinct effects on tight junction size and charge selectivity. Moreover, MLCK inhibition restored TER of TNF-treated monolayers but had no effect on TER of IL-13-treated monolayers (Fig. 2D). MLCK inhibition also failed to affect ion selectivity of control, TNF-, or IL-13-treated monolayers (data not shown). Thus, whereas MLCK is central to TNF-induced increases in macromolecular flux, it does not play a role in IL-13-induced barrier regulation in vitro. This indicates that these cytokines exert their effect by different signaling pathways, a conclusion that is supported by the observation that IL-13-induced TER loss developed over an extended period, even at doses 100-fold greater than the minimal IL-13 concentration required to reduce TER, relative to that induced by TNF (Fig. 2, E and F).
TNF and IL-13 Have Unique Effects on Epithelial mRNA and Protein Content
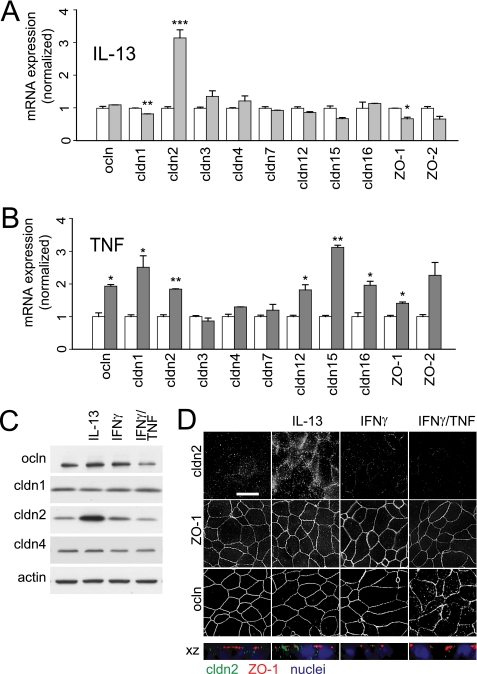
To better understand the molecular events responsible for the qualitative differences in barrier dysfunction induced by TNF and IL-13, mRNA transcript and tight junction protein content were assessed (Fig. 3, A–C). Consistent with previous reports (7, 8), IL-13 caused a marked increase in claudin-2 mRNA and protein expression (Fig. 3, A and C). The newly synthesized claudin-2 protein was associated with tight junctions and was also present within intracellular vesicular structures (Fig. 3D). TNF treatment increased the content of mRNA encoding occludin, claudin-1, claudin-2, claudin-12, claudin-15, claudin-16, and ZO-1 (Fig. 3B), but increases in claudin or ZO-1 protein expression were not detected by immunoblot or immunofluorescence microscopy (Fig. 3, C and D), and overall occludin content was decreased (Fig. 3C; p < 0.05) and occludin was redistributed from the tight junction to intracellular vesicles (Fig. 3D). Thus, IL-13 causes a quantitative increase in tight junction-associated claudin-2, whereas TNF reduces tight junction-associated occludin.
FIGURE 3.
TNF and IL-13 have unique effects on epithelial mRNA and tight junction protein expression. A, qRT-PCR shows a specific increase in claudin-2 mRNA after IL-13 treatment (0.1 ng/ml for 12 h; light gray bars). Data are normalized to identical monolayers not treated with IL-13 (white bars). B, qRT-PCR shows that TNF treatment (2.5 ng/ml for 4 h; dark gray bars) increases mRNA expression of occludin, ZO-1, and claudins-1, -2, -12, -15, and -16. Data are normalized to identical monolayers preincubated with IFNγ (2.5 ng/ml for 24 h) but not exposed to TNF (white bars). C, immunoblots show a 308 ± 58% increase in claudin-2 protein expression and 60 ± 18% reduction in occludin protein content after IL-13 or TNF treatment, respectively. Actin was used as a loading control. D, IL-13 increased claudin-2 localization at the tight junction and within peri-tight junction cytoplasmic vesicles, but did not affect occludin or ZO-1 distribution. In contrast, TNF caused occludin internalization but had no effect on claudin-2 expression or localization. ZO-1 distribution was not affected by either cytokine. Bar, 10 μm (*, p ≤ 0.05; **, p ≤ 0.01, S.E.).
IL-13-dependent Barrier Regulation Does Not Require Apoptosis or Phosphatidylinositol 3-Kinase Activation, but May Involve STAT6
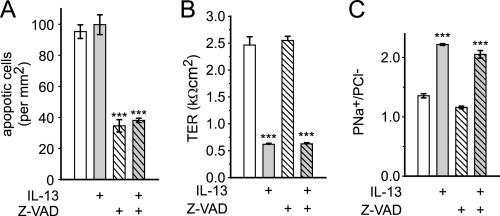
Epithelial apoptosis has been suggested to be partly responsible for IL-13-induced barrier loss (7). However, even after 24 h of treatment with a high dose (1.0 ng/ml) of IL-13, there was no increase in epithelial apoptosis (Fig. 4A). In addition, although the broad spectrum caspase inhibitor Z-VAD reduced the magnitude of apoptosis by 64 ± 4 and 62 ± 1% in control and IL-13-treated monolayers, respectively (Fig. 4A), it had no effect on TER or ion selectivity in either condition (Fig. 4, B and C). Thus, apoptosis is not required for the observed IL-13-induced barrier dysfunction.
FIGURE 4.
IL-13-induced barrier regulation does not require epithelial apoptosis. A, apoptosis was assessed by cleaved caspase 3 detection. Even at high doses (light gray bars; 1 ng/ml for 24 h), IL-13 did not induce epithelial apoptosis. Z-VAD (all hatched bars; 50 μm) reduced apoptosis in control and IL-13-treated T84 monolayers to the same degree. B and C, neither TER nor PNa+/PCl− were affected by Z-VAD (all hatched bars) after high dose IL-13 treatment (gray bars). Results were similar with lower IL-13 doses (0.1 ng/ml, not shown) (***, p ≤ 0.001, S.E.).
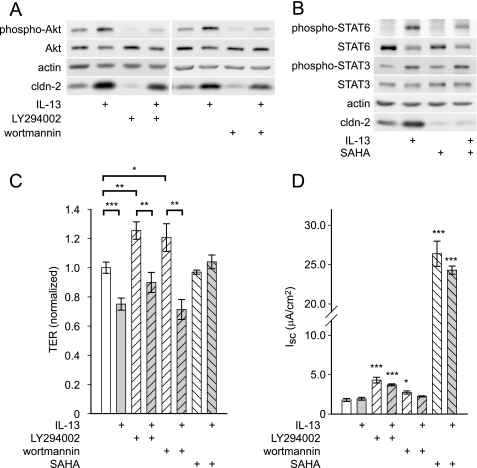
Given that apoptosis could be ruled out, intracellular signaling pathways were considered as potential mechanisms of the IL-13 effect on barrier function. Phosphatidylinositol 3-kinase (PI3K) has been reported to mediate this effect, possibly via phosphorylation of Akt (7, 26). Consistent with these previous reports, IL-13 increased phosphorylation of Akt to 363 ± 86% of control (p < 0.05, Fig. 5A). Although PI3K inhibition with LY294002 (Fig. 5A) decreased claudin-2 expression, IL-13-induced increases in claudin-2 expression were not prevented (increase of 199% without drug versus 230% with drug). Similar results were observed with the PI3K inhibitor wortmannin (claudin-2 increased 177% without drug versus 171% with drug). Thus, PI3K inhibition does not limit the ability of IL-13 to induce epithelial claudin-2 expression.
FIGURE 5.
IL-13-induced barrier regulation does not require PI3K but may be involve STAT6 activation. A, IL-13 (1 ng/ml for 12 h) induced Akt phosphorylation. Inhibition of PI3K by LY294002 (50 μm) or wortmannin (100 nm) reduced claudin-2 expression in control, but had no effect on IL-13-induced increases in claudin-2 expression. B, IL-13 (1 ng/ml for 12 h) induced STAT6, phosphorylation, decreased total STAT6, and increased phosphorylation of STAT3. SAHA (5 μm) reduced phosphorylation of STAT6 and dramatically reduced claudin-2 expression in control monolayers and after IL-13 treatment. C, SAHA (5 μm, all downward hatched bars) but not inhibition of PI3K (all upward hatched bars), with LY294002 (50 μm) or wortmannin (100 nm), prevented IL-13-induced TER loss. TER was normalized to control monolayers. D, LY294002, SAHA, and wortmannin induced changes in short circuit current, precluding accurate assessment of PNa+/PCl− in the presence of these agents (*, p ≤ 0.05; **, p ≤ 0.01; ***, p ≤ 0.001; ns, not significant, S.E.).
In addition to PI3K, IL-13 has been reported to activate STAT proteins in intestinal epithelial cells (7, 26). IL-13 increased phosphorylation of STAT6 and STAT3 by 302 ± 16 (p < 0.001) and 95 ± 30% (p < 0.05), respectively (Fig. 5B). IL-13 also decreased total STAT6 protein to 32 ± 6% (p < 0.05) of control, consistent with compensatory degradation of the activated form. STAT1 was unaffected by IL-13 (data not shown).
The contribution of STAT proteins to IL-13-induced barrier dysfunction is controversial, primarily because specific STAT inhibitors are not available. However, STAT6 activation requires histone deacetylase activation (27), and the histone deacetylase inhibitor SAHA has been shown to prevent STAT6 activation in T cells (28). SAHA reduced IL-13 induced STAT6 phosphorylation by 50 ± 3% (p < 0.05) (Fig. 5B) without affecting STAT3 phosphorylation. SAHA also prevented IL-13-induced increases in claudin-2 expression, suggesting that STAT6 may be involved in this process (p < 0.01).
To test the ability of these inhibitors to prevent barrier dysfunction, T84 monolayers were treated with IL-13 in the presence and absence of SAHA, LY294002, or wortmannin. PI3K inhibition induced small increases in TER. However, LY294002 (Fig. 5C), wortmannin (Fig. 5C), and PI3K inhibitor VII (data not shown) all failed to prevent IL-13-induced TER loss (Fig. 5C). In contrast, whereas SAHA had no effect on baseline TER, it completely eliminated TER loss after IL-13 treatment (Fig. 5C). The ability of SAHA and PI3K inhibitors to prevent increased PNa+/PCl− could not be assessed, as these agents all induced significant increases in transepithelial short circuit current (Isc) (Fig. 5D). This is not unexpected, as histone deacetylase inhibition modifies expression of many proteins, and PI3K is known to be an important regulator of chloride secretion (29). These data show that there is no role of the PI3K pathway in IL-13-induced barrier regulation. In contrast, SAHA reduces STAT6 phosphorylation and blocks claudin-2 induction as well as TER loss, which suggests a potential role for STAT6.
Increased Claudin-2 Expression Is Entirely Responsible for IL-13-induced Changes in Ion Selectivity but Is Only Partially Responsible for IL-13-induced TER Loss
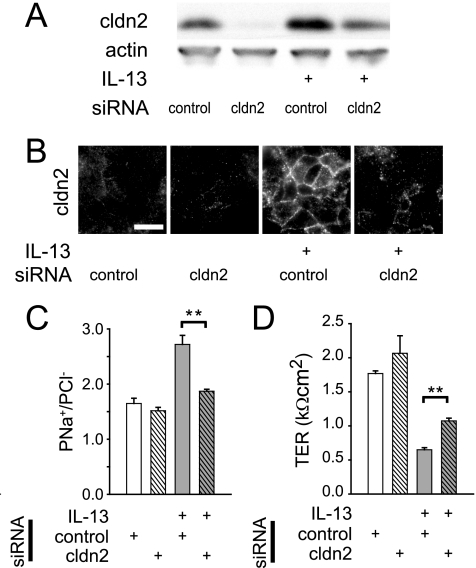
Claudin-2 overexpression by transfection has been shown to reduce TER of Madin-Darby canine kidney cell monolayers without increasing paracellular permeability to 4 kDa dextran (30). A separate study, also in Madin-Darby canine kidney monolayers, showed that claudin-2 expression preferentially increases paracellular cation conductance (31). It was therefore reasonable to hypothesize that IL-13-induced claudin-2 expression could have caused both decreased TER and increased PNa+/PCl−. To test this, claudin-2 expression was blocked by transfection of T84 monolayers with claudin-2-targeted siRNA. This reduced claudin-2 expression to nearly undetectable levels, whereas control siRNA had no effect (Fig. 6A). Claudin-2-targeted siRNA significantly prevented IL-13-induced increases in claudin-2 expression (Fig. 6A; p < 0.05), and immunofluorescence microscopy demonstrated that claudin-2-targeted siRNA limited IL-13-induced increases in claudin-2 expression, both at the tight junction and within intracellular pools (Fig. 6B). Thus, claudin-2-targeted siRNA transfection reduces claudin-2 expression of IL-13-treated monolayers to that of control monolayers (not treated with IL-13).
FIGURE 6.
siRNA knockdown of claudin-2 reduces IL-13-mediated barrier dysfunction. A, claudin-2 protein content was reduced by 71 ± 7 and 58 ± 1% in the absence and presence of IL-13 (2 ng/ml), respectively, by claudin-2-targeted siRNA (relative to control siRNA). B, claudin-2-targeted siRNA prevented IL-13-induced increases in tight junction-associated claudin-2. Bar, 10 μm. C, claudin-2-targeted siRNA (all hatched bars) blocked IL-13-induced (light gray bars) increases in PNa+/PCl−. D, siRNA-mediated claudin-2 knockdown (all hatched bars) inhibited only a small fraction of IL-13-induced (light gray bars) TER loss (**, p ≤ 0.01, S.E.).
Monolayers transfected with claudin-2-targeted siRNA had PNa+/PCl− similar to that of non-transfected control monolayers (Fig. 2C), as well as monolayers transfected with control siRNA (Fig. 6C). Moreover, control siRNA transfection did not reduce the effect of IL-13 treatment on PNa+/PCl− (Fig. 6C). However, the IL-13-induced increase in PNa+/PCl− was completely blocked by claudin-2-targeted siRNA (Fig. 6C). Thus, the altered ion selectivity observed in IL-13-treated monolayers is entirely due to increased claudin-2 expression. Although claudin-2-targeted siRNA reduced the magnitude of IL-13-induced TER loss by 15 ± 2%, the majority of IL-13-induced TER loss was not prevented by claudin-2-targeted siRNA transfection (Fig. 6D). Thus, claudin-2 expression is entirely responsible for IL-13-induced increases in paracellular Na+ permeability but only partially responsible for IL-13-induced TER loss.
Interleukin-13 Induces Claudin-2 Expression and Increased PNa+/PCl− in Vivo
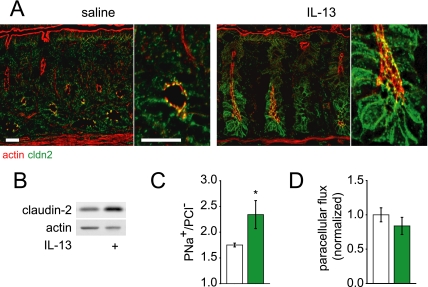
To assess the significance of IL-13-induced claudin-2 expression in vivo, mice were injected intraperitoneally with IL-13 and colonic epithelial claudin-2 expression was assessed after 12 h. In the absence of IL-13 treatment, claudin-2 expression was concentrated at tight junctions in crypt epithelial cells (Fig. 7A, saline injected). However, after IL-13, claudin-2 expression was dramatically increased at tight junctions, lateral membranes, and within cytoplasmic vesicles (Fig. 7A, 12 h, 1 μg of IL-13). Increased expression is most evident in the lower half of the crypts, but was also apparent in surface colonocytes. Western blots of isolated colonic epithelial cells showed that overall claudin-2 expression was increased to 209 ± 21% of control (Fig. 7B; p < 0.01). Moreover, IL-13 treatment increased PNa+/PCl− in vivo (Fig. 7C) without altering macromolecular flux (Fig. 7D). Thus, IL-13 induces claudin-2 expression in vivo, and, similar to cultured monolayers, claudin-2 expression is associated with increased Na+ permeability without increased paracellular macromolecular flux.
FIGURE 7.
IL-13-induced claudin-2 expression alters tight junction ion selectivity in vivo. A, 12 h after intraperitoneal injection of 1 μg of murine IL-13, immunofluorescent staining revealed increased claudin-2 (green) expression compared with saline-injected control mice. F-actin (red) is shown for orientation. Bar, 20 μm. B, immunoblots show that colonocytes isolated from IL-13-treated mice express 209 ± 21% as much claudin-2 relative to controls (n = 5, saline; n = 5, IL-13 injected). Actin was used as a loading control. C, PNa+/PCl−, calculated from stable apical dilution potentials after changing apical NaCl concentration from 118 to 59 mm, was increased after IL-13 injection (n = 6, saline, white; n = 5, IL-13 injected, green). D, paracellular FITC flux was unchanged after IL-13 injection (n = 5, saline, white; n = 5, IL-13 injected, green) (*, p ≤ 0.05, S.E.).
Claudin-2 and IL-13 Expression Are Increased in Colonic Mucosa of CA-MLCK Transgenic Mice
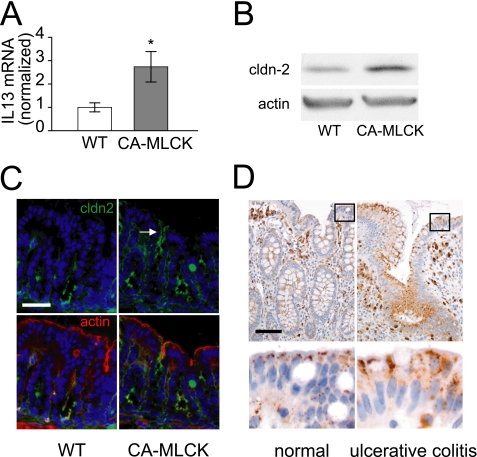
The in vitro and in vivo data above suggest that the increased colonic PNa+/PCl− in CA-MLCK transgenic mice may be explained by IL-13-induced claudin-2 expression. Consistent with this hypothesis, colonic mucosal IL-13 mRNA was increased 174 ± 65% (Fig. 8A) and colonocyte claudin-2 protein expression was increased by 206 ± 7% (Fig. 8B; p < 0.01) in CA-MLCK transgenic mice relative to wild type littermates. Morphological analysis showed that claudin-2 expression was increased within surface colonocytes of CA-MLCK transgenic mice (Fig. 8C). This pattern of increased claudin-2 expression is similar to that observed in IL-13-treated mice and in colonic biopsies from human IBD patients (Fig. 8D). Together with the in vitro data, these observations suggest that the increased mucosal IL-13 expression is responsible for the increased claudin-2 expression and PNa+/PCl− in colons of CA-MLCK transgenic mice. Moreover, these data demonstrate that, in vivo, MLCK-induced increases in tight junction permeability to macromolecules is sufficient to trigger mucosal IL-13 expression, epithelial claudin-2 expression, and increased Na+ permeability.
FIGURE 8.
Claudin-2 (green) and IL-13 expression are increased in CA-MLCK mice. A, mucosal IL-13 mRNA transcripts are increased in CA-MLCK transgenic mice (gray bars) relative to wild type littermates (white bars). B, claudin-2 expression in colonocytes from CA-MLCK transgenic mice was markedly increased compared with wild type (WT) littermates. C, claudin-2 (green) expression was limited to crypt epithelium in wild type mice but was also present in surface colonocytes of CA-MLCK transgenic mice (arrow). Bar, 40 μm. F-actin (red) and nuclei (blue) are shown for orientation. D, claudin-2 staining was increased in surface colonocytes in biopsies from patients with ulcerative colitis relative to colon biopsies from healthy subjects. Bar, 40 μm (*, p ≤ 0.05, S.E.).
DISCUSSION
Small intestinal permeability to uncharged macromolecules is elevated in a minority of healthy first-degree relatives of Crohn disease patients, suggesting a role for barrier dysfunction in IBD pathogenesis (32, 33). Barrier defects may also precede disease reactivation from clinical remission (34, 35). Some of these barrier defects have been linked to TNF, as cytokine-neutralizing antibodies restore barrier function in Crohn disease patients (36). Moreover, both in vitro and in vivo studies have demonstrated that TNF-dependent barrier regulation requires intestinal epithelial MLCK activation (1–2, 37), and MLCK activity is increased in intestinal epithelia from IBD patients (3). We recently developed a transgenic mouse expressing CA-MLCK within the intestinal epithelium to define the contributions of MLCK-dependent barrier regulation to Crohn disease pathogenesis (13). These mice demonstrated increased colonic paracellular permeability to uncharged macromolecules similar to the increased permeability observed in healthy first degree relatives of Crohn disease patients (13, 32, 38).
Here we report detailed analysis of ion selectivity and demonstrate increased PNa+/PCl− in colons of CA-MLCK transgenic mice. We initially considered this to be a direct effect of CA-MLCK expression. However, neither CA-MLCK expression nor TNF treatment of cultured intestinal epithelial monolayers altered ion selectivity. We therefore hypothesized that the effects of CA-MLCK expression on colonic paracellular ion selectivity might reflect interactions with non-epithelial cell types or their products, neither of which are present in vitro. IL-13 was a logical candidate, as it has been reported to reduce barrier function of cultured intestinal epithelial cells and is elevated in the mucosa of ulcerative colitis and Crohn disease patients (7). Our data show that IL-13 is able to increase PNa+/PCl− of cultured intestinal epithelial monolayers and mouse colon in a manner similar to that observed in CA-MLCK transgenic mice, but this change in ion selectivity is not due to MLCK activation. Moreover, IL-13 did not increase paracellular permeability to uncharged macromolecules in vitro or in vivo. However, consistent with previous reports (7, 8), IL-13 did increase claudin-2 expression in cultured epithelial monolayers and mouse colonocytes, and siRNA knockdown demonstrated that claudin-2 expression was required for IL-13-dependent regulation of ion selectivity. Nevertheless, only a small fraction of overall TER loss was prevented by claudin-2 knockdown, suggesting that other mechanisms also contribute to the effect of IL-13 on overall ion conductance.
We sought to define the signal transduction events responsible for IL-13-induced claudin-2 expression and TER loss. In contrast to previous studies (8, 26), we found no evidence for a role of PI3K activation or epithelial apoptosis, although the histone deacetylase inhibitor SAHA reduced STAT6 phosphorylation and also blocked both claudin-2 up-regulation and TER loss. While this supports a role for STAT6 in IL-13-induced barrier regulation, the data must be interpreted with caution, as SAHA also has dramatic effects on transcellular ion transport, and, therefore, is a blunt tool for analysis of signal transduction.
The difference between our study and previous publications with respect to IL-13-induced apoptosis may be explained by the use of lower concentrations of IL-13 (1 ng/ml) for 24 h here compared with as much as 100 ng/ml for 48 h in other studies (7, 8, 26). These differences in IL-13 dose may also account for the differences in efficacy of PI3K inhibitors here relative to prior studies (8, 26). Alternatively, differences may be explained by our observation that PI3K inhibition increased TER and reduced claudin-2 expression in the absence of IL-13. In contrast to other studies showing that LY294002 increased TER of IL-13-treated monolayers (8), we assessed the relative changes in TER and claudin-2 expression induced by IL-13 treatment and showed that these were unaffected by PI3K inhibition.
The in vitro studies clearly show that the altered colonic ion selectivity in CA-MLCK transgenic mice could not be explained by MLC phosphorylation. Moreover, they show that IL-13-induced claudin-2 expression can cause similar increases in PNa+/PCl−. We therefore assessed claudin-2 and IL-13 expression in isolated colonocytes and colonic mucosa, respectively. Both were elevated in CA-MLCK transgenic mice. These data therefore suggest that, although increased paracellular permeability to macromolecules is the primary effect of colonic epithelial CA-MLCK expression (13), in vivo responses to epithelial MLCK activation include mucosal IL-13 production, which induces epithelial claudin-2 expression and a secondary component of ion-selective barrier dysfunction.
The data demonstrate that despite having similar effects on TER, IL-13 and TNF have markedly different effects on barrier function. TNF increases macromolecular flux without altering charge selectivity, whereas IL-13 alters charge selectivity without affecting macromolecular flux (Table 1). IFNγ also induces barrier dysfunction on its own, and is functionally similar to TNF, in that it reduces TER and increases macromolecular flux (Fig. 2), but ion selectivity was unchanged. This is consistent with a previous report (39), although the mechanism does not appear to involve MLCK and has recently been shown to involve AMP-activated kinase (40, 41).
TABLE 1.
Distinctions between effects of TNF and IL-13 on epithelial barrier function and tight junction composition
| TNF | IL-13 | |
|---|---|---|
| Ion conductance | Increased | Increased |
| Macromolecular flux | Increased | No change |
| Ion selectivity | No change | Increased PNa+ |
| MLCK dependent | Yes | No |
| Claudin-2 expression | No change | Increased |
| Occludin endocytosis | Yes | No change |
| Apoptosis rate | No change | No change |
Based on an evolving model of the tight junction as a structure that contains multiple types of paracellular paths with differing biophysical characteristics (31, 39, 42–45), the data therefore suggest that IFNγ and TNF increase conductance across a pathway that allows large solutes but is not ion selective, whereas IL-13 increases flux across ion-selective small pores. Consistent with increased flux across a non-ion selective pathway, TNF did cause a noticeable, although statistically insignificant, shift of PNa+/PCl− toward unity (Fig. 2).
At least in part, IL-13-induced paracellular pores are established by claudin-2. In contrast, TNF does not appear to increase the net expression or tight junction association of any identified protein. However, it is clear that TNF alters tight junction composition by endocytosis of specific proteins, most prominently occludin (1, 11). Thus, one might speculate that TNF-induced occludin removal causes transient leaks to develop, whereas claudin-2 expression after IL-13 treatment increases the number of small pores.
These results have important implications for human disease. TNF is involved in both Crohn disease and ulcerative colitis (36, 46–49). In contrast, although IL-13 is up-regulated in Crohn disease (7), the increases associated with ulcerative colitis are far greater (7, 50–52). Thus, the differences in barrier dysfunction induced by these cytokines in vitro and in vivo may make distinct contributions to disease pathogenesis (Table 2). Our data show that increased flux across the ion nonselective, large solute leak pathway triggered by MLCK activation results in increased mucosal IL-13 synthesis. This enhances epithelial claudin-2 expression and increases flux across ion-selective pores. This is, therefore, the first example of immune-mediated cross-talk between the leak and pore pathways that govern tight junction permeability. These observations provide new insight into barrier regulation and the effects of disease on tight junction structure and function. Such data are critical to our eventual understanding of the roles of specific forms of barrier dysregulation in disease.
TABLE 2.
Distinctions between mechanisms of in vitro and in vivo barrier dysfunction
| Barrier dysfunction | Mediator | Agonist |
Human correlate | |
|---|---|---|---|---|
| In vitro | In vivo | |||
| Pore | Claudin-2 | IL-13 | IL-13 (1°) CA-MLCK (2°) | Increased claudin-2 expression in IBD |
| Leak | MLCK | TNF CA-MLCK | TNF CA-MLCK (1°) | Increased MLCK expression in IBD |
This work was supported, in whole or in part, by National Institutes of Health Grants R01DK61931, R01DK68271, P01DK67887, F32DK082134, T32HL007237, and T32GM07281, University of Chicago Cancer Center Grant P30CA14599, and a research fellowship award from the Crohn's and Colitis Foundation of America sponsored by Laura McAteer Hoffman.
- IBD
- inflammatory bowel disease
- TNF
- tumor necrosis factor
- MLC
- myosin II regulatory light chain
- MLCK
- myosin light chain kinase
- TER
- transepithelial electrical resistance
- IL
- interleukin
- PI3K
- phosphatidylinositol 3-kinase
- CA
- constitutively active
- SAHA
- suberoylanilide hydroxamic acid
- Z
- benzyloxycarbonyl
- fmk
- fluoromethyl ketone
- FITC
- fluorescein isothiocyanate
- STAT
- signal transducers and activators of transcription
- siRNA
- small interfering RNA
- IFN
- interferon.
REFERENCES
- 1.Clayburgh D. R., Barrett T. A., Tang Y., Meddings J. B., Van Eldik L. J., Watterson D. M., Clarke L. L., Mrsny R. J., Turner J. R. (2005) J. Clin. Invest. 115, 2702–2715 [DOI] [PMC free article] [PubMed] [Google Scholar]
- 2.Zolotarevsky Y., Hecht G., Koutsouris A., Gonzalez D. E., Quan C., Tom J., Mrsny R. J., Turner J. R. (2002) Gastroenterology 123, 163–172 [DOI] [PubMed] [Google Scholar]
- 3.Blair S. A., Kane S. V., Clayburgh D. R., Turner J. R. (2006) Lab. Invest. 86, 191–201 [DOI] [PubMed] [Google Scholar]
- 4.Schwarz B. T., Wang F., Shen L., Clayburgh D. R., Su L., Wang Y., Fu Y. X., Turner J. R. (2007) Gastroenterology 132, 2383–2394 [DOI] [PMC free article] [PubMed] [Google Scholar]
- 5.Turner J. R. (2006) Am. J. Pathol. 169, 1901–1909 [DOI] [PMC free article] [PubMed] [Google Scholar]
- 6.Al-Sadi R., Ye D., Dokladny K., Ma T. Y. (2008) J. Immunol. 180, 5653–5661 [DOI] [PMC free article] [PubMed] [Google Scholar]
- 7.Heller F., Florian P., Bojarski C., Richter J., Christ M., Hillenbrand B., Mankertz J., Gitter A. H., Bürgel N., Fromm M., Zeitz M., Fuss I., Strober W., Schulzke J. D. (2005) Gastroenterology 129, 550–564 [DOI] [PubMed] [Google Scholar]
- 8.Prasad S., Mingrino R., Kaukinen K., Hayes K. L., Powell R. M., MacDonald T. T., Collins J. E. (2005) Lab. Invest. 85, 1139–1162 [DOI] [PubMed] [Google Scholar]
- 9.Fichtner-Feigl S., Strober W., Kawakami K., Puri R. K., Kitani A. (2006) Nat. Med. 12, 99–106 [DOI] [PubMed] [Google Scholar]
- 10.Fichtner-Feigl S., Young C. A., Kitani A., Geissler E. K., Schlitt H. J., Strober W. (2008) Gastroenterology 135, 2003–2013, 2013.e1–7 [DOI] [PubMed] [Google Scholar]
- 11.Wang F., Graham W. V., Wang Y., Witkowski E. D., Schwarz B. T., Turner J. R. (2005) Am. J. Pathol. 166, 409–419 [DOI] [PMC free article] [PubMed] [Google Scholar]
- 12.Weber C. R., Turner J. R. (2007) Gut 56, 6–8 [DOI] [PMC free article] [PubMed] [Google Scholar]
- 13.Su L., Shen L., Clayburgh D. R., Nalle S. C., Sullivan E. A., Meddings J. B., Abraham C., Turner J. R. (2009) Gastroenterology 136, 551–563 [DOI] [PMC free article] [PubMed] [Google Scholar]
- 14.Shen L., Black E. D., Witkowski E. D., Lencer W. I., Guerriero V., Schneeberger E. E., Turner J. R. (2006) J. Cell Sci. 119, 2095–2106 [DOI] [PubMed] [Google Scholar]
- 15.Madara J. L., Stafford J., Barenberg D., Carlson S. (1988) Am. J. Physiol. 254, G416–G423 [DOI] [PubMed] [Google Scholar]
- 16.Wang F., Schwarz B. T., Graham W. V., Wang Y., Su L., Clayburgh D. R., Abraham C., Turner J. R. (2006) Gastroenterology 131, 1153–1163 [DOI] [PMC free article] [PubMed] [Google Scholar]
- 17.Abramoff M. D., Magelhaes P. J., Ram S. J. (2004) Biophotonics Intl. 11, 36–42 [Google Scholar]
- 18.Shen L., Turner J. R. (2005) Mol. Biol. Cell 16, 3919–3936 [DOI] [PMC free article] [PubMed] [Google Scholar]
- 19.Shiue H., Musch M. W., Wang Y., Chang E. B., Turner J. R. (2005) J. Biol. Chem. 280, 1688–1695 [DOI] [PMC free article] [PubMed] [Google Scholar]
- 20.Weber C. R., Nalle S. C., Tretiakova M., Rubin D. T., Turner J. R. (2008) Lab. Invest. 88, 1110–1120 [DOI] [PMC free article] [PubMed] [Google Scholar]
- 21.Pinto D., Robine S., Jaisser F., El Marjou F. E., Louvard D. (1999) J. Biol. Chem. 274, 6476–6482 [DOI] [PubMed] [Google Scholar]
- 22.Turner J. R., Rill B. K., Carlson S. L., Carnes D., Kerner R., Mrsny R. J., Madara J. L. (1997) Am. J. Physiol. 273, C1378–C1385 [DOI] [PubMed] [Google Scholar]
- 23.Taylor C. T., Dzus A. L., Colgan S. P. (1998) Gastroenterology 114, 657–668 [DOI] [PubMed] [Google Scholar]
- 24.Marano C. W., Lewis S. A., Garulacan L. A., Soler A. P., Mullin J. M. (1998) J. Membr. Biol. 161, 263–274 [DOI] [PubMed] [Google Scholar]
- 25.Bruewer M., Luegering A., Kucharzik T., Parkos C. A., Madara J. L., Hopkins A. M., Nusrat A. (2003) J. Immunol. 171, 6164–6172 [DOI] [PubMed] [Google Scholar]
- 26.Ceponis P. J., Botelho F., Richards C. D., McKay D. M. (2000) J. Biol. Chem. 275, 29132–29137 [DOI] [PubMed] [Google Scholar]
- 27.McGarry L. C., Winnie J. N., Ozanne B. W. (2004) Oncogene 23, 5284–5292 [DOI] [PubMed] [Google Scholar]
- 28.Zhang C., Richon V., Ni X., Talpur R., Duvic M. (2005) J. Invest. Dermatol. 125, 1045–1052 [DOI] [PubMed] [Google Scholar]
- 29.Uribe J. M., Keely S. J., Traynor-Kaplan A. E., Barrett K. E. (1996) J. Biol. Chem. 271, 26588–26595 [DOI] [PubMed] [Google Scholar]
- 30.Furuse M., Furuse K., Sasaki H., Tsukita S. (2001) J. Cell Biol. 153, 263–272 [DOI] [PMC free article] [PubMed] [Google Scholar]
- 31.Amasheh S., Meiri N., Gitter A. H., Schöneberg T., Mankertz J., Schulzke J. D., Fromm M. (2002) J. Cell Sci. 115, 4969–4976 [DOI] [PubMed] [Google Scholar]
- 32.Hollander D., Vadheim C. M., Brettholz E., Petersen G. M., Delahunty T., Rotter J. I. (1986) Ann. Intern. Med. 105, 883–885 [DOI] [PubMed] [Google Scholar]
- 33.Buhner S., Buning C., Genschel J., Kling K., Herrmann D., Dignass A., Kuechler I., Krueger S., Schmidt H. H., Lochs H. (2006) Gut 55, 342–347 [DOI] [PMC free article] [PubMed] [Google Scholar]
- 34.D'Incà R., Di Leo V., Corrao G., Martines D., D'Odorico A., Mestriner C., Venturi C., Longo G., Sturniolo G. C. (1999) Am. J. Gastroenterol. 94, 2956–2960 [DOI] [PubMed] [Google Scholar]
- 35.Wyatt J., Vogelsang H., Hübl W., Waldhöer T., Lochs H. (1993) Lancet 341, 1437–1439 [DOI] [PubMed] [Google Scholar]
- 36.Suenaert P., Bulteel V., Lemmens L., Noman M., Geypens B., Van Assche G., Geboes K., Ceuppens J. L., Rutgeerts P. (2002) Am. J. Gastroenterol. 97, 2000–2004 [DOI] [PubMed] [Google Scholar]
- 37.Clayburgh D. R., Musch M. W., Leitges M., Fu Y. X., Turner J. R. (2006) J. Clin. Invest. 116, 2682–2694 [DOI] [PMC free article] [PubMed] [Google Scholar]
- 38.May G. R., Sutherland L. R., Meddings J. B. (1993) Gastroenterology 104, 1627–1632 [DOI] [PubMed] [Google Scholar]
- 39.Watson C. J., Hoare C. J., Garrod D. R., Carlson G. L., Warhurst G. (2005) J. Cell Sci. 118, 5221–5230 [DOI] [PubMed] [Google Scholar]
- 40.Scharl M., Paul G., Barrett K. E., McCole D. F. (2009) J. Biol. Chem. 284, 27952–27963 [DOI] [PMC free article] [PubMed] [Google Scholar]
- 41.Utech M., Ivanov A. I., Samarin S. N., Bruewer M., Turner J. R., Mrsny R. J., Parkos C. A., Nusrat A. (2005) Mol. Biol. Cell 16, 5040–5052 [DOI] [PMC free article] [PubMed] [Google Scholar]
- 42.Van Itallie C. M., Holmes J., Bridges A., Gookin J. L., Coccaro M. R., Proctor W., Colegio O. R., Anderson J. M. (2008) J. Cell Sci. 121, 298–305 [DOI] [PubMed] [Google Scholar]
- 43.Fihn B. M., Sjöqvist A., Jodal M. (2000) Gastroenterology 119, 1029–1036 [DOI] [PubMed] [Google Scholar]
- 44.Yu A. S., Cheng M. H., Angelow S., Günzel D., Kanzawa S. A., Schneeberger E. E., Fromm M., Coalson R. D. (2009) J. Gen. Physiol. 133, 111–127 [DOI] [PMC free article] [PubMed] [Google Scholar]
- 45.Angelow S., Yu A. S. (2009) J. Biol. Chem. 284, 29205–29217 [DOI] [PMC free article] [PubMed] [Google Scholar]
- 46.Mackay F., Browning J. L., Lawton P., Shah S. A., Comiskey M., Bhan A. K., Mizoguchi E., Terhorst C., Simpson S. J. (1998) Gastroenterology 115, 1464–1475 [DOI] [PubMed] [Google Scholar]
- 47.van Dullemen H. M., van Deventer S. J., Hommes D. W., Bijl H. A., Jansen J., Tytgat G. N., Woody J. (1995) Gastroenterology 109, 129–135 [DOI] [PubMed] [Google Scholar]
- 48.Rutgeerts P., Sandborn W. J., Feagan B. G., Reinisch W., Olson A., Johanns J., Travers S., Rachmilewitz D., Hanauer S. B., Lichtenstein G. R., de Villiers W. J., Present D., Sands B. E., Colombel J. F. (2005) N. Engl. J. Med. 353, 2462–2476 [DOI] [PubMed] [Google Scholar]
- 49.Järnerot G., Hertervig E., Friis-Liby I., Blomquist L., Karlén P., Grännö C., Vilien M., Ström M., Danielsson A., Verbaan H., Hellström P. M., Magnuson A., Curman B. (2005) Gastroenterology 128, 1805–1811 [DOI] [PubMed] [Google Scholar]
- 50.Heller F., Fuss I. J., Nieuwenhuis E. E., Blumberg R. S., Strober W. (2002) Immunity 17, 629–638 [DOI] [PubMed] [Google Scholar]
- 51.Fuss I. J., Heller F., Boirivant M., Leon F., Yoshida M., Fichtner-Feigl S., Yang Z., Exley M., Kitani A., Blumberg R. S., Mannon P., Strober W. (2004) J. Clin. Invest. 113, 1490–1497 [DOI] [PMC free article] [PubMed] [Google Scholar]
- 52.Targan S. R., Karp L. C. (2005) Immunol. Rev. 206, 296–305 [DOI] [PubMed] [Google Scholar]


