


Abstract
Predicting RNA secondary structures is a very important task, and continues to be a challenging problem, even though several methods and algorithms are proposed in the literature. In this article, we propose an algorithm called Tfold, for predicting non-coding RNA secondary structures. Tfold takes as input a RNA sequence for which the secondary structure is searched and a set of aligned homologous sequences. It combines criteria of stability, conservation and covariation in order to search for stems and pseudoknots (whatever their type). Stems are searched recursively, from the most to the least stable. Tfold uses an algorithm called SSCA for selecting the most appropriate sequences from a large set of homologous sequences (taken from a database for example) to use for the prediction. Tfold can take into account one or several stems considered by the user as belonging to the secondary structure. Tfold can return several structures (if requested by the user) when ‘rival’ stems are found. Tfold has a complexity of O(n2), with n the sequence length. The developed software, which offers several different uses, is available on the web site: http://tfold.ibisc.univ-evry.fr/TFold.
INTRODUCTION
Non-coding RNAs play an important role in the regulation of various biological processes. Determining the structure of an RNA is a very important task. There are experimental methods for this purpose, such as crystallography, NMR, etc. But because of the high cost (in time and money) of these experimental methods, in silico methods are largely required by biologists. However, creating three-dimensional (3D) structural models of RNA remains a big challenge and very few solutions are proposed in literature (1–3). On the other hand, several in silico methods are proposed for predicting the secondary structure of RNA. There are methods using a single RNA sequence and also using multiple sequences. Most algorithms implementing the first approach use thermodynamic parameters defined by Turner Lab (4). These parameters have been improved in (5). Among the proposed algorithms, we can cite Mfold (6), the best known and most widely used software for predicting the secondary structure of one sequence. It is based on dynamic programming and has a complexity of O(n3), where n is the sequence length. This approach is based on the principle that the most stable secondary structure is the one having the minimal free energy. But some hypotheses state that, due to kinetic reasons, the real RNA secondary structure often has a local instead of a global minimum free energy (7). New algorithms take into account these kinetic features in order to minimize free energy in a local area. In this way, many algorithms try to simulate RNA folding processes by iteratively adding stems rather than pairings (8,9). Among algorithms using multiple sequences, we can cite Pfold (10), based on context-free grammars, with a complexity of O(n3). We can also cite RNAalifold (11), which integrates thermodynamic and phylogenetic information in a modified energetic model for predicting a common secondary structure of a set of homologous sequences with a time complexity of O(n3). Other new methods combine covariation and thermodynamic information using support vector machine methods with feature vectors which combine covariation and thermodynamic information (12,13).
In some RNA secondary structures, there are particular elements called pseudoknots. Pseudoknots correspond to two interleaved helices and are sometimes considered as a step towards the 3D structure. Due to high complexity, very few methods are proposed for searching for pseudoknots, and most of them search for specific types of pseudoknots. The iterative stem adding strategy helps to reduce the search space and deal with pseudoknotted structures (8,9,14). Iterated loop matching (ILM) (14), which uses this strategy, is based on dynamic programming and can be used for a search of pseudoknots with an average time complexity of O(n3) and a worst complexity of O(n4). An algorithm which folds the secondary structure hierarchically with a time complexity of O(n3) is described in (15). This algorithm searches for a pseudoknot free secondary structure before trying to establish a pseudoknotted secondary structure.
In (16,17), we proposed an algorithm based on a comparative approach, which searches for conserved stems in a given alignment of homologous sequences. The algorithm, called DCFold, uses simple metrics to measure conservation and covariation of stems. It searches for the stems hierarchically from most stable to least stable, by subdividing the sequences (‘divide and conquer’ approach). Its complexity is of O(n2), with n the sequence length. This algorithm, because of the divide and conquer approach, cannot locate pseudoknots. In (18,19), we proposed an algorithm called P-DCFold (extension of DCFold), which can search for stems and pseudoknots with the same complexity of O(n2).
An important problem in the approach based on multiple sequences is that the prediction results strongly depend on the homologous sequences used and on the quality of the alignment. In order to avoid this dependency, some algorithms propose to align the sequences and search for a common secondary structure at the same time. Because of time complexity, they use very few sequences. For instance, caRNAc (20), Foldalign (21), Dynalign (22,23), PARTS (24) and RAF (25) align and predict a common secondary structure of two homologous sequences with a complexity of O(n6). Other algorithms aim to improve prediction of RNA secondary structure by detecting conserved stems in alignments (26).
In (27), we proposed an original algorithm, called SSCA, which selects, from a large set of aligned homologous sequences (taken from a database for example), a subset of sequences that would be the most informative when performing the secondary structure prediction. SSCA is available on the web site: http://tfold.ibisc.univ-evry.fr/SSCA/.
In this article, we present an algorithm and an online software called Tfold, for predicting non-coding RNA secondary structures. This algorithm efficiently combines the SSCA algorithm and a new version of P-DCFold algorithm. The general principle of P-DCFold is preserved (search for stems including pseudoknots using ‘divide and conquer’ method). But almost all steps of the algorithm were improved. Tfold considers, besides length, conservation and covariation criteria, new stem selection criteria based on simplified and empirical stability rules. Tfold can return several structures, when there are ‘rival’ stems (overlapping stems) with close scores. Tfold allows errors (insertions, deletions and substitutions) in stems in the homologous sequences. Tfold can take into account stems set by the user, which are then considered as anchoring points.
Tfold was tested on several RNAs, some of them with pseudoknots: tRNA (28), 5S RNA (29), U1 RNA (30), srp RNA (31), tmRNA (32,33), RNase P (34), 16S RNA (35) and 23S RNA (36). The results were very satisfactory. Tfold was evaluated and compared with several existing tools for RNA secondary structure prediction: Mfold (6), RNAalifold (11,37), Pfold (10,38), ILM (14,39) and caRNAc (20,40). This article is organized as follows: in the first section, we describe our Tfold algorithm; then, we present and discuss some results obtained with Tfold, compared with existing software for RNA secondary structure prediction.
Description of Tfold algorithm
The Tfold algorithm, composed of several steps and procedures, is as follows:
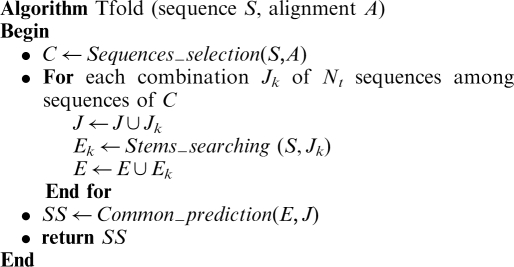
Tfold takes as input a RNA sequence S, called ‘target sequence’, for which we wish to predict a secondary structure, and a set A of aligned sequences representing the homologous sequences to use, called ‘test sequences’. The first step in Tfold is to get from the sequences of A a subset of best sequences to use for the prediction of the secondary structure SS of S ( procedure). Then, for each combination Jk of Nt sequences among these sequences, a secondary structure is predicted for the target sequence (
 procedure). Nt represents the number of homologous sequences needed by
  procedure for searching for stems in the target sequence S. This parameter is set by the user. However, we consider its optimal value as equal to 1/AV(S, C), where AV is the average variability of sequences of C in comparison with S (the variability of a sequence S′ in comparison with a sequence S is the number of differences between S and S′, divided by the length of S). For instance, if this average variability is of 25%, Nt would be set to 4. Finally, the last step of Tfold consists in selecting the stems which occur in a minimal number of predictions, in order to obtain the optimal structure (
 procedure).
We describe below the different steps of the Tfold algorithm.
Sequence selection
Predicting RNA secondary structure using multiple sequences implies the use of a set of aligned homologous sequences. Nowadays, there are many RNA databases containing large numbers of homologous RNA sequences. But the choice of sequences is very important, since the prediction results strongly depend on these sequences.
The  procedure selects the most informative homologous sequences for predicting the secondary structure of a given RNA sequence. It uses an algorithm that we previously developed called SSCA (27,41). SSCA takes as input a target RNA sequence and a set of aligned homologous sequences, and returns a classification of the homologous sequences according to their ‘interest’ towards the target sequence. It uses covariation constraints between each homologous sequence and the target sequence. These constraints are of two types: constraints of variability and constraints of stem alignment. The variability constraints depend on the quality of the alignment of the two considered sequences (percentage of ambiguous and indeterminate bases) and the percentage of identity and deletion between them. By default, we set the percentage of ambiguous bases to 0%, homology to 75% and deletion to 1%; but these parameters can be modified by the user. The stem alignment constraints are based on the stability of GC base pairs (11), the stability of GU intermediate state (42), and the fact that transitions occur more easily than transversions (43).
The general principles of SSCA are as follows (the reader can refer to (27) for more details):
For the target sequence St, build a model Mt representing the ideal homologous sequence, according to the above constraints.
- For each homologous sequence Sh:
- ○ Calculate its substitution matrix Mh according to St.
- ○ Calculate its score by comparing its substitution matrix Mh to the model Mt.
Classify the sequences Sh according to their score.
Once the sequences are classified by SSCA, the subset of sequences from the top of the classification are then used for the prediction. By default the (10) best scoring sequences are considered; but the user can also select sequences with a percentage of homology varying between two given values.
Stems searching
Stems are searched recursively, from most important to least important (according to criteria), by subdividing the sequence into smaller and smaller subsequences (divide and conquer approach).
The first version of the algorithm, called DCFold, was published in (16,17). Stems were selected using length, conservation and covariation as criteria. In DCFold, pseudoknots are not searched: the subdivision of the sequence is possible only if all stems are compatible, i.e. they are disjoint or included (one in the other) (Figure 1). Then we extended DCFold and proposed an algorithm, called P-DCFold, which includes a method for searching pseudoknots (18,19). The principles of P-DCFold algorithm are as follows [more details can be found in (17,19)]:
Stems satisfying length criteria are searched for in the target sequences St.
The conservation of each selected stem in the different homologous sequences is verified; a score of covariation is then associated to each conserved stem.
If no stems are selected in the previous step, stem conservation is verified only in homologous sequences with length close to the target sequence length (treatment of variable areas, i.e. areas with many deletions).
When two stems are incompatible (i.e. overlap), both stems are eliminated if they have the same score; otherwise, the one having the lowest score is eliminated. The obtained stems form a set of ‘anchoring points’.
The target sequence is subdivided into subsequences using the set of anchoring points; other stems are then searched in each subsequence.
Finally, once all compatible stems satisfying our criteria are selected, pseudoknots are searched for.
Since the original publications, we performed several improvements and extensions of the algorithm. The step of anchoring points searching (i.e. the search for conserved compatible stems) was largely changed and improved. Thus:
Figure 1.

When two stems are comparable (i.e. they do not share nucleotides), they can be: disjoint (A), included (B) or interlaced (C). When two comparable stems are interlaced, they form a pseudoknot; otherwise they are compatible.
Our stem selection now includes new criteria based on stem stability.
Errors (deletions, loops and bulges) are now allowed in stems in the test sequences.
Several possible structures can be returned by the algorithm when there are incompatible stems with close scores.
A set of stems considered as belonging to the target sequence can be set by the user. These stems will be considered by the algorithm as anchoring points.
Below, we describe the principal steps of stem searching in Tfold, focusing on these extensions and improvements.
Stem searching in target sequence
Stems are searched for in the target sequence using length criteria combined with stability criteria. Only stems that are sufficiently long (to be pertinent) and that satisfy stem stability rules are selected. We set the threshold of stem length to log 4 (n) (17) where n is the length of the sequence, and we consider stability rules which are simple empirical rules based on Tinoco parameters (44). These rules are related to:
Type of stem pairings: GC pairings are more stable than AU pairings which in turn are more stable than GU pairings (4). Besides, the position of GU pairings in the stem has an effect on the stem stability (42): the stem is more stable (i) when there is a purine on 5′ of GU (configuration R5′GU) rather than when there is a pyrimidine on 5′ of GU (configuration Y5′GU), and (ii) when there is a loop on 5′ of GU (configuration L5′GU, L: a loop) rather than when there is a loop on 3′ of GU (configuration L3′GU).
Type of the mis-pairing delimiting the beginning and/or the end of a stem: when it is GA or AA, the stem is more stable (45).
Size and type of the terminal loops: a stem is more stable when the formed loop is a tetra-loop of type GNRA, UNCG or CUYG (N: any base) (46).
Tfold algorithm uses a matrix M of size (n, n) where the target sequence, namely St, of length n, is compared with itself in a reversed way (note that we consider only half of the matrix since it is symmetric). For each i, j from 1 to n:
where s(i, j) is the score attributed to M[i, j] and depending on the pairing (St(i), St( j )). s(i, j) is set to: (i) 3 if it is a GC pairing; (ii) 2 if it is a AU pairing or a GU pairing in the configurations R5′GU or L5′GU; (iii) 1 if it is a GU pairing in the configurations L3′GU or Y5′GU; (iv) 0 otherwise.
The obtained score s(i, j ), when it is greater than 0, is increased by 1 when: (i) s(i − 1, j − 1) = 0 and (St(i − 1), St( j − 1)) forms a pairing AG or AA in the configurations H5′GA or H5′AA (H: a helix or stem); (ii) s(i + 1, j + 1) = 0 and (St(i + 1), St( j + 1)) forms a pairing GA or AA in the configurations H5′GA or H5′AA. It is also increased by 2 when: s(i + 1, j + 1) = 0 and the obtained stem forms a loop of size 4 (tetra-loop) of the form: GNRA, UNCG or CUYG. The score of the last pairing of the stem defines the global score of the stem.
We then select the stems having a global score greater or equal to 2*log4(n) in order to retain those sufficiently long and stable. We add the factor 2 to the length criteria because the average stability score of a pairing is equal to 2 (GC = 3, AU = 2 and GU = 1). The other used scores (related to stems and loops configuration) are considered as bonus.
Stem searching in homologous sequences
Stems are selected by our algorithm only if they are conserved in the homologous sequences and if their covariation score is sufficiently high.
Stem conservation
Once the stems are determined in the target sequence St, we verify their conservation in the homologous sequences. The principle is as follows: let b, e and l, respectively, be the position of the first strand, the position of the second strand and the length of a selected stem X in the sequence St. For each homologous sequence Sh, we consider the subsequence Sh[b − d, b + l + d] and the reversed subsequence of Sh[e − d, e + l + d] where d represents a gap; we compare and align them using a score matrix A of length [l + 2d, l + 2d] (dynamic programming approach). The score s(i, j) of A[i, j] is equal to: (i) s(i, j − 1)+ the score of an insert; (ii) s(i − 1, j)+ the score of a deletion; and (iii) s(i − 1, j − 1)+ the score of the pairing (i, j).
Thus, stems with bulges and internal loops are considered. We set a score of −1 for an insert or a deletion and −2 for a base pair that is not a GC, AU or GU pairing. For the latter, we set the same scores as the ones used above (‘stem searching in target sequence’ section): +3 for GC, +2 for AU and for GU in the configurations R5′GU or L5′GU, and +1 for GU in the configurations L3′GU or Y5′GU.
The global score is then augmented in the case of particular loops and/or particular stem ends, as described above in ‘stem searching in target sequence’ section. Later, we deduce a conservation score for the stem X in the sequence Sh: it is equal to the best score in the matrix A. Finally, we consider that a stem is conserved in all homologous sequences if its conservation score in each of the homologous sequences is ≥2*log4(n).
Stem covariation
If a stem X is conserved in all homologous sequences, we compute its covariation score, the number of mutations Nmut = 2*Ncomp + Ncons − Nerr, where Ncomp is the number of compensatory mutations (conserved pairings with double mutations), Ncons the number of substantial mutations (conserved pairings with one mutation) and Nerr the number of errors (non-conserved pairings).
With this equation, we favour conserved stems with high level of covariation (many compensatory mutations). We take into account stems conserved with errors (as explained above), but errors are discriminated.
A stem X of length l is then selected if the rate N/l is ≥1, i.e. if it has in average at least one mutation per base. However, we have observed in RNA structures that some stems could be very long and highly conserved, i.e. with very low covariation. We therefore established another selection criteria, favouring stem length: a stem X of length l is selected if Nmut + l is ≥2*log4(n). This second criterion is used when no stems are selected with the first one.
User stem insertion
When a biologist uses a tool for predicting the secondary structure of a given RNA sequence, he usually already knows one or several stems of the secondary structure. Consequently, he would like to have the possibility to set these stems on the secondary structure. An important improvement of Tfold is the possibility to take into account this kind of information, and even better, to benefit from this information and improve the predictions.
In the case where the user sets stems, these are considered by Tfold as anchoring points. They are inserted in the set of selected conserved stems and are assigned a maximal score. Thus, they are always kept in the different steps of the algorithm and the selection for other stems is performed according to these stems.
Variable area treatment
It is important to find at least one anchoring point stem, so that the search for other stems can be performed; otherwise, the process stops. In some cases, no conserved stems can be found. This can occur, for instance, when at least some of the sequences used present areas with high variability (generally areas at the structure periphery, where stems are less conserved than in the heart).
To solve this problem, we have implemented a procedure for the treatment of variable areas, and more particularly regions where there are many insertions/deletions. When no anchoring point is found, the comparison step is relaunched by considering only the homologous sequences of length close to the target sequence length. However, a stem is selected only if it is conserved in at least three homologous sequences.
Note that if the user has set at least one stem, this procedure is not necessary (at least at the first stage of the recursion), even when no conserved stems are found by Tfold, since the stems set by the user allow the subdivision of the sequence.
Stem incompatibility treatment
An important step in our algorithm is to verify the compatibility of the selected stems (conserved stems with sufficiently high scores) and to treat possible incompatibilities. The compatibility between all stems is an important condition to be able to subdivide the sequence for searching for further stems (as described below in ‘sequence subdivision’ section).
In the initial version of the compatibility treatment procedure (17), when two stems are incompatible, we keep the one having the highest score, and in case they have the same score (i.e. are in conflict), both are eliminated. In Tfold, we have implemented a new procedure which treats conflicts between stems in another way: it keeps the two stems and proposes two alternative sets of anchoring points, each set allowing the subdivision of the sequence in two different ways, before searching for two different sets of stems. Therefore, k + 1 alternative structures are predicted with k the number of conflicts.
Two incompatible stems are considered in conflict when they have close scores. The resolution of the notion of ‘close scores’ is a parameter that can be set by the user. By default, it is equal to zero, which means that two stems are considered in conflict only when they have equal scores. Obviously, increasing this parameter value increases the number of alternative structures.
On our system interface, the user can choose between predicting only one secondary structure or several possible ones (alternative structures). In the second case, he has to set the maximum number of structures he would like to get.
Sequence subdivision
Once a set of anchoring points is selected, it is used for subdividing the target sequence into smaller sequences where other stems (with necessarily lower scores) are searched for. A given stem X allows the subdivision of a sequence into two subsequences where other stems compatible with X can be searched for: the internal subsequence of X and the concatenation of the two external subsequences of X. When there are several anchoring points, we obtain different subsequences. In order to avoid redundancies in the subsequence treatment (search for new stems), these subsequences are considered in a certain way, as described in Figure 2 [refer to (17) for more details].
Figure 2.

The ‘divide and conquer’ approach applied on a sequence S with a set of selected stems (anchoring points): S is subdivided into several subsequences [S2, S5, S4S6 (concatenation of S4 and S6), S8 and S1S3S7S9] where the search for other stems could be performed.
Pseudoknot search
The search for pseudoknots is performed only once when all compatible stems of the target sequence are selected. Let E1 be this set of stems. The pseudoknot searching procedure consists in searching for compatible stems in a new sequence, the target sequence without stems of E1. Let E2 be the new set of selected stems. Since they are not previously selected, E2 stems are necessarily incompatible with stems of E1, and thus form pseudoknots with them.
With this method, all kinds of pseudoknots are searched, even complex ones. Our algorithm is able to search for pseudoknots composed of several incompatible stems; they are called k-pseudoknots, where k represents the number of stems (all incompatible with each other) making up the pseudoknot. Most of known pseudoknots are 2-pseudoknots (simple pseudoknots), but we can cite the 3-pseudoknot of Eschericha coli α-operon tmRNA (47–49). The 3-pseudoknots are searched for as follows: we consider the target sequence without stems of E1 and E2 where stems are searched for. The new selected stems are incompatible with stems of E1 and E2, making up 3-pseudoknots. This recursive process can thus be followed until no stems are found. The level k of the last step of the recursion gives the highest complexity level of found pseudoknots (k-pseudoknot). The algorithm is described in detail in (19).
Common prediction
As described above, one important problem when using a comparative approach for RNA secondary structure prediction is the high dependency of prediction results according to the set of homologous sequences used. To solve this problem, we implemented in Tfold a procedure called Common_prediction which performs several predictions using different sets of homologous sequences and then select consensus stems, i.e. stems found in several predictions.
The principle of this procedure is as follows:
Let there be K sets noted Jk (k∈[1; K]) of homologous sequences such as each set is used for predicting the secondary structure of a same given target sequence. Each prediction returns a set of stems. For each stem Hj
 appearing in at least one structure, a number (not null) of appearances AHj is associated in the different predicted structures. A stem can appear in ‘equivalent’ forms. We define below the notion of equivalence between stems. Before, we need to define the relation of ‘sub-stem’, noted Rss, between two stems:
Definition 1 —
Let two stems H1 and H2 be defined, respectively, by (b1, e1, l1) and (b2, e2, l2), where bi, ei and li are, respectively, the position of the first strand, the position of the second strand and the length of Hi. The stem H1 is a sub-stem of the stem H2 (H1RssH2) if there is an integer d ≥ 0 such as:
Thus, we can deduce the equivalence relation Req between two stems:
Definition 2 —
Two stems H1 and H2 are equivalent (H1ReqH2) if H1 Rss H2 or H2 Rss H1
The common structure will be formed by stems having a minimal number of appearances. In order to have a secondary structure with comparable stems (‘stem searching in target sequence’ section), a stem Hj is selected only if AHj > K/2. If the number of sequences is high (greater or equal to 100), this threshold is set to 3K/4.
RESULTS AND DISCUSSION
In this section, we present the results obtained with Tfold on several sets of non-coding RNAs. The results are compared with existing RNA secondary structure prediction software. Two comparative analyses were performed: in the first analysis, we tested Tfold and several programs on selected sets of aligned RNA sequences; in the second analysis, we tested Tfold on benchmark alignments used by Gardner and Giegerich in (50), and compared its results with those presented in this article.
To evaluate Tfold and the other software, we used the measures of sensitivity and selectivity or positive predictive value (PPV) as used by Gardner and Giegerich in (50). The sensitivity measures the capability to find the pairings of a reference structure. A sensitivity of 0,90 means that 90% of pairings of the reference structure are found. The PPV represents the probability that a predicted pairing belongs to the reference structure. A PPV of 0,90 means that 90% of predicted pairings are true positives and 10% are false positives. The sensitivity and PPV measures are given by the following equations:
| 1 |
| 2 |
where TP is the number of pairings correctly predicted (true positives), FN is the number of non-predicted pairings (false negatives) and FP is the number of predicted pairings that do not appear in the structure (false positives). Because false positive pairings are not necessarily false, Gardner and Giegerich introduced a value E representing the number of false positive pairings which are not in conflict with pairings of the reference structure.
We also used a third criterion introduced by Gardner and Giegerich which allows the simultaneous evaluation of the sensitivity and the PPV. This criterion, called MCC, is a variant of Mathews correlation coefficient (51) and is calculated as follows:
 |
3 |
where TN, the number of true negative pairings, is equal to: (n*(n − 1)/2) − TP − FN − FP with n*(n − 1)/2 representing all possible pairings in a sequence of size n. Thus, TN represents all possible pairings minus the true positives, the false negatives and the false positives. MCC varies from −1 to 1, 1 corresponding to predictions which completely fit with the reference structure.
First analysis
Material and methods
In this analysis, we compared our algorithm Tfold with several existing software for RNA secondary structure prediction. We classify these programs into two categories: the ones that do not predict pseudoknots and the ones that are able to predict pseudoknots.
First category of programs (programs that do not predict pseudoknots)
Mfold (6,52) performs the secondary structure prediction of one RNA sequence by energy minimisation using the Zuker and Stiegler algorithm (53), which is based on dynamic programming and is of time complexity of O(N3).
RNAalifold (54,37) is based on the Zuker and Stiegler (53) algorithm and integrates thermodynamic and phylogenetic information in a modified energetic model. Its time complexity is of O(N3).
Pfold (10,38) uses phylogenetic information, in order to propose, given an alignment of RNA sequences, a set of common RNA secondary structures. It is based on context-free grammars and has a time complexity of O(N3).
LocARNA (55,56) uses a model based on base pairing probabilities predicted for each sequence independently.
caRNAc (20,40) simultaneously performs the alignment and the prediction of a common secondary structure of two homologous RNA sequences, using thermodynamic criteria and criteria of conservation and covariation. The algorithm is close to Sankoff approach (57) and is of complexity of O(N3).
Second category of programs (programs that predict pseudoknots)
ILM (14,39) takes as input an alignment of RNA sequences and returns a common secondary structure by selecting the stems one by one according to a model integrating thermodynamic and mutual information. The algorithm is based on dynamic programming and allows the search for pseudoknots with an average time complexity of O(N3) and a worst complexity of O(N4).
pknotsRG (58,59) uses Turner energy rules for finding the structure of minimal free energy (including pseudoknots) of a single sequence.
vsfold (60,61) uses structure mapping and thermodynamics for RNA pseudoknot prediction. The heuristic approach takes advantage of the 5′ to 3′ folding direction of many biological RNA molecules and is consistent with the hierarchical folding hypothesis and the contact order model.
These software are of different types: Pfold, ILM and caRNAc perform the prediction of a common secondary structure of several aligned homologous sequences and propose also the secondary structure of each sequence, unlike RNAalifold which proposes only the common structure; as for Mfold, pknotsRG and vsfold, they use only one sequence for predicting its structure.
Our tests were performed on the following RNA (given here by increase order of length): tRNA (28), 5S RNA (29), U1 RNA (30), srp RNA (31), tmRNA (32,33), RNase P (34), 16S RNA (35) and 23S RNA (36).
For each RNA, an alignment of homologous sequences was recovered from a database. The sequences were dis-aligned and then realigned using ClustalW (62) with its default parameters, in order to avoid any secondary structure information in the alignment (note that we could use MAFFT (63) or R-Coffee (64) as well; we obtain minor differences in prediction efficiency when using one or another of these three programs). For each of the RNAs, the secondary structure prediction was performed for one sequence (taken from the alignment), considered as the target sequence. The different sequences of each RNA used in our tests are given in the Supplementary Data file and can also be found on the website http://tfold.ibisc.univ-evry.fr/TFold/.
Tfold was used with default parameters, as described above in ‘Description of Tfold algorithm’ section and shown in Figure 3.
Figure 3.

Tfold software interface: page allowing to set the values of the different parameters; the values by default are the recommended values.
We also used each of the software above with their options by default. For Pfold, ILM and caRNAc, we considered the output giving the secondary structure of one sequence (since we want to get the secondary structure of the target sequence). In the case of RNAalifold, we used an option of the software RNAfold (65), RNAfold -C, in order to rebuild the secondary structure of a sequence from the common structure. All software were carried out considering as input all the alignment sequences, except Mfold, pknotsRG and vsfold which were run considering the target sequence only and caRNAc for which the sequence bor.bro.am could not be loaded due to ambiguity characters in the sequence.
Finally, for time complexity reasons, some tests could not be performed. This is the case for structure prediction of RNAse P, 16S RNA and 23S RNA with Pfold; 16S RNA and 23S RNA with LocARNA, pknotsRG and vsfold and of 23S RNA with ILM.
Results
Results with the first category of programs
Figure 4 gives the sensitivity and the PPV obtained by each of the first category of software on the different RNAs, and Figure 5 gives the correlation results.
Figure 4.

Results obtained by Tfold and several other RNA secondary structure prediction software that do not predict for pseudoknots. (A) sensitivity results. (B) PPV results.
Figure 5.

Correlation (MCC) results obtained by Tfold and several other RNA secondary structure prediction software that do not predict for pseudoknots.
Sensitivity results
As shown in Figure 4A, the sensitivity of Tfold is always greater than 0.73. The average sensitivity of Tfold is approximatively 0.8, which means that 80% of the secondary structure pairings are found.
RNAalifold gives high sensitivities, notably for 5S, 16S and 23S RNA. LocARNA has similar results to RNAalifold, but it gives no results for long RNA sequences because of time complexity. The results obtained by Pfold are very satisfactory for ‘small’ RNAs (tRNA, 5S RNA and U1 RNA). Unfortunately, its complexity does not allow its use in RNA sequences of length >400 nt (RNAse P, 16S RNA and 23S RNA). The results of Mfold and caRNAc are less good, with a sensitivity ∼0.55. Mfold seems to have more difficulties with small RNAs (average sensitivity of 0.3 for tRNA, 5S RNA and U1 RNA, which are shorter than 200 nt) than for longer RNA (average sensitivity of 0.55). Best Mfold results are obtained for srp RNA. This could be because this RNA is mostly composed of a long hairpin (very few loops with more than two stems); Mfold has indeed a tendency to fold RNA into long hairpins. Opposite to Mfold, the sensitivity of caRNAc increases with the sequence length, except for tRNA and 5S RNA, where the average sensitivity is of 0.6 while it is of 0.5 for 16S and 23S.
On the whole, we can say that the results obtained by Tfold in terms of sensitivity are very satisfactory. If we compare the results obtained by the different software, Tfold results are always between the two best ones. Tfold gives the best results for srp RNA, tmRNA and RNase P.
PPV results
Results obtained by Tfold in term of PPV (Figure 4B) are very good, and are similar to the ones obtained for sensitivity. For any RNA, its PPV is always between the two best PPV results and is ∼0.90.
Concerning the other software, we observe that unlike previously, caRNAc obtains good results. Its average PPV is of 0.88. Pfold obtains also good results (average of 0.88 if we do not consider the RNA for which we have no results). The PPV of Mfold is identical to the sensitivity, for all considered RNA.
MCC results
Correlation results (Figure 5) confirm the sensitivity and PPV observations. The correlation of Tfold (average of 0.85) is very good in comparison with the other software. Tfold is the only software which obtains a correlation always greater than 0.80.
RNAalifold gives also good MCC results (average of 0.78). Pfold obtains the same average correlation (0.78) as RNAalifold, but we consider its results less good, since their quality decreases markedly with the size of the considered RNA; furthermore, Pfold does not return results for the longest RNA. The results of caRNAc are ∼0.6. Finally, the worse results are obtained by Mfold, with an average correlation close to 0.5.
Results with the second category of programs
Figure 6 gives the sensitivity and the PPV obtained by each of the programs predicting pseudoknots on the different RNAs and Figure 7 gives the correlation results. As we can see, Tfold gives the best results in term of sensitivity, PPV and MCC, for all considered RNA, except for tRNA.
Figure 6.

Results obtained by Tfold and several other RNA secondary structure prediction software that predict pseudoknots. (A) sensitivity results. (B) PPV results.
Figure 7.

Correlation (MCC) results obtained by Tfold and several other RNA secondary structure prediction software that predict for pseudoknots.
Discussion
Results obtained by Tfold are very satisfactory. For each considered RNA, its results in term of sensitivity, PPV and MCC are always among the two best results (except for U1 RNA where the PPV and the MCC are the third best results), as we can see in Figures 4 and 5. More importantly, results obtained by Tfold are rather homogeneous, for any considered RNA, contrary to the other software. We remark that the performance of the tested programs globally decreases with the size of the considered RNA, except for 16S and 23S RNA. In fact, prediction results are better with small sequences because they are better aligned; moreover, 16S RNA and 23S RNA are well conserved, so are easy to align, which is why their prediction results are generally good.
When we compare the results obtained globally on the set of considered RNAs, Tfold is very good in comparison with the other software, as shown in Table 1. It gives the best average sensitivity (80%), the best average PPV (93%) and the best average MCC (86%). It gives also the best values of the minimal sensitivity, PPV and MCC. In case of maximal sensitivity, PPV and MCC, it is among the two best software. Besides, Tfold has the lowest result variability in comparison to the other results. This confirms the homogeneity of Tfold prediction results, whatever the RNA.
Table 1.
Average, minimum and maximum values of sensitivity, PPV and correlation (MCC) obtained by each of software on considered RNA (tRNA, 5S RNA, U1 RNA, srp RNA, tmRNA, RNase P, 16S RNA and 23S RNA)
| Sensitivity |
PPV |
MCC |
|||||||
|---|---|---|---|---|---|---|---|---|---|
| avg | min | max | avg | min | max | avg | min | max | |
| Mfold | 0.45 | 0.17 | 0.64 | 0.44 | 0.17 | 0.64 | 0.45 | 0.17 | 0.63 |
| LocARNA a | 0.72 | 0.54 | 1 | 0.84 | 0.72 | 1 | 0.77 | 0.62 | 1 |
| RNAalifold | 0.73 | 0.55 | 1 | 0.86 | 0.66 | 1 | 0.79 | 0.64 | 1 |
| Pfold a | 0.76 | 0.47 | 1 | 0.89 | 0.79 | 1 | 0.82 | 0.61 | 1 |
| caRNAc | 0.49 | 0.24 | 0.64 | 0.88 | 0.69 | 1 | 0.62 | 0.40 | 0.80 |
| ILMa | 0.64 | 0.51 | 0.8 | 0.72 | 0.48 | 1 | 0.68 | 0.50 | 0.89 |
| pknotsRG a | 0.53 | 0.17 | 1 | 0.53 | 0.17 | 1 | 0.53 | 0.17 | 1 |
| vsfold a | 0.35 | 0.08 | 0.90 | 0.44 | 0.12 | 1 | 0.39 | 0.09 | 0.95 |
| Tfold | 0.80 | 0.74 | 0.95 | 0.93 | 0.87 | 1 | 0.86 | 0.81 | 0.95 |
aThese software do not provide results for all considered RNAs.
An important point is pseudoknots. Only Tfold, pknotsRG, vsfold and ILM search for them. In our tests, several RNAs contain pseudoknots: tmRNA, RNAse P, 16S RNA. Most important are tmRNA and RNAse P which contain, respectively, 4 and 2 pseudoknots. In tmRNA, the pseudoknots are completely overlapped in the structure. Therefore, in practice, it is very difficult to predict the structure if the pseudoknots are not located. Except for Tfold, which gives very good results for these RNA, most programs show decreasing result quality, even ILM, pknotsRG and vsfold. In (50), Gardner and Giegerich remarked that often, when a software searches for pseudoknots, its results for the (whole) structure prediction decrease in quality. It is notably the case of ILM. On the contrary, Tfold results remain absolutely unchanged when pseudoknots are searched for, since pseudoknots are predicted once all compatible stems (stems that do not overlap) are found.
An interesting remark about ILM software is that its (sensitivity/specificity/MCC) curve shows the same fluctuations as Tfold (except for tmRNA) with an average gap of 0.12 for sensitivity, 0.2 for PPV and 0.16 for MCC. This could be because Tfold and ILM are close, notably by their recursive approach.
Second analysis
Material and methods
Gardner and Giegerich in (50) performed an evaluation of several RNA secondary structure prediction software, on different RNA. The software compared in this article were subdivided into two categories: RNAfold (65), Mfold (6) and Sfold (66) which use a single sequence and RNAalifold (11), Pfold (10), ILM (14), caRNAc (20), Foldalign (21) and Dynalign (22) which use multiple sequences.
We then performed a second evaluation of Tfold, using sequence alignments used in (50). We compared the results we obtained with Tfold with the results obtained by Gardner and Giegerich using a set of software. We considered only the results of the second category of software, since they are based on the same approach as Tfold. We also considered Mfold, which is the most well-known software in its category.
We considered the same target sequences as in (50): tRNA and RNAse P of Saccharomyces cerevisiae and 16S RNA and 23S RNA of E. coli. For each RNA, two sets of homologous sequences were used: one with an identity rate between 80% and 90% (strong identity) and another more variable, with an identity rate between 60% and 80% (average identity).
The reference structure used in (50) to evaluate the software does not contain all pairings of the original known structures: some pairings were removed in order not to penalize the software which do not search for them. This is the case with pairings belonging to pseudoknots. It is also the case with pairings that are conserved in only a few sequences (less than half of sequences).
This is not the case of Tfold, which finds pairings even if they form pseudoknots or are conserved in only few sequences (see ‘variable area treatment’ and ‘common prediction’ sections). Therefore, we used for our tests on Tfold the original reference structures (with all their pairings, including pseudoknots). As an example, the reference structure we considered for testing Tfold on RNAse P (using a set of homologous sequences with an average variability) contains 110 pairings, while the structure used by Gardner and Giegerich for RNAalifold contains only 71 pairings and the one used for Pfold contains 54 pairings.
Results and discussion
Figure 8 illustrates correlation results obtained by Tfold on sets of sequences with high identity and sets of sequences with average identity, compared with correlation results obtained in (50).
Figure 8.

Correlation (MCC) results obtained by Tfold and by software tested in (50) on sets of sequences with high identity (A) and on sets of sequences with average identity (B).
Results obtained by Tfold are wholly satisfactory. They are in the ‘top three’ in case of sequences of high identity (Figure 8A) and in the ‘top two’ in case of sequences with average identity (Figure 8B). Tfold results are better on homologous sequences with an identity rate between 60% and 80% (average identity) than on homologous sequences with high identity. This is due to the fact that the covariation criterion (compensatory mutations) used in our model works better when sequence variability increases.
Tfold continues to obtain homogeneous results whatever type of considered RNA, particularly when considering sequences of average homology.
An important point to consider here is that Tfold, unlike the other software, can search for all pairings, including pseudoknots and pairings with a low degree of conservation. Therefore, in order to have a better measure of the ability of Tfold to predict the secondary structure of a given RNA sequence, we calculated new MCC values for each software (‘adjusted MCC’) considering all pairings of the original known structure. Therefore, the same reference structure is used for all software.
Figure 9 gives the adjusted correlations obtained by the different software and RNA.
Figure 9.

Adjusted MCC results obtained by Tfold and by software tested in (50) on sets of sequences with high identity (A) and on sets of sequences with average identity (B).
The adjustment concerns mostly RNAse P. Thus, for this RNA, Tfold now obtains the best results for the two sets of sequences.
Results obtained by Tfold are very good. Tfold gives the best average and the best minimum MCC in case of sequences of average identity, as shown in Table 2. Pfold gives higher average and minimum MCC on sequences of average identity before adjustment, but these results concern only tRNA and RNAse P, when Tfold gives results for all considered RNAs, as shown in Figure 8. Tfold results are also very robust: they are homogeneous whatever the considered RNA.
Table 2.
Average, minimum and maximum values of correlation (MCC) obtained by each of software in conditions of article (50) on considered RNA (tRNA, RNase P, 16S RNA and 23S RNA), before adjustment and after adjustment
| MCC values |
MCC adjusted values |
|||||||||||
|---|---|---|---|---|---|---|---|---|---|---|---|---|
| Average identity |
High identity |
Average identity |
High identity |
|||||||||
| avg | min | max | avg | min | max | avg | min | max | avg | min | max | |
| Mfold | 0.46 | 0.19 | 0.59 | 0.46 | 0.19 | 0.59 | 0.46 | 0.19 | 0.59 | 0.46 | 0.19 | 0.59 |
| RNAalifold | 0.85 | 0.64 | 1 | 0.78 | 0.59 | 1 | 0.79 | 0.45 | 1 | 0.75 | 0.58 | 1 |
| Pfold a | 0.95 | 0.9 | 1 | 0.85 | 0.77 | 0.98 | 0.81 | 0.63 | 1 | 0.80 | 0.62 | 0.98 |
| ILM | 0.54 | 0.40 | 0.86 | 0.48 | 0.29 | 0.72 | 0.55 | 0.38 | 0.86 | 0.48 | 0.29 | 0.72 |
| CaRNAc | 0.78 | 0.75 | 0.83 | 0.79 | 0.68 | 0.93 | 0.76 | 0.73 | 0.82 | 0.75 | 0.55 | 0.93 |
| Foldaligna | 0.19 | 0.11 | 0.27 | 0.26 | 0.26 | 0.27 | 0.18 | 0.1 | 0.27 | 0.23 | 0.21 | 0.26 |
| Dynaligna | 0.63 | 0.32 | 0.95 | 0.47 | 0.4 | 0.54 | 0.63 | 0.31 | 0.95 | 0.43 | 0.33 | 0.54 |
| Tfold | 0.86 | 0.79 | 0.95 | 0.75 | 0.63 | 0.97 | 0.86 | 0.79 | 0.95 | 0.74 | 0.63 | 0.97 |
aThese software do not provide results for 16S RNA and 23S RNA.
CONCLUSION
Determining non-coding RNA structures is a very important research problem, and biologists need help from computational tools to perform this task. In this article, we presented an efficient algorithm and its associated tool called Tfold for predicting non-coding RNA secondary structures. It is a complete and interactive system, where users can carry out Tfold and its components in different ways, change different parameters values, set some known stems which are taken into account by the system, choose to get several possible structures or only one, search for pseudoknots or not, etc. The software can be used via the web site http://tfold.ibisc.univ-evry.fr/TFold/.
The principal characteristics of Tfold are:
It searches for most stable to less stable stems, using criteria of length, stability, conservation and covariation; this approach models well the process for RNA folding.
It has a complexity of O(n2), when other existing software have complexities at least of O(n3).
It searches for pseudoknots with the same complexity (O(n2)). Besides, the quality of its results still remain good even when pseudoknots are searched for, which is not the case of the (few) other programs that also offer this possibility [as stated in (50)].
It searches for stems, while almost existing algorithms search for pairings.
It offers the possibility to search for alternative structures.
It can take into account stems already known (set by the user); these stems are considered as anchoring points, thus improving the prediction.
It allows the automatic selection from a given alignment of a subset of homologous sequences to use, in order to avoid bad prediction results because of bad alignment quality and/or non-adequate sequences.
All these characteristics make Tfold competitive in terms of result quality and complexity (in time). Tfold was tested on several RNA (tRNA, 5S RNA, U1 RNA, srp RNA, tmRNA, RNAse P, 16S RNA and 23S RNA), with lengths varying from 76 to 2904 nt. The predictions have an average sensitivity ∼80% and an average PPV ∼90%, which means that Tfold finds 8 pairings among 10 and that when a pairing is predicted, it has 9 chances on 10 to be a good one.
Tfold was compared with several existing tools for RNA secondary structure prediction: Mfold, RNAalifold, Tfold, ILM, caRNAc, LocARNA, pknotsRG, vsfold, Foldalign and Dynalign, using different RNA and different sets of homologous sequences. An important characteristic and quality of Tfold comparing to these software is that it is robust in terms of result quality and time complexity. The results are globally homogeneous for any kind of considered RNA sequences: small or long sequences, conserved or very variable sequences, structures with or without pseudoknots, etc. Besides, when the sequences are not highly conserved, Tfold is the only software which obtains a correlation always greater than 0.80 for any RNA.
SUPPLEMENTARY DATA
Supplementary Data are available at NAR Online.
FUNDING
French Ministry of Education and Research; Council of Essonne Region (Pôle System@tic, POPS project). Funding for open access charge: Laboratory IBISC and funding from project contracts.
Conflict of interest statement. None declared.
Supplementary Material
ACKNOWLEDGEMENTS
Fariza Tahi would like to thank Gabriel Chandesris and Frédéric Merle for developing the Tfold web site and the two undergraduate students Médérich Besnard and Sabine Menigaud for participating in its improvement.
REFERENCES
- 1.Jonikas M, Radmer R, Laederach A, Das R, Pearlman S, Herschlag D, Altman R. Coarse-grained modeling of large RNA molecules with knowledge-based potentials and structural filters. RNA. 2009;15:189–199. doi: 10.1261/rna.1270809. [DOI] [PMC free article] [PubMed] [Google Scholar]
- 2.Laederach A, Chan J, Schwartzman A, Willgohs E, Altman R. Modeling RNA tertiary structure motifs by graph-grammars. RNA. 2007;13:643–650. [Google Scholar]
- 3.St-Onge K, Thibault P, Hamel S, Major F. Modeling RNA tertiary structure motifs by graph-grammars. Nucleic Acids Res. 2007;35:1726–1736. doi: 10.1093/nar/gkm069. [DOI] [PMC free article] [PubMed] [Google Scholar]
- 4.Mathews D, Sabina J, Zuker M, Turner D. Expanded sequence dependence of thermodynamic parameters improves prediction of RNA secondary structure. J. Mol. Biol. 1999;288:911–940. doi: 10.1006/jmbi.1999.2700. [DOI] [PubMed] [Google Scholar]
- 5.Andronescu M, Condon A, Hoos H, Mathews D, Murphy K. Efficient parameter estimation for RNA secondary structure prediction. Bioinformatics. 2007;23:19–28. doi: 10.1093/bioinformatics/btm223. [DOI] [PubMed] [Google Scholar]
- 6.Mathews D, Turner D, Zuker M. RNA secondary structure prediction. Curr. Protoc. Nucleic Acid Chem. 2000;11:1–10. doi: 10.1002/0471142700.nc1102s28. [DOI] [PMC free article] [PubMed] [Google Scholar]
- 7.Abrahams J, van denBerg M, vanBatenburg E, Pleij C. Prediction of RNA secondary structure, including pseudoknotting, by computer simulation. Nucleic Acids Res. 1990;18:3035–3044. doi: 10.1093/nar/18.10.3035. [DOI] [PMC free article] [PubMed] [Google Scholar]
- 8.Chen X, He S, Bu D, Zhang F, Wang Z, Chen R, Gao W. Flexstem: improving predictions of RNA secondary structures with pseudoknots by reducing the search space. Bioinformatics. 2008;24:1994–2001. doi: 10.1093/bioinformatics/btn327. [DOI] [PubMed] [Google Scholar]
- 9.Yang J, Luo Z, Fang X, Wang J, Tang K. Predicting RNA secondary structures including pseudoknots by covariance with stacking and minimum free energy. Chinese J. Biotechnol. 2008;24:659–664. [PubMed] [Google Scholar]
- 10.Knudsen B, Hein J. Pfold: RNA secondary structure prediction using stochastic context-free grammars. Nucleic Acids Res. 2003;31:3423–3428. doi: 10.1093/nar/gkg614. [DOI] [PMC free article] [PubMed] [Google Scholar]
- 11.Hofacker I, Fekete M, Flamm C, Huynen M, Rauscher S, Stolorz P, Stadler P. Automatic detection of conserved RNA structure elements in complete RNA virus genomes. Nucleic Acids Res. 1998;26:3825–3836. doi: 10.1093/nar/26.16.3825. [DOI] [PMC free article] [PubMed] [Google Scholar]
- 12.Xu X, Ji Y, Stormo G. Discovering cis-regulatory RNA in Shewanella genomes by support vector machines. PLoS Comput. Biol. 2009;5:e1000338. doi: 10.1371/journal.pcbi.1000338. [DOI] [PMC free article] [PubMed] [Google Scholar]
- 13.Zhao Y, Wang Z. RNA secondary structure prediction based on support vector machine classification. Chin. J. Biotechnol. 2008;24:1140–1148. [PubMed] [Google Scholar]
- 14.Ruan J, Stormo G, Zhang W. An iterated loop matching approach to the prediction of RNA secondary structures with pseudoknots. Bioinformatics. 2004;20:58–66. doi: 10.1093/bioinformatics/btg373. [DOI] [PubMed] [Google Scholar]
- 15.Jabbari H, Condon A, Zhao S. Novel and efficient RNA secondary structure prediction using hierarchical folding. J. Comput. Biol. 2008;15:139–163. doi: 10.1089/cmb.2007.0198. [DOI] [PubMed] [Google Scholar]
- 16.Tahi F. Ph.D. Thesis. University of Paris XI, Orsay; 1997. Méthodes Formelles d'A;nalyse des Séquences de Nucléotides. [Google Scholar]
- 17.Tahi F, Régnier M, Gouy M. Automatic RNA secondary structure prediction with a comparative approach. Comput. Chem. 2002;26:521–530. doi: 10.1016/s0097-8485(02)00012-8. [DOI] [PubMed] [Google Scholar]
- 18.Tahi F, Engelen S, Régnier M. IEEE International Symposium on BioInformatics and BioEngineering (BIBE), Maryland. Bethesda, Maryland, USA: IEEE Computer Society; 2003. A fast algorithm for RNA secondary structure prediction including pseudoknots; pp. 11–17. [Google Scholar]
- 19.Tahi F, Engelen S, Régnier M. P-DCfold or how to predict all kinds of pseudoknots in RNA secondary structures. Int. J. Artif. Intell. Tools. 2005;14:703–713. [Google Scholar]
- 20.Perriquet O, Touzet H, Dauchet M. Finding the common structure shared by two homologous RNAs. Bioinformatics. 2003;19:108–116. doi: 10.1093/bioinformatics/19.1.108. [DOI] [PubMed] [Google Scholar]
- 21.Gorodkin J, Heyer L, Stormo G. Finding the most significant common sequence and structure motifs in a set of RNA sequences. Nucleic Acids Res. 1997;25:3724–3732. doi: 10.1093/nar/25.18.3724. [DOI] [PMC free article] [PubMed] [Google Scholar]
- 22.Mathews D, Turner D. Dynalign: an algorithm for finding the secondary structure common to two RNA sequences. J. Mol. Biol. 2002;317:191–203. doi: 10.1006/jmbi.2001.5351. [DOI] [PubMed] [Google Scholar]
- 23.Harmanci AO, Sharma G, Mathews D. Efficient pairwise RNA structure prediction using probabilistic alignment constraints in dynalign. BMC Bioinformatics. 2007;8:130. doi: 10.1186/1471-2105-8-130. [DOI] [PMC free article] [PubMed] [Google Scholar]
- 24.Harmanci AO, Sharma G, Mathews DH. PARTS: probabilistic alignment for RNA joint secondary structure prediction. Nucleic Acids Res. 2008;36:2406–2417. doi: 10.1093/nar/gkn043. [DOI] [PMC free article] [PubMed] [Google Scholar]
- 25.Do C, Foo C, Batzoglou S. A max-margin model for efficient simultaneous alignment and folding of RNA sequences. Bioinformatics. 2008;24:68–76. doi: 10.1093/bioinformatics/btn177. [DOI] [PMC free article] [PubMed] [Google Scholar]
- 26.Fang X, Luo Z, Yuan B, Wang J. Improving the prediction of RNA secondary structure by detecting and assessing conserved stems. Bioinformation. 2007;2:222–229. doi: 10.6026/97320630002222. [DOI] [PMC free article] [PubMed] [Google Scholar]
- 27.Engelen S, Tahi F. Predicting RNA secondary structure by the comparative approach: how to select the homologous sequences. BMC Bioinformatics. 2007;8:464. doi: 10.1186/1471-2105-8-464. [DOI] [PMC free article] [PubMed] [Google Scholar]
- 28.Griffiths-Jones S, Bateman A, Marshall M, Khanna A, Eddy SR. Rfam: an RNA family database. Nucleic Acids Res. 2003;31:439–441. doi: 10.1093/nar/gkg006. [DOI] [PMC free article] [PubMed] [Google Scholar]
- 29.Szymanski M, Barciszewska MZ, Erdmann VA, Barciszewski J. 5S ribosomal RNA database. Nucleic Acids Res. 2002;30:176–178. doi: 10.1093/nar/30.1.176. [DOI] [PMC free article] [PubMed] [Google Scholar]
- 30.Zwieb C. The uRNA database. Nucleic Acids Res. 2003;24:76–79. doi: 10.1093/nar/24.1.76. [DOI] [PMC free article] [PubMed] [Google Scholar]
- 31.Gorodkin J, Knudsen B, Zwieb C, Samuelsson T. SRPDB (Signal Recognition Particle Database. Nucleic Acids Res. 2001;29:169–170. doi: 10.1093/nar/29.1.169. [DOI] [PMC free article] [PubMed] [Google Scholar]
- 32.Zwieb C, Gorodkin J, Knudsen B, Burks J, Wower J. tmRDB (tmRNA database) Nucleic Acids Res. 2003;31:446–447. doi: 10.1093/nar/gkg019. [DOI] [PMC free article] [PubMed] [Google Scholar]
- 33.Williams KP, Bartel DP. The tmRNA website. Nucleic Acids Res. 1998;26:163–165. doi: 10.1093/nar/26.1.163. [DOI] [PMC free article] [PubMed] [Google Scholar]
- 34.Brown J. The ribonuclease P database. Nucleic Acids Res. 1999;27:314. doi: 10.1093/nar/27.1.314. [DOI] [PMC free article] [PubMed] [Google Scholar]
- 35.Peer Y.VD, Rijk PD, Wuyts J, Winkelmans T, Wachter RD. The European small subunit ribosomal RNA database. Nucleic Acids Res. 2000;28:175–176. doi: 10.1093/nar/28.1.175. [DOI] [PMC free article] [PubMed] [Google Scholar]
- 36.Wuyts J, Rijk PD, Peer Y.VD, Winkelmans T, Wachter RD. The european large subunit ribosomal RNA database. Nucleic Acids Res. 2001;29:175–177. doi: 10.1093/nar/29.1.175. [DOI] [PMC free article] [PubMed] [Google Scholar]
- 37.RNAalifold. 2009. [10 July 2009, date last accesed]. Available at http://rna.tbi.univie.ac.at/cgi-bin/rnaalifold.cgi. [Google Scholar]
- 38.Pfold. 2009. [10 July 2009, date last accesed]. Available at http://www.daimi.au.dk/compbio/rnafold/ [Google Scholar]
- 39.ILM. 2009. [10 July 2009, date last accesed]. Available at http://www.cs.wustl.edu/zhang/projects/rna/ilm/ [Google Scholar]
- 40.CaRNAc. 2009. [10 July 2009, date last accesed]. Available at http://bioinfo.lifl.fr/carnac/carnac.php. [Google Scholar]
- 41.Engelen S, Tahi F. Proceedings of the International Conference on Mathematics and Engineering Techniques in Medicine and Biological Sciences. Las Vegas, Nevada, USA: CSREA Press; 2005. An open problem in RNA secondary structure prediction by the comparative approach; pp. 293–299. [Google Scholar]
- 42.Gautheret D, Konings D, Gutell RR. G.U base pairing motifs in ribosomal RNA. RNA. 1995;1:807–814. [PMC free article] [PubMed] [Google Scholar]
- 43.Vawter L, Brown WM. Rates and patterns of base change in the small subunit ribosomal RNA gene. Genetics. 1993;134:597–608. doi: 10.1093/genetics/134.2.597. [DOI] [PMC free article] [PubMed] [Google Scholar]
- 44.Tinoco I, Uhlenbeck O. Estimation of secondary structure in ribonucleic acids. Nature. 1971;230:362–367. doi: 10.1038/230362a0. [DOI] [PubMed] [Google Scholar]
- 45.Elgavish T, Cannone JJ, Lee JC, Harvey SC, Gutell RR. AA.AG@Helix.Ends: A:A and A:G base-pairs at the ends of 16S and 23S rRNA helices. J. Mol. Biol. 2001;310:735–753. doi: 10.1006/jmbi.2001.4807. [DOI] [PubMed] [Google Scholar]
- 46.Woese C, Winker S, Gutell RR. Architecture of ribosomal RNA: constraints on the sequence of tetra-loops. Proc. Nat. Acad. Sci. USA. 1990;87:8467–8471. doi: 10.1073/pnas.87.21.8467. [DOI] [PMC free article] [PubMed] [Google Scholar]
- 47.Gluick TC, Draper DE. Thermodynamics of folding a pseudoknotted mRNA fragment. J. Mol. Biol. 1994;241:246–262. doi: 10.1006/jmbi.1994.1493. [DOI] [PubMed] [Google Scholar]
- 48.Tand CK, Draper DE. An unusal mRNA pseudoknot structure is recognized by a protein translation repressor. Cell. 1989;57:531–536. doi: 10.1016/0092-8674(89)90123-2. [DOI] [PubMed] [Google Scholar]
- 49.Tand CK, Draper DE. Evidence for allosteric coupling between the ribosome and repressor binding sites for a translationally regulated mRNA. Biochemistry. 1990;29:4434–4439. doi: 10.1021/bi00470a025. [DOI] [PubMed] [Google Scholar]
- 50.Gardner PP, Giegerich R. A comprehensive comparison of comparative RNA structure prediction approaches. BMC Bioinformatics. 2004;5:140. doi: 10.1186/1471-2105-5-140. [DOI] [PMC free article] [PubMed] [Google Scholar]
- 51.Baldi P, Brunak S, Chauvin Y, Andersen C, Nielsen H. Assessing the accuracy of prediction algorithms for classication: an overview. Bioinformatics. 2000;16:412–424. doi: 10.1093/bioinformatics/16.5.412. [DOI] [PubMed] [Google Scholar]
- 52.Mfold. 2009. [Last accessed date July 10, 2009]. Availbale at http://mfold.bioinfo.rpi.edu/cgi-bin/rna-form1.cgi. [Google Scholar]
- 53.Zuker M, Stiegler P. Optimal computer folding of large RNA sequences using thermodynamics and auxiliary information. Nucleic Acids Res. 1981;9:133–148. doi: 10.1093/nar/9.1.133. [DOI] [PMC free article] [PubMed] [Google Scholar]
- 54.Bernhart S, Hofacker I, Will S, Gruber A, Stadler P. RNAalifold: improved consensus structure prediction for RNA alignments. BMC Bioinformatics. 2008;9:474. doi: 10.1186/1471-2105-9-474. [DOI] [PMC free article] [PubMed] [Google Scholar]
- 55.Will S, Reiche K, Hofacker IL, Stadler PF, Backofen R. Inferring noncoding RNA families and classes by means of genome-scale structure-based clustering. PLoS Comput. Biol. 2007;3:e65. doi: 10.1371/journal.pcbi.0030065. [DOI] [PMC free article] [PubMed] [Google Scholar]
- 56.LocARNA. 2009. [10 July 2009, date last accesed]. http://rna.tbi.univie.ac.at/cgi-bin/ locarna.cgi. [Google Scholar]
- 57.Sankoff D. Simultaneous solution of the RNA folding, aligment and protosequence problems. SIAM J. Appl. Math. 1985;45:810–825. [Google Scholar]
- 58.Reeder J, Steffen P, Giegerich R. pknotsrg: RNA pseudoknot folding including near-optimal structures and sliding windows. Nucleic Acids Res. 2007;35:W320–W324. doi: 10.1093/nar/gkm258. [DOI] [PMC free article] [PubMed] [Google Scholar]
- 59.PknotsRG. 2009. [10 July 2009, date last accesed]. Available at http://bibiserv.techfak.uni-bielefeld.de/pknotsrg/ [Google Scholar]
- 60.Dawson W, Fujiwara K, Kawai G. Prediction of RNA pseudoknots using heuristic modeling with mapping and sequential folding. PLoS ONE. 2007;2:e905. doi: 10.1371/journal.pone.0000905. [DOI] [PMC free article] [PubMed] [Google Scholar]
- 61.Vsfold. 2009. [10 July 2009, date last accesed]. Available at http://www.rna.it-chiba.ac.jp/vsfold/vsfold5/0. [Google Scholar]
- 62.Thompson J, Higgins D, Gibson T. CLUSTAL W: improving the sensitivity of progressive multiple sequence alignment through sequence weighting, position specific gap penalties and weight matrix choice. Nucleic Acids Res. 1994;22:4673–4680. doi: 10.1093/nar/22.22.4673. [DOI] [PMC free article] [PubMed] [Google Scholar]
- 63.Katoh K, Toh H. Improved accuracy of multiple ncRNA alignment by incorporating structural information into a MAFFT-based framework. BMC Bioinformatics. 2008;9:212. doi: 10.1186/1471-2105-9-212. [DOI] [PMC free article] [PubMed] [Google Scholar]
- 64.Moretti S, Wim A, Higgins D, Xenarios I, Notredame C. R-Coffee: a web server for accurately aligning noncoding RNA sequences. Nucleic Acids Res. 2008;36:W10–W13. doi: 10.1093/nar/gkn278. [DOI] [PMC free article] [PubMed] [Google Scholar]
- 65.Hofacker I, Fontana W, Stadler P, Bonhoeffer L, Tacker M, Schuster P. Fast folding and comparison of RNA secondary structures. Monatsh. Chem. 1994;125:167–188. [Google Scholar]
- 66.Ding Y, Lawrence C. A statistical sampling algorithm for RNA secondary structure prediction. Nucleic Acids Res. 2003;31:7280–7301. doi: 10.1093/nar/gkg938. [DOI] [PMC free article] [PubMed] [Google Scholar]
Associated Data
This section collects any data citations, data availability statements, or supplementary materials included in this article.