


Abstract
The transcriptional response driven by Hypoxia-inducible factor (HIF) is central to the adaptation to oxygen restriction. Hence, the complete identification of HIF targets is essential for understanding the cellular responses to hypoxia. Herein we describe a computational strategy based on the combination of phylogenetic footprinting and transcription profiling meta-analysis for the identification of HIF-target genes. Comparison of the resulting candidates with published HIF1a genome-wide chromatin immunoprecipitation indicates a high sensitivity (78%) and specificity (97.8%). To validate our strategy, we performed HIF1a chromatin immunoprecipitation on a set of putative targets. Our results confirm the robustness of the computational strategy in predicting HIF-binding sites and reveal several novel HIF targets, including RE1-silencing transcription factor co-repressor (RCOR2). In addition, mapping of described polymorphisms to the predicted HIF-binding sites identified several single-nucleotide polymorphisms (SNPs) that could alter HIF binding. As a proof of principle, we demonstrate that SNP rs17004038, mapping to a functional hypoxia response element in the macrophage migration inhibitory factor (MIF) locus, prevents induction of this gene by hypoxia. Altogether, our results show that the proposed strategy is a powerful tool for the identification of HIF direct targets that expands our knowledge of the cellular adaptation to hypoxia and provides cues on the inter-individual variation in this response.
INTRODUCTION
Cells respond to chronic hypoxia by altering their gene expression pattern to optimize metabolic oxygen consumption, maintain energy balance and restore oxygen supply. Many of the genes involved in this adaptive response are directly regulated by the hypoxia-inducible factor (HIF) (1), a transcription factor that is activated when oxygen tension drops. HIF is a heterodimer composed of an oxygen-regulated alpha subunit (HIFα) (2) and a constitutively expressed beta subunit (HIFβ, also known as Aryl receptor nuclear translocator, ARNT) (3) that partners with a number of basic-helix–loop–helix transcription factors. Oxygen affects both HIFα half-life (4) and transactivation (5). In normoxia, HIFα is hydroxylated at two proline residues (6,7) by a family of dioxygenases (EGL nine homologs, EGLNs) that require oxygen as cosubstrate (8,9). This posttranslational modification labels HIFα for proteosomal degradation, as the proline-hydroxilated form is recognized by an E3-ubiquitin ligase complex that contains the VHL tumor suppressor (10). In addition, another dioxygenase (factor inhibiting HIF, FIH) catalyzes the oxygen-dependent hydroxilation of an asparagine residue, located in the C-terminal transactivation domain, preventing its interaction with the p300 coativator and blunting HIFα transcriptional activity (11–13). In hypoxia, all these hydroxylation reactions become compromised, due to the reduced availability of oxygen, resulting in HIFα stabilization and recruitment of coactivators, such as p300. Thus, under hypoxia, HIF accumulation allows its interaction with HIFβ and its binding to the RCGTG motif, known as hypoxia response element (HRE), within regulatory regions of its target genes. There are three genes encoding for HIFα subunits: HIF1α, HIF2α (also known as EPAS) and HIF3α. HIF1α and HIF2α have been extensively studied, while HIF3a remains poorly characterized. The regulation of HIF1α and 2α by hypoxia is similar and both bind to the same core motif (1). However, recent evidence indicates that these transcription factors induce overlapping but not identical sets of genes (14,15), suggesting nonredundant functions for HIF1α and HIF2α.
Given the central role of HIF in the transcriptional response to hypoxia, the characterization of HIF target genes provides critical insights into the adaptations required to cope with reduced oxygen tension. Over a hundred HIF-targets have been described (1) as the result of research efforts focused on individual genes. These studies revealed that many of the genes regulated by hypoxia are involved in the reprogramming of cellular metabolism and restoration of oxygen supply. More recently, a number of studies described the effect of hypoxia in the transcriptome by means of gene expression profiling. These studies, covering a wide range of cell types and conditions (16–26), revealed a large number of novel potential targets. Although undoubtedly relevant, a major drawback of this approach is that it cannot distinguish between direct and secondary HIF targets. In addition, no attempts have been made to combine the results of all these studies. Such integrative studies, or meta-analysis, have higher statistical power to detect relevant effects than single studies and provide a generalization to the individual experiments. In fact, several works (27) have demonstrated that the application of meta-analysis to multiple independent gene expression data sets leads to the identification of sets of significant, differentially expressed genes, void of the artifacts of individual studies. Finally, two recent reports (28,29) coupled transcript profiling and chromatin immunoprecipitation (ChIP) followed by hybridization to genomic tiling microarrays (ChIP–Chip) to identify direct HIF targets. A comparative analysis is needed to reveal the extent of overlap between conclusions of both studies and also whether further studies are required. Thus, in spite of intense research efforts, the complete characterization of HIF targets is still unresolved.
In silico identification of transcription-factor-binding sites (TFBS) is a powerful tool to complement experimental identification of transcription factor targets (30). These methods rely on the comparison of candidate sequences to a position-specific scoring matrix (PSSM) constructed by alignment of known binding sites for the transcription factor of interest. HIF binds to a short, but extremely well-conserved [A/G]CGTG motif. Conservation of other positions outside this motif is controversial: while some studies suggest that some positions show a base distribution significantly different from random expectation (1,31,32), other studies fail to find conservation outside the core RCGTG (28,29). Nevertheless, the low information content of most PSSMs, including that of HIF, and the size of mammalian genomes result in a large number of potential hits across the genome. Since conserved noncoding sequences (CNS) are enriched in cis-regulatory elements (33,34), a successful approach to reduce the number of spurious hits is to restrict the search for TFBS to these regions. The identification of CNSs, based on multiple species alignment of noncoding genomic sequences, reveals evolutionarily conserved regions (phylogenetic footprinting) that may have been selected during evolution due their regulatory or structural function. The algorithm PhastCons implements a two state hidden Markov model that provides a score value that reflects the conservation of each base of a reference genome within a multiple species alignment (35). Therefore, potential regulatory regions can be inferred from PhastCons elements (groups of adjacent nucleotides with a significant conservation score).
Recent works (36–38) have demonstrated that the combination of gene expression data and TFBS prediction is a powerful tool for the identification of transcription factor target genes. In the present study, we applied a probabilistic model that integrates the evidence for the regulation of each particular gene by hypoxia (transcript profiling meta-analysis) and the presence of high-scoring HIF-binding sites (HBSs) for the identification of novel HIF targets. The application of this strategy results in a list of 216 predicted targets, most of them not previously reported as regulated by hypoxia. We tested the accuracy of our strategy by experimentally validating several of the identified HBSs by ChIP–quantitative polymerase chain reaction (qPCR). Moreover, we demonstrated that RCOR2, one of the borderline targets identified, is indeed a HIF-target gene. In addition, the strategy reported herein provides the coordinates for several hundred potential HBSs. We propose that, in addition to the identification of HIF-target genes, this information can be useful to identify genome variants within the population that could have an altered hypoxic response. As a proof of principle, we found that one of these variants has a major impact on the hypoxic induction of macrophage migration inhibitory factor (MIF). Given the relevance of hypoxia in pathologies, such as cancer and cardiovascular disease, an altered response to hypoxia could be among the underlying causes explaining different clinical courses and/or response to treatments.
MATERIALS AND METHODS
Cell culture and hypoxic conditions
The cell lines HeLa, HepaC1/4 and HepG2 were maintained in Dulbecco’s modified Eagle medium, while HepaC1 and HepaC4 cell lines were grown in MEM-α medium. In all cases, the culture medium was supplemented with 100 U/ml penicillin, 100 μg/ml streptomycin and 10% (v/v) fetal bovine serum. Cells were grown at 37°C in a humidified atmosphere containing 5% CO2. For hypoxia treatments, cells were grown at the indicated oxygen concentration in a Whitley hypoxystation (don Whitley Scientific, UK).
Plasmid construction
Human genomic DNA extracted from HeLa cells was used as template for PCR amplification of MIF and RCOR2 promoter regions using primers 1 + 2 and 7 + 8 (Supplementary Table S1), respectively. Reporter constructs were generated by cloning the PCR products into the pGL3-Basic plasmid (Invitrogen). The identity of all constructs was verified by sequencing. The mutant HRE and single-nucleotide polymorphism (SNP) constructs were generated by site-directed mutagenesis, employing PCR QuikChange Site-direct mutagenesis kit (Stratagene). Primers harboring the desired mutation were 2 + 3 (HREmut MIF), 9 + 10 (HREmut RCOR2) and 5 + 6 (SNP-HREmut MIF), respectively (Supplementary Table S1).
Reporter assays
Cells were plated in six-well plates 24 h prior transfection. Each plate was transfected with a DNA mixture containing 0.9 μg (HeLa cells) or 1.9 μg (HepG2 cells) of the indicated reporter plasmid and 0.1 μg of a plasmid encoding the Renilla firefly luciferase under the control of a SV40 promoter. 12–13 h after transfection, cells were replated in 24-well plates and then transferred to hypoxic conditions (1% oxygen) or left under normoxic conditions for 24 h. Subsequently, firefly and renilla luciferase activities were determined using a dual luciferase system (Promega, Madison, WI, USA). In order to correct for transfection efficiency, the luciferase activity was normalized to the Renilla luciferase activity. Each experimental condition was assayed in duplicate.
ChIP assays
For ChIP assays, HeLa cells were grown on 10-cm plates until they reached 85% confluence, at which point they were exposed to hypoxia (1% oxygen) or left under normoxic conditions for 6 h. Subsequently, cells were fixed for 12 min at 4°C by adding formaldehyde to culture media to final concentration of 1% (v/v). Cross-linking was stopped by the addition of glycine (0.125 M final). The cells were washed with cold phosphate-buffered saline (PBS) and then lysed by scraping in 1 ml of lysis buffer [1% sodium dodecyl sulfate (SDS), 10 mM EDTA, 50 mM Tris/HCl, pH 8.1 and a protease inhibitor cocktail, Roche]. Cell lysates were incubated on ice for 10 min and then sonicated to shear the DNA to fragments between 200 and 1500 bp. After the removal of the insoluble material by centrifugation, 50 μl of each sample was removed and stored (input), while 100 μl were diluted in 1-ml immunoprecipitation buffer (1% Triton X-100, 2 mM EDTA, 150 mM NaCl and 20 mM Tris/HCl, pH 8.1). The lysates were precleared with 200 μg of a Salmon Sperm DNA/Protein A agarose 50% slurry (Upstate Biotechnology, Lake Placid, NY, USA) for 1 h at 4°C. The samples were then immunoprecipitated twice, initially with whole rabbit serum for 6 h [immunoglobulin G (IgG) control] and then overnight at 4°C with a polyclonal anti-HIF1 alpha antiserum (Abcam, ab2185). Immunocomplexes were recovered by the addition of 400 μg of Salmon Sperm DNA/Protein A agarose 50% slurry to the samples that were then sequentially washed for 15 min in TSE I (0.1% SDS, 1% Triton X-100, 2 mM EDTA, 20 mM Tris/HCl, pH 8.1 and 150 mM NaCl), TSE II (0.1% SDS, 1% Triton X-100, 2 mM EDTA, 20 mM Tris/HCl, pH 8.1 and 500 mM NaCl) and buffer III (0.25 M LiCl, 1% NP-40, 1% deoxycholate, 1 mM EDTA and 10 mM Tris/HCl, pH 8.1). Finally, the complexes were washed twice with TE buffer (10 mM Tris, pH 8.0 and 1 mM EDTA) and extracted twice with a buffer containing 1% SDS and 0.1 M NaHCO3. The eluates were pooled, and cross-linking was reversed by the addition of 200 mM NaCl (final concentration) and overnight incubation at 65°C. The proteins were removed by the addition of proteinase K (30 μg/sample) for 2 h at 42°C, and the DNA was purified by phenol–chloroform extraction and ethanol precipitation. Immunoprecipitated DNA was amplified by qPCR using the primers (11–48) indicated in Supplementary Table S1.
RNA extraction and qPCR
Cells were harvested in 1 ml of Ultraspec reagent (Biotecx). Subsequently RNA was reverse-transcribed to cDNA (Improm-II reverse transcriptase; Promega).
q-PCR was performed with the LC FastStart DNA master SYBR GreenI kit (Roche Applied Science) and in a Light Cycler system (Roche Applied Science) using the indicated primers (Supplementary Table SI). Data were analyzed with Light Cycler software version 3.5.28 (Idaho Technology). For each sample, duplicate determinations were made and the gene copy number was normalized to the amount of β-actin.
Meta-analysis of gene profiling data sets
For the meta-analysis, we downloaded 16 independent experiments from Gene Expression Omnibus (GEO, http://www.ncbi.nlm.nih.gov/geo/) (39) database (Supplementary Table S2). For those experiments analyzing more than two conditions (for example the effect of hypoxia and HIF overexpression), we generated independent data sets for each comparison. Thus, we generated 19 data sets from the 16 experiments (Supplementary Table S2). In all the cases, untreated normoxic cells were used as reference. For each data set, we calculated the mean for each probe values in the biological replicates. Probes with null values were discarded. Then, for each probe, we calculated the effect of treatments (hypoxia, hypoxia mimetics or HIF expression) as the logarithm of the ratio of the means of treated and control samples. Finally, individual log-ratios values were normalized by subtraction of the mean of all the log-ratios across the data set and division by their standard deviation.
For the meta-analysis, each gene locus was treated independently and tested for the null hypothesis that no gene was modulated by treatments. To this end, the normalized log-ratio values of all probes (across all data sets) mapping to the gene locus under consideration were compared to zero using one-sample t-test. The resulting P-values were corrected for multiple testing by applying false discovery rate. Genes with adjusted P-values <0.01 were considered significantly regulated by treatments. Custom Perl scripts were used for the analysis, complemented with R-based extensions for the statistical calculations.
Identification and scoring of HBSs
For the identification of HBSs, we restricted our search to noncoding regions of genes. To this end, we considered all the RefSeq transcripts encoded by each locus and identified the intronic and untranslated regions within by projecting all transcripts, therefore excluding transcript-specific coding sequences. In addition, for each locus, we selected a 5-kb region upstream the transcription start site, TSS. When necessary, the upstream region was trimmed to avoid overlap with adjacent loci. For genes with several TSS, we selected the outermost TSS to define the 5-kb upstream region (the region upstream the remaining TSS is considered as part of the intronic regions). After the localization of all noncoding regions, we identified mammal or vertebrate PhastCons elements (35) within. Adjacent PhastCons elements were fused if more than 50% of the sequence in the resulting fused region was conserved. We refer to these PhastCons elements located in noncoding regions as conserved noncoding sequences (33) or CNSs. Then, we identified conserved RCGTG motifs within these CNSs. A motif was considered conserved when it was present at least in four mammals, including human and mouse. Sequences lacking conserved RCGTG motifs were discarded as potential HBSs. Finally, sequences containing a conserved motif were scored according to a PSSM. For the generation of this matrix, we selected 23 well-characterized HIF-binding sequences corresponding to 22 HIF-target genes, together with an orthologous sequence (Supplementary Table S4). Then, we used a chi-squared test to determine those positions with an observed distribution of residues significantly different to that expected by chance. This analysis revealed that, in addition to the RCGTG motif, some positions from −1 to +17 (being the R residue of the core motif the position +1) showed a significantly skewed distribution (P < 0.01). For each position, we calculated the log-odds ratio of the observed frequencies of each nucleotide over the background frequency found for that nucleotide. The background frequency was obtained from the counts of each nucleotide in the CNSs: A, 0.275; C, 0.223; G, 0.229; T, 0.273. The log-odds ratios were arranged in a 4 × 18 matrix (a column per position and a row for each nucleotide) so that the score for the nucleotide i at position j is:
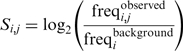 |
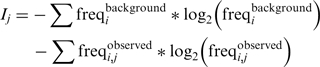
To calculate the score for the whole sequence (S) we added the individual scores for each position. Since not all positions had the same information content (Supplementary Table S4), the contribution of each position to the final score was weighted by the information content of the position (Ij):
The information content for each position j was calculated from the Shannon entropy:
 |
The RefSeq coordinates, PhastCons coordinates and the alignments corresponding to the identified CNSs were downloaded from the UCSC genomic browser (http://genome.ucsc.edu/index.html) (40,41). All coordinates correspond to the hg18 human genome assembly. The analysis was performed with custom scripts written in Perl.
Classification of genes as HIF target/nontarget
To classify any given gene as a HIF target or nontarget, we calculated the relative likelihood that the gene belongs to any of these two groups. To this end, we constructed models that, given the fold induction of the gene and associated P-value according to our meta-analysis and the score of the potential HBSs found within the gene locus, assign a probability to the gene in each of the two states. Then, the relative likelihood of being a HIF target is the ratio (odds ratio) between the probabilities according to each model. In the HIF-target model (T ), we fitted the distribution of fold induction  and HBS score
  values for the set of well-characterized HIF-target genes (Supplementary Table S4) to a normal (Gauss) density function. For the nontarget (Background, B) model, we assumed that most of the genes in the genome are not regulated by HIF, thus calculated the Gaussian density functions describing the distribution of fold induction and HBS score values for all the analyzed genes
  and
and  , respectively]. Then, the probability of a gene being a HIF target given its fold induction (and P-value) and HBS score, P(x,y,p|T ), is the product of functions describing HBS score and fold induction:
where x and p are the meta-analysis values for the fold induction and associated P-value respectively and max (yi) is the maximum score of the HBSs found within the gene locus. Similarly the probability of the gene being a nontarget (background) is:
Finally, the ratio of these two likelihoods (odds ratio) represent the relative probability of being a HIF-target gene:
In these expressions, the contribution of the fold induction value  to the probability was weighted by the P-value associated to the mean so that when the fold induction is not reliable (for large P-values approaching 1) its contribution to the probability is very similar for target and nontarget:
In this case, the classification (odds ratio) is just based on the score value:
RESULTS
Meta-analysis of gene expression profile data sets from cells exposed to hypoxia
In order to identify HBSs, we designed a strategy based on the intersection of two independent approaches: (i) identification of hypoxia-modulated genes through the analysis of multiple gene expression data sets from publicly available databases (transcription profiling meta-analysis); (ii) identification of evolutionarily conserved HIF-binding motifs within potential cis-regulatory regions (phylogentic footprinting). For the first approach, we selected 19 data sets from the GEO database (http://www.ncbi.nlm.nih.gov/geo/) (39) corresponding to 16 independent experiments that analyzed the gene expression profile of cells exposed to hypoxia or hypoxia mimetics (for simplicity, we refer to them as hypoxia herein). We processed each of these data sets to calculate the log2 of the hypoxia/normoxia ratio (log-ratio) for each probe and then considered as significantly regulated by hypoxia those probes whose log ratio was >1.96 or >2.6 SD above or below the data set mean. A gene was considered modulated when at least one of its probes was significantly up- or downregulated. This analysis revealed that only a small group of genes was induced by hypoxia across all the experiments (Figure 1A and Supplementary Table S3). In addition, even when a relatively relaxed criterion (>1.96 SD from the mean) was used to ascribe genes to the downregulated group, no gene was found consistently repressed by hypoxia in all the experiments (Figure 1A). On the other hand, the number of nonredundant genes modulated by hypoxia increased rapidly with the number of experiments (Figure 1B). When taking into consideration all 19 data sets, we found a total number of 2864 up- and 2929 downregulated nonredundant genes that together account for 49.6% of the genes represented in these data sets. These results indicate that the simple intersection of results from individual experiments is too restrictive, while their combination results in excessive noise, highlighting the need for a statistical analysis of the combined data sets. To this end, we treated each gene as an independent hypothesis, compared to the null hypothesis that the gene is not modulated by hypoxia and thus the mean value of the log-ratios of all its probes is 0. For each gene, we obtained the value of the log-ratio for all associated probes across all the data sets, calculated their mean (mean fold induction) and used one-sample t-test to ask whether it differed significantly from 0. After correction of the resulting P-values for multiple testing (false discovery rate), we selected genes with a P-value below 0.01 as regulated by hypoxia. This analysis resulted in a total of 259 (2.22%) genes induced and 191 (1.64%) genes repressed by hypoxia out of 11 673 genes represented in all GEO data sets. As a crude measure of the meta-analysis performance, we looked for known HIF targets (1) in the set of upregulated genes identified in each independent study or in our meta-analysis. As shown in Figure 1C, the meta-analysis excelled the performance of the individual studies, recovering a higher number of known targets than any of them. In addition, the increased sensitivity did not seem to be accompanied by a reduction of specificity, since the total number of upregulated genes identified by the meta-analysis was not different to the average number identified in individual studies.
Figure 1.

Comparison of individual gene profiling studies versus meta-analysis. The indicated number of data sets (number of data sets) was randomly selected out from the 19 GEO tables without replacement. The number of genes whose expression was 1.96 SD from the mean in all (A) or at least in one (B) of the selected data set was recorded and the procedure repeated 10 times. The graph represents the mean number of recorded genes and error bars the standard deviation. (C) For each individual data set (1 to 19, see Supplementary Table S2), the genes showing a fold induction ratio >2.6 SD above the mean were considered upregulated. In the case of the meta-analysis (Meta-A), genes with a corrected P-value <0.01 and mean fold induction positive were considered upregulated. The graph represents the number of known target genes (according to ref. 1) represented in the upregulated group in each case (upper graph) together with the total number of upregulated genes (lower graph). The horizontal lines in each graph represent the average number of known and upregulated genes across the 19 data sets.
In-silico identification of HBSs
For the prediction of genome-wide HIF binding positions, we searched for the occurrence of RCGTG motifs in the human genome. Since CNSs are genomic regions enriched in cis-regulatory elements, we restricted our search to these regions in order to increase the chances of finding relevant motifs and to reduce the number of spurious hits. In addition, we only considered RCGTG motifs that were conserved in, at least, four species, including mouse. For each locus, we defined CNSs as PhastCons elements mapping to introns, untranslated regions and promoter regions upstream of the TSS. This search resulted in 9458 potential HBSs (conserved RCGTG motifs) distributed across 3980 genetic loci (34.1% of the analyzed genes). We found no conserved HBSs in the remaining 7693 (65.9%) gene loci analyzed.
Integration of the meta-analysis results and the presence of conserved HBSs showed that, as expected, the proportion of genes upregulated by hypoxia that contained at least one conserved HBS was significantly higher than expected by chance (P = 3.2 × 10⁻¹⁴, Table 1). In contrast, we found no significant association between the presence of an HBS and downregulation of the gene by hypoxia (P = 0.42, Table 1). Since we found no evidence for a direct role of HIF on downregulation of gene expression, we focused on genes upregulated by hypoxia throughout the study.
Table 1.
The presence of an HBS correlates with transcriptional upregulation but not with repression by hypoxia
| HBS+ |
HBS− |
P-value | ||||
|---|---|---|---|---|---|---|
| Obsr. | Expc. | Obsr. | Expc. | |||
| Upregulated | 145 | 88 | 113 | 170 | 3.18 × 10⁻¹⁴ | |
| Nonregulated | 3766 | 3823 | 7459 | 7402 | ||
| Downregulated | 69 | 64 | 121 | 126 | 0.42 | |
| Nonregulated | 3766 | 3771 | 7459 | 7454 | ||
Genes were classified as upregulated [mean log2(hypoxia/normoxia) > 0 and P < 0.01], downregulated [mean log2(hypoxia/normoxia) < 0 and P < 0.01] or nonregulated (P > 0.01).
The number of genes in each group with at least one potential HBS (HBS+) or none (HBS−) is shown (Obsr.).
The number of genes expected by chance in each group is also shown (Expc.).
The significance of the difference between the observed versus expected frequencies was calculated by a Chi-squared test and the resulting P-value is shown (P-value).
Scoring of HBSs
The alignment of a set of well-characterized HREs reveals that, in addition to the core RCGTG motif, other positions present a distribution of bases significantly different to that expected by chance (Supplementary Table S4 and ref. 31). Thus, we decided to use this information to infer functional HBSs. An 18-residue-long PSSM was generated based on the alignment of 46 sequences (see Supplementary Table S4 and ‘Materials and Methods’ section for details), and subsequently used it to assign a score value to each of the identified HBSs. In order to assess the ability of this score to discriminate functional HBSs, we studied the distribution of scores for HBSs recently identified by genome-wide ChIP–Chip (28,29). A comparative analysis reveals that there is very little overlap among the HIF-binding regions reported in these two studies (Figure 2A), probably because of the different cell lines/experimental conditions, data analysis and array platforms used in each work. Thus, we only considered the overlapping group of genes (Supplementary Table S5) as a reliable set of HIF targets. Figure 2B shows the distribution of scores of our predicted HBSs that map to any of the published HIF-binding regions (28,29). For comparison, we also plotted the score distribution for all the HBSs identified within CNSs across the genome (control). These results show that the score distribution for experimentally determined HBSs is shifted toward higher score values. In particular, the scores of the HBSs mapping to the regions identified in both reports (highly reliable HBSs) are higher than those of control genes, and the mean score for this group is significantly different from that of the controls (Figure 2B). It is worth pointing out that only four (GAPDH, LDHA, PGK1 and TF) of the 39 regions common to both ChIP–chip studies are coincident with the HRE regions used to construct the scoring matrix. Thus, the results shown in Figure 2B are not due to overfitting of our PSSM matrix to a specific set of HBSs.
Figure 2.

High HBS scores correlate with functional HIF-binding sites. (A) Venn diagram showing the number of overlapping HIF-binding sites identified by ChIP–chip in two published reports (ref. 29, Report #1; ref. 28, Report #2). (B) The scores of HBSs identified by our strategy were discretized (binning size 0.5 U) and their frequency distribution was calculated and adjusted to a Gauss curve by nonlinear fitting. The graph shows the resulting curves for all the HBSs identified across the genome (control), the HBSs mapping to HIF-binding regions identified by ChIP–chip in each report (Report #1, Report #2) or those HBS in regions common to both reports (#1∩#2). The scores in each group were compared (ANOVA) and statistically significant differences with the control group are indicated by asterisks (*, P < 0.01; **, P < 0.001). (C) The potential HBSs identified for each gene were ranked according to their score in decreasing order (rank 1 corresponds to the highest scoring HBS) and the rank of the predicted HBSs mapping to HIF-binding sites was recorded. The figure shows the rank frequency distribution for predicted HBSs mapping to HIF-binding regions identified by ChIP–Chip in each report (Report #1, Report #2) or regions common to both reports (#1∩#2). (D) Receiver operating characteristic (ROC) curve of known positive/negative (see text) targets versus prediction using a PT/PB ratio of 6.5 as threshold to classify genes as potential targets. (E) Genes identified as potential targets (PT/PB ratio >6.5) were sorted in decreasing PT/PB ratio order. The graph represents the rank of known HIF targets, according to ref. 1 (Stke) or a bibliographic search (PubMed), within the predicted target list. Horizontal line represents the median of each group.
Our search often predicted several HBSs for a given locus (Supplementary Table S6). Therefore, in order to further test the relevance of the score value, we next studied which one of the HBSs identified for each locus mapped to the sites bound by HIF according to ChIP–chip studies (28,29). To this end, the HBSs identified for each gene were ranked according to their score (rank 1 corresponded to the HBS with the highest score for a given locus) and the number of predicted HBSs of each rank that were coincident with an experimentally determined HBS was represented (Figure 2C). The data show that, in most cases, the experimentally validated HBS for a given locus matched the predicted HBS of highest score value. Altogether, the results in Figure 2B and C support that the HBS score is a good predictor of functionality.
Probabilistic model of integrated binding site and gene expression data
When combined, the two approaches described above resulted in a list (Supplementary Table S6) in which each gene had associated parameters reflecting the magnitude of its modulation by hypoxia (fold induction and associated P-value) and one or several potential HBSs mapping to regulatory regions within the locus, each of them having an associated score value. Our goal was to use this information to calculate a measure of the relative likelihood that the gene is an HIF target, as opposed of being nondirectly regulated by HIF (background). To this end, we constructed models that assign a probability to the gene in each of the two cases, and obtained the ratio of the two probabilities (odds ratio), we refer to this odds ratio as PT/PB ratio. In order to determine the optimum value for the PT/PB ratio for maximum sensitivity and specificity of gene classification, we used receiver operating characteristic (ROC) curve analysis (Figure 2D). For this analysis, the common set of 39 HIF targets from ChIP–Chip studies (Figure 2A and Supplementary Table S5) was used as known true targets. On the other hand, we selected genes that, while presenting conserved HBSs, were not induced by hypoxia (>30 probes in all data sets, mean fold induction between −0.3 and +0.3 and P > 0.5) as negative set. According to this analysis, a PT/PB ratio >6.5 resulted in an optimum sensitivity of 78.05% and a selectivity of 97.77%. Thus, we calculated the PT/PB ratio for all genes represented in GEO data sets and classified them as HIF targets (PT/PB ratio >6.5) or nontargets (PT/PB ratio ≤6.5 or lack of HBSs). Through this strategy, we predicted 216 HIF-target genes (Supplementary Table S6). Among them, 20 were previously known as HIF targets (1) and for 44 additional genes, some bibliographic evidence for their regulation by hypoxia was found (Supplementary Table S6). The remaining 152 genes are, to our knowledge, novel potential targets. The representation of the position of known target genes in our ranked list of predicted targets (Figure 2E) shows that they cluster toward the top positions [median values of 23 and 48, for the known targets from (1) and PubMed, respectively]. Thus, the PT/PB ratio accurately represents the probability of being an HIF target.
Experimental validation of model predictions
In order to evaluate the accuracy of our predictions we exposed HeLa cells to normoxia or hypoxia (1% oxygen) for 12 h and determined HIF1a binding to a set of predicted HBSs by ChIP–qPCR. For this purpose, we randomly selected six genes (RPLP0, MAFF, IDH2, SERTAD2, TPD52 and CARHSP1) among those that, according to our meta-analysis, were significantly upregulated by hypoxia (P < 0.01). To simplify the validation, we restricted our selection to genes having a single potential HBS. In addition, we included in this analysis the HBSs identified for the UDP-glucose Pyrophosphorylase (UGP2) gene due to its potential role in glycogen metabolism (manuscript submitted for publication) and the HREs identified within MIF and CDC2L6 genes because of their inter-individual variation (see subsequent discussion). Finally, we also included five HBSs motifs located in genes that were not induced by hypoxia in any of the GEO data sets (IRS4, STT3A, HIVEP1 and LTBP1) as a negative control group to estimate the background hypoxic/normoxic enrichment ratio. After the treatments, cells were processed for ChIP using an antibody directed to HIF1a. Then, we determined the quantity of each of the target sequences in the HIF1a immunoprecipitate by qPCR and expressed it as percentage of the input of immunoprecipitated chromatin. Finally, we calculated the ratio for the enrichment in samples exposed to hypoxia over normoxic samples. As expected, the hypoxic/normoxic enrichment ratio for the negative controls was close to 1 (Figure 3A). In addition, we found a high enrichment ratio for the HBS in the EGLN3 enhancer (31), used as positive control. Importantly, in spite of the high variability observed for the biological replicates, we found a good correlation between target prediction (Figure 3A bottom histogram) and experimental determination of HIF binding (Figure 3A, top graph). In general, only the candidates above the threshold (UGP2, TPD52, GBE1, MAFF1 and MIF) showed a consistent positive enrichment ratio in all three independent experiments. In contrast, the genes predicted as negative (MKRN1, RPLP0, IDH2 and SERTAD2) showed a pattern similar to that of negative controls. There were two exceptions, CARHSP1 and CDC2L2, that did not behave as predicted. It is important to note, however, that in both cases the PT/PB ratio was close to the threshold value of 6.5.
Figure 3.

Experimental validation of HIF binding to predicted sites. HeLa cells were exposed to normoxia or hypoxia (1% oxygen) for 6 h. After treatments, cells were processed for chromatin immunoprecipitation using antibodies directed to HIF1a. The binding of HIF1a to the predicted HBS within the indicated genes (A) was determined by qPCR. In the case of UGP2, HIF binding to two conserved HBSs was tested (B). The graph shows the ratio of the immunoprecipitated material in hypoxia over normoxia. The results from three independent experiments (black circles) and their median (line) are shown. In order to normalize data from the three independent experiments, the hypoxia/normoxia ratio is represented as fold over the mean value obtained for all the negative controls in each experiment. Neg1, IRS4; neg 2, STT3A; neg 3, HIVEP; neg4, LTBP1. The binding of HIF1a to the HRE within EGLN3 enhancer (E3+) or to a nonfunctional RCGTG within EGLN3 locus (E3–) were used as internal controls (ref. 31). For comparison, PT/PB ratio (in logarithmic scale) for each target is shown (bottom histogram), along with the threshold value of 6.5 (red line).
To further test the strength of our classifier, we determined HIF binding to the two potential HBSs identified within the UGP2 gene, HBS_1 and HBS_2, located in chromosome 2 at positions 63 922 445 and 63 923 300, respectively. According to their PT/PB ratios, 3 × 10⁻⁵ and 14.4, respectively, only one of them (HBS_2) was classified as an HBS. In agreement with our prediction, only HBS_2, but not HBS_1, was consistently found in HIF1a immunoprecipitates (Figure 3B). Collectively, these results confirm the accuracy of our predictions.
Next, we decided to determine the biological relevance of the identified HBSs. To this end, we focused on RE1-silencing transcription factor co-repressor 2 (RCOR2) because it was classified as positive by our strategy with a PT/PB ratio close to the threshold (9.63). In addition, it was not found significantly upregulated by hypoxia in the gene expression profiling meta-analysis (fold induction = 0.44 and P = 0.399). Thus, the classification of RCOR2 as a true target was mainly based on the score value of its HBS (see ‘Materials and Methods’ section).
First, we investigated HIF1a binding to the potential HBS by ChIP–qPCR. As shown in Figure 4A, chromatin from the target region was enriched in HIF1a-immunoprecipitates from cells exposed to hypoxia. The enrichment was similar to that observed for the EGLN3 enhancer and was not observed when a control IgG was used for the immunoprecipitation (Figure 4A). To determine whether HIF1a binding to this site had a functional effect, we measured levels of RCOR2 mRNA in cells exposed to hypoxia by qPCR. Figure 4B shows that RCOR2 mRNA was induced by hypoxia in several cell lines. Moreover, the induction of RCOR2 was dependent on functional HIF since it was observed in HepaC1 cells, but not in HepaC1 derivate lacking HIFβ (42). Finally, we generated a reporter construct (pGL3-RCOR2) by cloning the RCOR2 promoter region, containing the putative HRE, upstream a firefly luciferase gene. Transfection of this construct into HepG2 cells demonstrated that the promoter activity was induced by hypoxia (Figure 4C). The induction was of similar magnitude to that observed for other HIF-regulated regions such as VEGFA promoter and EGLN3 enhancer (Figure 4C). Importantly, the mutation of the putative HRE completely abolishes the regulation of RCOR2 promoter by hypoxia (Figure 4C). Thus, RCOR2 is a novel hypoxia regulated gene whose induction under low oxygen is dependent on HIF activity and the presence of the HRE identified by our computational strategy. In addition, these results further support the relevance of our HIF-target predictions and show the robustness of our approach even for borderline cases.
Figure 4.

RCOR2 is a HIF-target gene. (A) HeLa cells were exposed to normoxia (Nx) or hypoxia (Hx, 1% oxygen) for 12 h. After treatments, cells were processed for chromatin immunoprecipitation using antibodies directed to HIF1a (anti-HIF1a) or control immunoglobulins (control IgG). The binding of HIF1a to the predicted HRE within RCOR2, to the HRE within EGLN3 enhancer (EGLN3_pos) or to a nonfunctional RCGTG within EGLN3 locus (EGLN3_neg) were determined by quantitative (upper panel) and semi-quantitative PCR (RCOR2, lower panel). MWM, molecular weight marker. (B) HeLa, HepG2 and Hepa C1/C4 cells were exposed to normoxia or hypoxia for 12 h and the level of RCOR2 mRNA was determined by quantitative PCR. The amount of each mRNA in samples was normalized to the content of β-actin mRNA in the same sample. The graph represents the fold values of hypoxic over normoxic mRNA levels normalized to the value of 1 (horizontal axis). Data represents the values from three independent experiments and their average (horizontal bar). (C) HepG2 cells were transfected with a reporter plasmid containing RCOR2 promoter region (−1770 to −795) upstream a luciferase reporter gene. Where indicated (asterisk) the consensus HRE sequence (ACGT) was mutated to TAGC. For comparison, reporter constructs containing the EGLN3 enhancer and VEGF promoter were included. The graphs represent the corrected luciferase activity values of each hypoxic sample over the luciferase activity obtained in normoxic cells. Data shown are a representative experiment out of three independent determinations.
Identification of SNPs that interfere with the response to hypoxia
The adaptation to hypoxia is largely dependent on HIF-mediated gene expression. Therefore, the identification of SNPs mapping to HBSs could reveal individuals with an altered response to hypoxia. The strategy described above provided a catalog of genome-wide HBSs (Supplementary Table S6). Thus, we decided to use this information to search for SNPs mapping to these sites. We retrieved from the dbSNP (http://www.ncbi.nlm.nih.gov/projects/SNP/) entries whose genomic coordinates were coincident with the RCGTG motifs identified by our computational strategy. This search resulted in 146 SNP mapping to HBS motifs (Supplementary Table S7). Among them, 12 corresponded to sites within potential HIF targets (Table 2). We focused on rs17004038 and rs10624 because they were validated SNPs and were located within the only HRE identified for MIF and CDC2L6 genes, respectively. As shown in Figure 3, both sites bound HIF in vivo; thus, rs17004038 and rs10624 map to functional HBSs. In order to investigate the biological effect of these polymorphisms, we cloned the wild type MIF promoter region or the C→A variant, corresponding to the SNP rs17004038, upstream a firefly luciferase gene and performed reporter assays with these constructs. As previously reported (43), MIF promoter region (WT) was robustly induced by hypoxia (Figure 5). Mutation of the HBS identified by our strategy completely abrogated luciferase induction (Figure 5, mutHRE), demonstrating its role in the transcriptional upregulation of MIF promoter and in agreement with its binding to HIF (Figure 3). Importantly, the variant allele C→A was not upregulated by hypoxia and its behavior was indistinguishable from the mutant HRE (Figure 5). In contrast to the strong effect on the regulation by hypoxia, this point mutation had no effect on the basal activity of the promoter showing an activity 1.16 ± 0.46 (mean ± SD) over wild-type promoter (P = 0.85). These results demonstrate that some polymorphic variants have a dramatic effect on gene regulation by hypoxia.
Table 2.
SNP mapping to RCGTG motifs within potential HIF-targets
| SNP_ID | Validation | Allele | SNP_HBS | Gene | Chr | Coordin | Max_HBS |
|---|---|---|---|---|---|---|---|
| rs17004038 | cluster, freq | C/A | _ACGT | MIF | 22 | 24 236 591 | YES |
| rs17152486 | freq, hapmap | C/T | A_GTG | FLJ23834 | 7 | 105 671 891 | YES |
| rs3758554 | freq | C/G | CA_GC | LDB1 | 10 | 103 874 672 | NO |
| rs16943318 | cluster, freq, hapmap | G/A | CAC_C | RORA | 15 | 61 209 971 | NO |
| rs13358075 | hapmap | T/A | ACG_G | SPOCK1 | 5 | 136 347 100 | NO |
| rs58433430 | NA | C/T | A_GTG | KLHL14 | 18 | 30 265 315 | YES |
| rs2901215 | NA | T/G | ACG_G | TIAL1 | 10 | 121 356 578 | NO |
| rs56306258 | NA | A/T | _CGTG | ANKRD12 | 18 | 9 136 756 | NO |
| rs56033752 | NA | G/A | AC_TG | DLG2 | 11 | 83 898 942 | NO |
| rs34394782 | NA | C/A/T | CACG_ | CITED2 | 6 | 139 695 473 | NO |
| rs34476700 | NA | G/- | _CGTG | SENP3 | 17 | 7 463 409 | NO |
| rs56298217 | NA | G/A | GC_TG | CLK3 | 15 | 74 914 649 | NO |
The ‘_’ symbol indicates the position of the SNP within the potential HIF-binding site. Max_HBS indicates whether the SNP maps to the highest scoring HBS identified for each locus.
Note that only one of the possible alleles generates an RCGTG motif.
Figure 5.

The allelic variant C/A (rs17004038) abrogates MIF induction by hypoxia. HeLa cells transfected with a reporter plasmid containing MIF genomic region (−31 to +108) upstream a luciferase reporter gene. Where indicated the consensus HRE sequence (CACGT) was mutated to CTAGC (mutHRE) or to AACGT (SNP). The graph represents the corrected luciferase activity values of each construct in cells exposed to hypoxia over the luciferase activity obtained in normoxic cells. Data show the results for eight experiments and its mean value (vertical line). Statistically significant differences with control group (WT) are indicated by asterisks (***p < 0.001).
DISCUSSION
The identification of the complete set of genes directly regulated by HIF is essential to fully understand the array of cellular responses activated during adaptation to hypoxia. In this task, gene expression and TFBS data generated by high-throughput tools are fundamental. However, comparison between different studies (Figures 1A and 2A) reveals little overlap in the results, probably not only because of the particularities in the response to hypoxia in each particular system, but also because of the intrinsic noise associated to these techniques. Herein we describe a novel probabilistic strategy that integrates the rich information contained in gene expression profiling databases with classic bioinformatic approaches to predict TFBSs. The evaluation of this strategy, using published ChIP–chip data as a benchmark, indicates that it has a low error rate while retaining a high sensitivity. In agreement, our experimental validation revealed that five out of six of predicted targets were in fact true positives while 8/10 negatives were true negatives (Figures 3 and 4). Thus, the computational strategy described herein proved to be comparable in success rate to the experimental identification of HBSs by means of ChIP–chip, and it is hence an attractive alternative until these high-throughput techniques become more cost efficient.
In our strategy, the identification of relevant HBSs relies on the similitude of the potential HBS sequences to a PSSM that includes positions other than the core RCGTG. This PSSM was obtained by our analysis of a set of 46 sequences derived from well-characterized HREs (Supplementary Table S4). In contrast to our result, the analysis of genomic fragments bound by HIF failed to identify extended sequence preferences beyond the core RCGTG (28,29). Thus, it could be argued that the extended motif revealed by our analysis is consequence of the (relatively) reduced number of sequences in the alignment (46 sequences). However, using a PSSM based on this extended motif, we found that the HBSs identified by ChIP–chip had an associated score significantly higher than background sites (Figure 3B) and that, within a given locus, the functional HBS coincides with the highest scoring one (Figure 3C). These results strongly argue in favor of the PSSM-based score as a reliable parameter to discriminate functional HBSs and justify its inclusion in our computational strategy. The information content of the extra conserved positions is low as compared to that of the core HRE (Supplementary Table S4), suggesting that probably each individual position plays a minor role on HIF sequence preference. However, its combined effect could explain the preferential binding of HIF to these sequences. Further work is required to prove the relevance of these conserved positions outside the core RCGTG and, in the event of them being relevant, to determine whether they are part of the HIFα (or HIFβ) binding site, form the binding site of an unrelated transcription factor or just confer a favorable structure. Another premise in our strategy is that HREs are restricted to genomic sequences conserved during evolution. We imposed this restriction to our model knowing that not all cis-regulatory motifs are conserved (44). Nevertheless, this restriction was required to minimize the number of false positives while allowing a good sensitivity (∼80%). In fact, this high sensitivity suggests that most real HBSs do in fact lie within conserved regions. In agreement, we found that 79% (254 out of 320) of the genomic fragments reported to bind HIF (29) contained one or more PhastCons elements. Thus, evolutionary conservation constraints are useful in reaching an optimum trade-off between sensitivity and specificity. In addition, our results imply that most (80%) of the experimentally identified HBSs are associated with CNSs. A further potential limitation of our strategy is imposed by the meta-analysis of gene expression profiling experiments. In our meta-analysis, genes showing a tissue-specific regulation by hypoxia, such as erthyropoietin (EPO), fail to be identified as hypoxia regulated genes. In order to mitigate this effect, in our strategy, the contribution of the meta-analysis to the classification of a gene as an HIF target is weighted by the consistency of its regulation by hypoxia (P-value) across the panel of microarray experiments (see ‘Materials and Methods’ section for details). In fact, this correction led us to the identification of RCOR2 as a HIF target in spite of it being induced by hypoxia in a limited number of experiments. Our analysis correctly identified the HRE driving EPO expression, but this gene was not selected as an HIF target because its associated PT/PB value was 5.17, right below the threshold of 6.5. In fact, EPO ranked in position 360 out of 11 672 analyzed genes. The design of our strategy tries to minimize the false positives to give a highly reliable list of HIF-targets but, because of the restrictions imposed, several HIF targets are missed as is the case of EPO. Hence, the list of 217 HIF-targets reported herein is clearly an underestimation of the whole complement of genes regulated by HIF.
An unexpected conclusion from our results is the lack of HBS enrichment in hypoxia-downregulated genes (Table 1). In agreement with our statistical approach, a recent ChIP–chip study (28) also failed to find association between HIF binding and transcriptional downregulation. In fact, although a direct effect on gene downregulation has been documented for some genes, such as CAD (45), they are rare exceptions, being upregulation of targets the predominant effect upon HIF binding. Thus, it is tempting to speculate that, in contrast to gene induction, most of the transcriptional downregulation triggered by hypoxia is either HIF independent or mediated by a secondary factor downstream of HIF (indirect effect). The lack of genes consistently downregulated by hypoxia in gene expression data sets (Figures 3 and 4) supports that HIF does not play a direct role in gene downregulation. Interestingly, among the HIF targets identified in our study, there are several factors involved in transcriptional repression, including the novel HIF target RCOR2 described herein (Figure 4). Thus, it is plausible that HIF indirectly promotes the transcriptional repression of specific genes by controlling the expression of co-repressors. However, other mechanisms could be envisioned to explain an indirect effect of HIF on gene downregulation. For example, it has been recently described that hypoxia/HIF leads to the induction of microRNAs (46) that, in turn, could lead to downregulation of specific groups of genes. Thus, much work is required to understand the molecular mechanisms responsible for hypoxia-induced gene repression.
An important feature of our strategy is that it is not restricted to a particular HIF isoform. Most of the GEO data sets used for the meta-analysis (Supplementary Table S2) derive from experiments that used hypoxia or the EGLN inhibitor DMOG as stimuli and thus activated all HIFa subunits present in the cells. Only in two tables (GSE2020), a specific isoform was activated by overexpression. On the other hand, it is assumed that HIF1α and HIF2α bind to the same motif (RCGTG) and that their differential target preference stems from isoform-specific cooperation with other transcription factors (47,48). In fact, the binding of both isoforms to a common motif was recently confirmed by comparison of the genomic sequences immunoprecipitated with HIF1α and HIF2α (28). Thus, the approaches used in our strategy are not biased toward the preferential identification of isoform-specific targets. In fact, the list of candidates (Supplementary Table S6) includes genes reported as HIF1α [BNIP3, (48)] and HIF2α specific [CITED2, (47)].
The precise identification of HBSs did not only lead to the identification of direct HIF targets but also allowed us to predict polymorphisms that could affect gene regulation by hypoxia. In this work, we identified several SNPs mapping to predicted HBSs and demonstrated, in the case of MIF promoter, that specific allelic variants result in a severely impaired response to hypoxia. Thus, individuals presenting this variant probably fail to properly upregulate MIF in response to hypoxia. To our knowledge, these results constitute the first demonstration that the response to hypoxia could vary slightly between individuals of a population. It is difficult to predict the physiological consequences of the lack of hypoxic induction of MIF and further work is necessary to address this question. However, it is likely that the abrogation of hypoxic gene induction had dramatic consequences. In agreement, elimination of the HRE driving the hypoxic upregulation of VEGFA leads to motor neuron degeneration (49) and abnormal retinal neovascularization (50). Given the number of pathologies that course with hypoxia, our results point to a potential source of variability in the clinical course and/or response to treatments among different individuals. In addition, these results support the hypothesis that mutations in regulatory regions, rather than in coding sequences, are important to explain inter-individual variation. With the completion of ongoing sequencing projects aimed at the identification of novel SNPs, we foresee that the number of variants affecting HBSs will increase.
In conclusion, the data presented herein demonstrate that integration of gene expression profiling and in silico identification of TFBSs is a successful approach for the identification of direct target genes. In agreement, during the writing of our manuscript, a report was published (51) that employs a similar strategy to identify HIF targets. Interestingly, although both works identify a list of about 200 HIF targets, there is little overlap in the identity of the individual target genes (only 37 genes were coincident, see Supplementary Table S8), reflecting important differences in the approaches followed in each work. The application of our strategy led to the identification of a set of novel (potential) HIF targets and our experimental validation demonstrated the reliability of these predictions. Moreover, we have found that, at least one of the predicted targets, RCOR2, is an HIF target gene regulated by hypoxia. In addition, elsewhere we demonstrate that two additional novel targets, GYS1 and UGP2, are also regulated by hypoxia in an HIF-dependent manner (manuscript submitted for publication). Finally, we identified polymorphisms mapping to our predicted HBSs and demonstrated that specific alleles have a profound impact on the regulation of transcription by hypoxia. Altogether, these results expand our understanding of the adaptive responses to hypoxia and suggest, for the first time, that this response can vary among individuals.
SUPPLEMENTARY DATA
Supplementary Data are available at NAR Online.
FUNDING
Ministerio de Ciencia y Tecnología/Ministerio de Ciencia e Innovación (SAF2005-00180 and SAF2008-03147), Comunidad Autónoma de Madrid (S-SAL-0311_2006); and the METOXIA, project ref. HEALTH-F2-2009-222741, under the 7th Research Framework Programme of the European Union. Funding for open access charge: SAF2008-03147.
Conflict of interest statement. None declared.
Supplementary Material
ACKNOWLEDGEMENTS
We thank Gema Moreno (Department of Biochemistry. Universidad Autónoma de Madrid. Madrid, Spain) for critical reading of the manuscript and Benjamin A.T. Rodríguez (Human Cancer Genetics Camprehensive Cancer Center. The Ohio State University. Columbus, OH, USA) for his valuable suggestions regarding validation of ChIP by qPCR. We also thank Dr. Manuel O. Landazuri and the researchers in his team for their kind support and help in many aspects of this work.
REFERENCES
- 1.Wenger RH, Stiehl DP, Camenisch G. Integration of oxygen signaling at the consensus HRE. Sci. STKE. 2005;2005:re12. doi: 10.1126/stke.3062005re12. [DOI] [PubMed] [Google Scholar]
- 2.Semenza GL, Wang GL. A nuclear factor induced by hypoxia via de novo protein synthesis binds to the human erythropoietin gene enhancer at a site required for transcriptional activation. Mol. Cell. Biol. 1992;12:5447–5454. doi: 10.1128/mcb.12.12.5447. [DOI] [PMC free article] [PubMed] [Google Scholar]
- 3.Salceda S, Beck I, Caro J. Absolute requirement of aryl hydrocarbon receptor nuclear translocator protein for gene activation by hypoxia. Arch. Biochem. Biophys. 1996;334:389–394. doi: 10.1006/abbi.1996.0469. [DOI] [PubMed] [Google Scholar]
- 4.Salceda S, Caro J. Hypoxia-inducible factor 1alpha (HIF-1alpha) protein is rapidly degraded by the ubiquitin-proteasome system under normoxic conditions. Its stabilization by hypoxia depends on redox-induced changes. J. Biol. Chem. 1997;272:22642–22647. doi: 10.1074/jbc.272.36.22642. [DOI] [PubMed] [Google Scholar]
- 5.Jiang BH, Zheng JZ, Leung SW, Roe R, Semenza GL. Transactivation and inhibitory domains of hypoxia-inducible factor 1alpha. Modulation of transcriptional activity by oxygen tension. J. Biol. Chem. 1997;272:19253–19260. doi: 10.1074/jbc.272.31.19253. [DOI] [PubMed] [Google Scholar]
- 6.Ivan M, Kondo K, Yang H, Kim W, Valiando J, Ohh M, Salic A, Asara JM, Lane WS, Kaelin W.G., Jr HIFalpha targeted for VHL-mediated destruction by proline hydroxylation: implications for O2 sensing. Science. 2001;292:464–468. doi: 10.1126/science.1059817. [DOI] [PubMed] [Google Scholar]
- 7.Jaakkola P, Mole DR, Tian YM, Wilson MI, Gielbert J, Gaskell SJ, Kriegsheim A, Hebestreit HF, Mukherji M, Schofield CJ, et al. Targeting of HIF-alpha to the von Hippel–Lindau ubiquitylation complex by O2-regulated prolyl hydroxylation. Science. 2001;292:468–472. doi: 10.1126/science.1059796. [DOI] [PubMed] [Google Scholar]
- 8.Bruick RK, McKnight SL. A conserved family of prolyl-4-hydroxylases that modify HIF. Science. 2001;294:1337–1340. doi: 10.1126/science.1066373. [DOI] [PubMed] [Google Scholar]
- 9.Epstein AC, Gleadle JM, McNeill LA, Hewitson KS, O'R;ourke J, Mole DR, Mukherji M, Metzen E, Wilson MI, Dhanda A, et al. C. elegans EGL-9 and mammalian homologs define a family of dioxygenases that regulate HIF by prolyl hydroxylation. Cell. 2001;107:43–54. doi: 10.1016/s0092-8674(01)00507-4. [DOI] [PubMed] [Google Scholar]
- 10.Maxwell PH, Wiesener MS, Chang GW, Clifford SC, Vaux EC, Cockman ME, Wykoff CC, Pugh CW, Maher ER, Ratcliffe PJ. The tumour suppressor protein VHL targets hypoxia-inducible factors for oxygen-dependent proteolysis. Nature. 1999;399:271–275. doi: 10.1038/20459. [DOI] [PubMed] [Google Scholar]
- 11.Hewitson KS, McNeill LA, Riordan MV, Tian YM, Bullock AN, Welford RW, Elkins JM, Oldham NJ, Shoumo B, Gleadle JM, et al. Hypoxia-inducible factor (HIF) asparagine hydroxylase is identical to factor inhibiting HIF (FIH) and is related to the cupin structural family. J. Biol. Chem. 2002;277:26351–26355. doi: 10.1074/jbc.C200273200. [DOI] [PubMed] [Google Scholar]
- 12.Lando D, Peet DJ, Gorman JJ, Whelan DA, White MF, Bruick RK. FIH-1 is an asparaginyl hydroxylase enzyme that regulates the transcriptional activity of hypoxia-inducible factor. Genes Dev. 2002;16:1466–1471. doi: 10.1101/gad.991402. [DOI] [PMC free article] [PubMed] [Google Scholar]
- 13.Lando D, Peet DJ, Whelan DA, Gorman JJ, Whitelaw ML. Asparagine hydroxylation of the HIF transactivation domain a hypoxic switch. Science. 2002;295:858–861. doi: 10.1126/science.1068592. [DOI] [PubMed] [Google Scholar]
- 14.Hu CJ, Wang LY, Chodosh LA, Keith B, Simon MC. Differential roles of hypoxia-inducible factor 1α (HIF-1α) and HIF-2α in hypoxic gene regulation. Mol. Cell. Biol. 2003;23:9361–9374. doi: 10.1128/MCB.23.24.9361-9374.2003. [DOI] [PMC free article] [PubMed] [Google Scholar]
- 15.Raval RR, Lau KW, Tran M.GB, Sowter HM, Mandriota SJ, Li J.-L, Pugh CW, Maxwell PH, Harris AL, Ratcliffe PJ. Contrasting properties of hypoxia-inducible factor 1 (HIF-1) and HIF-2 in von Hippel–Lindau-associated renal cell carcinoma. Mol. Cell. Biol. 2005;25:5675–5686. doi: 10.1128/MCB.25.13.5675-5686.2005. [DOI] [PMC free article] [PubMed] [Google Scholar]
- 16.Papandreou I, Cairns RA, Fontana L, Lim AL, Denko NC. HIF-1 mediates adaptation to hypoxia by actively downregulating mitochondrial oxygen consumption. Cell Metab. 2006;3:187–197. doi: 10.1016/j.cmet.2006.01.012. [DOI] [PubMed] [Google Scholar]
- 17.Kim JW, Tchernyshyov I, Semenza GL, Dang CV. HIF-1-mediated expression of pyruvate dehydrogenase kinase: a metabolic switch required for cellular adaptation to hypoxia. Cell Metab. 2006;3:177–185. doi: 10.1016/j.cmet.2006.02.002. [DOI] [PubMed] [Google Scholar]
- 18.Bostrom P, Magnusson B, Svensson PA, Wiklund O, Boren J, Carlsson L.MS, Stahlman M, Olofsson S.-O, Hulten LM. Hypoxia converts human macrophages into triglyceride-loaded foam cells. Arterioscler. Thromb. Vasc. Biol. 2006;26:1871–1876. doi: 10.1161/01.ATV.0000229665.78997.0b. [DOI] [PubMed] [Google Scholar]
- 19.Elvidge GP, Glenny L, Appelhoff RJ, Ratcliffe PJ, Ragoussis J, Gleadle JM. Concordant regulation of gene expression by hypoxia and 2-oxoglutarate-dependent dioxygenase inhibition. J. Biol. Chem. 2006;281:15215–15226. doi: 10.1074/jbc.M511408200. [DOI] [PubMed] [Google Scholar]
- 20.Kasper LH, Boussouar F, Boyd K, Xu W, Biesen M, Rehg J, Baudino TA, Cleveland JL, Brindle PK. Two transactivation mechanisms cooperate for the bulk of HIF-1-responsive gene expression. EMBO J. 2005;24:3846–3858. doi: 10.1038/sj.emboj.7600846. [DOI] [PMC free article] [PubMed] [Google Scholar]
- 21.Allen JW, Khetani S, Johnson R, Bhatia S. In vitro liver tissue model established from transgenic mice: role of HIF-1alpha on hypoxic gene expression. Tissue Engg. 2006;12:3135–3147. doi: 10.1089/ten.2006.12.3135. [DOI] [PubMed] [Google Scholar]
- 22.Mense SM, Sengupta A, Zhou M, Lan C, Bentsman G, Volsky DJ, Zhang L. Gene expression profiling reveals the profound upregulation of hypoxia-responsive genes in primary human astrocytes. Physiol. Genomics. 2006;25:435–449. doi: 10.1152/physiolgenomics.00315.2005. [DOI] [PubMed] [Google Scholar]
- 23.Ray JB, Arab S, Deng Y, Liu P, Penn L, Courtman DW, Ward ME. Oxygen regulation of arterial smooth muscle cell proliferation and survival. Am. J. Physiol. Heart Circ. Physiol. 2008;294:H839–H852. doi: 10.1152/ajpheart.00587.2007. [DOI] [PubMed] [Google Scholar]
- 24.Wang V, Davis DA, Haque M, Huang LE, Yarchoan R. Differential gene up-regulation by hypoxia-inducible factor-1α and hypoxia-inducible factor-2α in HEK293T cells. Cancer Res. 2005;65:3299–3306. doi: 10.1158/0008-5472.CAN-04-4130. [DOI] [PubMed] [Google Scholar]
- 25.Guimbellot J, Erickson S, Mehta T, Wen H, Page G, Sorscher E, Hong J. Correlation of microRNA levels during hypoxia with predicted target mRNAs through genome-wide microarray analysis. BMC Med. Genomics. 2009;2:15. doi: 10.1186/1755-8794-2-15. [DOI] [PMC free article] [PubMed] [Google Scholar]
- 26.Irigoyen M, Ansó E, Martínez E, Garayoa M, Martínez-Irujo JJ, Rouzaut A. Hypoxia alters the adhesive properties of lymphatic endothelial cells. A transcriptional and functional study. Biochim. Biophys. Acta – Mol. Cell. Res. 2007;1773:880–890. doi: 10.1016/j.bbamcr.2007.03.001. [DOI] [PubMed] [Google Scholar]
- 27.Cahan P, Rovegno F, Mooney D, Newman JC, St. Laurent G., III, McCaffrey TA. Meta-analysis of microarray results: challenges, opportunities, and recommendations for standardization. Gene. 2007;401:12–18. doi: 10.1016/j.gene.2007.06.016. [DOI] [PMC free article] [PubMed] [Google Scholar]
- 28.Mole DR, Blancher C, Copley RR, Pollard PJ, Gleadle JM, Ragoussis J, Ratcliffe PJ. Genome-wide association of hypoxia-inducible factor (HIF)-1α and HIF-2α DNA binding with expression profiling of hypoxia-inducible transcripts. J. Biol. Chem. 2009;284:16767–16775. doi: 10.1074/jbc.M901790200. [DOI] [PMC free article] [PubMed] [Google Scholar]
- 29.Xia X, Lemieux ME, Li W, Carroll JS, Brown M, Liu XS, Kung AL. Integrative analysis of HIF binding and transactivation reveals its role in maintaining histone methylation homeostasis. Proc. Natl Acad. Sci. USA. 2009;106:4260–4265. doi: 10.1073/pnas.0810067106. [DOI] [PMC free article] [PubMed] [Google Scholar]
- 30.Elnitski L, Jin VX, Farnham PJ, Jones S.JM. Locating mammalian transcription factor binding sites: A survey of computational and experimental techniques. Genome Res. 2006;16:1455–1464. doi: 10.1101/gr.4140006. [DOI] [PubMed] [Google Scholar]
- 31.Pescador N, Cuevas Y, Naranjo S, Alcaide M, Villar D, Landázuri MO, del Peso L. Regulation of the egl nine homologue 3 (egln3/phd3) gene: Identification of a functional hypoxia-responsive element. Biochem. J. 2005;390:189–197. doi: 10.1042/BJ20042121. [DOI] [PMC free article] [PubMed] [Google Scholar]
- 32.Kimura H, Weisz A, Ogura T, Hitomi Y, Kurashima Y, Hashimoto K, D'A;cquisto F, Makuuchi M, Esumi H. Identification of hypoxia-inducible factor-1 (HIF-1) ancillary sequence and its function in vascular endothelial growth factor gene induction by hypoxia and nitric oxide. J. Biol. Chem. 2001;276:2292–2298. doi: 10.1074/jbc.M008398200. [DOI] [PubMed] [Google Scholar]
- 33.Gilligan P, Brenner S, Venkatesh B. Fugu and human sequence comparison identifies novel human genes and conserved non-coding sequences. Gene. 2002;294:35–44. doi: 10.1016/s0378-1119(02)00793-x. [DOI] [PubMed] [Google Scholar]
- 34.Nobrega MA, Pennacchio LA. Comparative genomic analysis as a tool for biological discovery. J. Physiol. 2004;554:31–39. doi: 10.1113/jphysiol.2003.050948. [DOI] [PMC free article] [PubMed] [Google Scholar]
- 35.Siepel A, Bejerano G, Pedersen JS, Hinrichs AS, Hou M, Rosenbloom K, Clawson H, Spieth J, Hillier LW, Richards S, et al. Evolutionarily conserved elements in vertebrate, insect, worm, and yeast genomes. Genome Res. 2005;15:1034–1050. doi: 10.1101/gr.3715005. [DOI] [PMC free article] [PubMed] [Google Scholar]
- 36.Bussemaker HJ, Li H, Siggia ED. Regulatory element detection using correlation with expression. Nat. Genet. 2001;27:167–174. doi: 10.1038/84792. [DOI] [PubMed] [Google Scholar]
- 37.Hoek KS, Schlegel NC, Eichhoff OM, Widmer DS, Praetorius C, Einarsson SO, Valgeirsdottir S, Bergsteinsdottir K, Schepsky A, Dummer R, et al. Novel MITF targets identified using a two-step DNA microarray strategy. Pigment Cell Melanoma Res. 2008;21:665–676. doi: 10.1111/j.1755-148X.2008.00505.x. [DOI] [PubMed] [Google Scholar]
- 38.Jeffery IB, Madden SF, McGettigan PA, Perriere G, Culhane AC, Higgins DG. Integrating transcription factor binding site information with gene expression datasets. Bioinformatics. 2007;23:298–305. doi: 10.1093/bioinformatics/btl597. [DOI] [PubMed] [Google Scholar]
- 39.Edgar R, Domrachev M, Lash AE. Gene expression omnibus: NCBI gene expression and hybridization array data repository. Nucleic Acids Res. 2002;30:207–210. doi: 10.1093/nar/30.1.207. [DOI] [PMC free article] [PubMed] [Google Scholar]
- 40.Kent WJ, Sugnet CW, Furey TS, Roskin KM, Pringle TH, Zahler AM, Haussler AD. The human genome browser at UCSC. Genome Res. 2002;12:996–1006. doi: 10.1101/gr.229102. [DOI] [PMC free article] [PubMed] [Google Scholar]
- 41.Karolchik D, Hinrichs AS, Furey TS, Roskin KM, Sugnet CW, Haussler D, Kent WJ. The UCSC table browser data retrieval tool. Nucleic Acids Res. 2004;32:D493–D496. doi: 10.1093/nar/gkh103. [DOI] [PMC free article] [PubMed] [Google Scholar]
- 42.Wood SM, Gleadle JM, Pugh CW, Hankinson O, Ratcliffe PJ. The role of the aryl hydrocarbon receptor nuclear translocator (ARNT) in hypoxic induction of gene expression. Studies in ARNT-deficient cells. J. Biol. Chem. 1996;271:15117–15123. doi: 10.1074/jbc.271.25.15117. [DOI] [PubMed] [Google Scholar]
- 43.Baugh JA, Gantier M, Li L, Byrne A, Buckley A, Donnelly SC. Dual regulation of macrophage migration inhibitory factor (MIF) expression in hypoxia by CREB and HIF-1. Biochem. Biophys. Res. Comm. 2006;347:895–903. doi: 10.1016/j.bbrc.2006.06.148. [DOI] [PubMed] [Google Scholar]
- 44.Alonso E, Pernaute B, Crespo M, Gómez-Skarmeta JL, Manzanares M. Understanding the regulatory genome. Int. J. Dev. Biol. 2008;53:1367–1378. doi: 10.1387/ijdb.072428ma. [DOI] [PubMed] [Google Scholar]
- 45.Chen KF, Lai YY, Sun HS, Tsai SJ. Transcriptional repression of human cad gene by hypoxia inducible factor-1α. Nucleic Acids Res. 2005;33:5190–5198. doi: 10.1093/nar/gki839. [DOI] [PMC free article] [PubMed] [Google Scholar]
- 46.Kulshreshtha R, Ferracin M, Wojcik S, Garzon R, Alder H, Agosto-Perez F, Davuluri R, Liu C, Croce C, Negrini M. A microRNA signature of hypoxia. Mol. Cell. Biol. 2007;27:1859–1867. doi: 10.1128/MCB.01395-06. [DOI] [PMC free article] [PubMed] [Google Scholar]
- 47.Hu CJ, Iyer S, Sataur A, Covello KL, Chodosh LA, Simon MC. Differential regulation of the transcriptional activities of hypoxia-inducible factor 1 alpha (HIF-1α) and HIF-2α in stem cells. Mol. Cell. Biol. 2006;26:3514–3526. doi: 10.1128/MCB.26.9.3514-3526.2006. [DOI] [PMC free article] [PubMed] [Google Scholar]
- 48.Aprelikova O, Wood M, Tackett S, Chandramouli G.VR, Barrett JC. Role of ETS transcription factors in the hypoxia-inducible factor-2 target gene selection. Cancer Res. 2006;66:5641–5647. doi: 10.1158/0008-5472.CAN-05-3345. [DOI] [PubMed] [Google Scholar]
- 49.Oosthuyse B, Moons L, Storkebaum E, Beck H, Nuyens D, Brusselmans K, Dorpe JV, Hellings P, Gorselink M, Heymans S, et al. Deletion of the hypoxia-response element in the vascular endothelial growth factor promoter causes motor neuron degeneration. Nat. Genet. 2001;28:131–138. doi: 10.1038/88842. [DOI] [PubMed] [Google Scholar]
- 50.Vinores SA, Xiao W.-H, Aslam S, Shen J, Oshima Y, Nambu H, Liu H, Carmeliet P, Campochiaro PA. Implication of the hypoxia response element of the VEGF promoter in mouse models of retinal and choroidal neovascularization, but not retinal vascular development. J. Cell. Physiol. 2006;206:749–758. doi: 10.1002/jcp.20525. [DOI] [PubMed] [Google Scholar]
- 51.Benita Y, Kikuchi H, Smith AD, Zhang MQ, Chung DC, Xavier RJ. An integrative genomics approach identifies hypoxia inducible factor-1 (HIF-1)-target genes that form the core response to hypoxia. Nucleic Acids Res. 2009;37:4587–4602. doi: 10.1093/nar/gkp425. [DOI] [PMC free article] [PubMed] [Google Scholar]
Associated Data
This section collects any data citations, data availability statements, or supplementary materials included in this article.