


Abstract
New DNA sequencing technologies have achieved breakthroughs in throughput, at the expense of higher error rates. The primary way of interpreting biological sequences is via alignment, but standard alignment methods assume the sequences are accurate. Here, we describe how to incorporate the per-base error probabilities reported by sequencers into alignment. Unlike existing tools for DNA read mapping, our method models both sequencer errors and real sequence differences. This approach consistently improves mapping accuracy, even when the rate of real sequence difference is only 0.2%. Furthermore, when mapping Drosophila melanogaster reads to the Drosophila simulans genome, it increased the amount of correctly mapped reads from 49 to 66%. This approach enables more effective use of DNA reads from organisms that lack reference genomes, are extinct or are highly polymorphic.
INTRODUCTION
The major approach to interpreting biological sequences is to align them to other sequences. As a result, alignment algorithms such as BLAST are important and ubiquitous. Standard alignment algorithms assume that the sequences are accurate, and ignore per-base quality data that is typically available from DNA sequencing instruments. Recent sequencing technologies, however, have achieved breakthroughs in throughput, at the expense of higher error rates. It has thus become more important to consider the quality data during the initial analysis step, which is nearly always some form of alignment.
Surprisingly, we can find no previous method that systematically incorporates quality data into sequence alignment. Several methods for mapping DNA reads to genomes do use quality data, but they lack scoring matrices that model differences other than sequencing errors [e.g. (1,2)]. Instead, a limited form of alignment is employed, which assumes that the sequences are (almost) identical apart from sequencing errors. A publication by Malde describes alignment using quality data, but this also replaces the scoring matrix with quality-derived scores instead of combining the two (3). The work of Na et al. (4) does combine a standard score matrix with quality scores, but has some serious drawbacks that we describe later in this article.
In this article, we provide an effective solution for the task of xeno-mapping, the mapping of reads onto a reference genome which may differ from the genomic source of the reads. Xeno-mapping is important for several reasons. First, the vast majority of species currently lack reference genome sequences. If we obtained DNA reads from (say) zebra, the best way to interpret them would probably involve mapping them to the horse genome. It might take a decade before all 5000 mammal species are sequenced, and longer if ever for the millions of insect species, only a fraction of which have even been described. Second, sequencing extinct organisms is fascinating, but assembling genomes from their meager DNA is at best hard and at worst impossible, and so modern genomes are typically used as ‘scaffolds’, e.g. mammoth reads versus the elephant genome (5). Finally, many wild organisms are highly polymorphic–extreme examples being Ciona intestinalis (1.2%) and Ciona savignyi (4.6%) (6) – so that real sequence differences are frequent even when aligning sequences from the same organism.
Traditional sequence alignment
Traditional sequence alignment methods (e.g. BLAST) allow for sequence differences by using a scoring scheme: matching bases in an alignment get positive scores, and mismatches and gaps receive negative scores. More generally, they use a scoring matrix S, where Sxy (x,y∈{a,c,g,t}) specifies the score for aligning the nucleotides x and y. The scoring matrix can be interpreted as a log likelihood ratio:
| (1) |
where T is an arbitrary scaling factor, and Rxy is the likelihood ratio:
| (2) |
Here, P(xy|A) is the probability of observing x aligned to y in a probabilistic model of aligned sequences, and P(x) and P(y) are the probabilities of observing x and y individually.
The probabilities P(xy|A) are called the ‘target frequencies’ of the scoring matrix (7). A scoring matrix is optimal for distinguishing related sequences from chance similarities when its target frequencies equal those in an accurate alignment of related sequences (7,8). For example, to construct an optimal scoring matrix for 90% identical sequences of uniform composition, we would set the match and mismatch frequencies to:
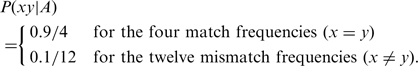 |
(3) |
The 12 kinds of mutations are, however, not equally frequent: usually, the four types of transitions (A ⇔ G and T ⇔ C) occur more often than the eight types of transversions. If 60% of substitutions are transitions, we would use these mismatch frequencies:
| (4) |
In short, we know how to construct optimal scoring matrices for sequences with a known degree of divergence.
Sequencer error probabilities
DNA sequencing instruments can report a probability that each sequenced base is erroneous. These probabilities are usually reported in a log-transformed form, called ‘phred score’ or ‘quality score’:
| (5) |
Here, ε is the error probability. So, for example, an error probability of 0.01 is reported as a quality score of 20. The following variant is sometimes used instead:
| (6) |
Sometimes, four quality scores are reported per base, which reflect the probability that the base is a, c, g or t. There are a few common file formats for sequence qualities, including FASTQ (one quality score per base) and PRB (four quality scores per base).
Median and mean error probabilities for two sets of Illumina reads are shown in Figure 1. They exhibit a typical pattern where error rates increase toward the end of the read. In the first data set, the median error probability is <1% for all but the last six bases. The mean error rates tend to be much higher than the medians, due to the skewed distributions (i.e. most of the error probabilities are low, but a few are much higher). In the second data set, there was clearly a problem with the 32nd base, since the average reported error probability is exactly 1: this phenomenon is not unusual (1). These two data sets are not especially atypical (Supplementary Figure S1).
Figure 1.

Estimated error rates for two DNA short-read data sets. (A) Error rates for a set of 36-bp reads from the Solexa 1G Genome Analyzer (the first 100 000 reads of SRR001981). (B) Error rates for a set of 51-bp reads from the Illumina Genome Analyzer II (the first 100 000 reads of SRR016157). For both panels, the error rates were obtained from FASTQ files in the NCBI Short Read Archive.
In this study, we describe a way to merge sequence quality data into the traditional sequence alignment framework. This means that we model both sequencer errors and real sequence differences at the same time. We apply the method to simulated DNA reads (where we know the correct mapping locations), and show that it improves mapping accuracy compared with modeling either only sequencer errors or only real sequence differences. Finally, we show a dramatic improvement in mapping of real Drosophila melanogaster reads to the Drosophila simulans genome (which simulates mapping mammoth reads to the elephant genome or the like).
MATERIALS AND METHODS
In this section, we show how quality scores can be used for aligning sequences and mapping DNA reads to genomes. While these techniques are described in sufficient detail to be incorporated into any alignment software, we also give a brief summary of a publicly available system called LAST that includes these features.
Incorporating sequence quality data into alignment
We wish to extend the standard scoring matrix derivation to take sequencing error probabilities into account. In our scenario, one sequence (the read) has per-base error probabilities, and the other sequence (the genome) does not. We assume that the sequencing instrument estimates P(y|d), the probability that a base is y (where y∈{a,c,g,t}) based on some observed data d (e.g. image intensities). Following the likelihood-ratio principle, we define a generalization of standard substitution scores:
| (7) |
This formula can be rearranged by observing,
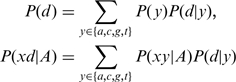 |
(8) |
and by Bayes formula,
| (9) |
to obtain:
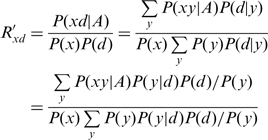 |
(10) |
Simplifying, we obtain:
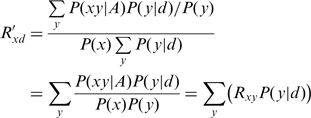 |
(11) |
Finally, we define scores by the usual log transformation:
| (12) |
This scoring scheme can be implemented efficiently by converting each length n read to a 4 × n position-specific scoring matrix, which holds the scores for aligning a, c, g and t to each position in the read. Details of how our software performs these calculations are provided in the Supplementary Data.
Comparison with expected score method
Na et al. (4) proposed a method for combining quality scores with traditional scoring matrices. Although presented in a more general form, which allows for mismatch and indel sequencing errors in both sequences, overall their method is similar to ours. They consider aligning two sequences, each one represented as a 4 × n matrix, holding the probability of each base at each position. Unfortunately, their method suffers from two problems. First, the computation is not well justified theoretically, and second, the method breaks down when very similar sequences are aligned.
In their notation, the score of an alignment column is defined as:
| (13) |
where γ, δ and μ represent the traditional score matrix score for matches, mismatches and gaps, respectively, and Pm, Pn and Pg represent the probability, given the sequencer data, of each of those three cases. We submit that the following equation, which corresponds to our R′xd [equation (11)], would be more justified:
| (14) |
This follows from that fact that (i) Pm, Pn and Pg are the probabilities of disjoint events (indeed Pm + Pn + Pg≡1), (ii) as pointed out in equation (1), eγ/T, eδ/T and eμ/T are proportional to the probabilities of matches, mismatches and gaps in the ‘real’ sequences and (iii) the reasonable assumption that sequencer error is independent of real sequence differences.
This is not just a theoretical point, but makes a significant difference in practice. Consider the case of aligning two sequences expected to be identical except for sequencing error. In this case, the appropriate value for δ and μ would be T × ln(0) =−∞, and thus by equation (13), any column involving a non-zero sequencer error probability would be assigned the same score of −∞. On the other hand, equation (14), or equivalently  , would assign a score proportional to Pm, which is the probability assigned by the sequencer that the two bases match each other.
Mapping probabilities
In traditional sequence alignment, we simply report alignments with significantly high scores, and it does not matter if one query sequence has more than one high-scoring alignment. For read mapping, on the other hand, we suppose that each read comes from just one place in the genome. Since genomes contain many duplications and simple repeats, though, it is common for one read to have multiple high-scoring alignments.
This problem can be addressed by calculating mapping probabilities (1,2). Suppose that one read has high-scoring alignments at several genome locations. The alignment score at location i is denoted as Si. The mapping probability is:
| (15) |
This formula can be derived from probabilistic alignment models (Supplementary Data). Thus, if a read has a much higher alignment score at one location than any other, we can be confident that it comes from there. If it has nearly equal alignment scores at many locations, we cannot confidently map it.
This calculation assumes that the read certainly comes from one of the locations found by the alignment procedure. This is a very dubious assumption in practice, for several reasons:
The read might not come from the genome at all (i.e. it might be a contaminant).
The read might come from part of the genome that is not present in the reference sequence. (Many reference sequences are incomplete.)
The alignment algorithm might miss some high-scoring alignments. Because of the large size of the data sets, heuristic algorithms are normally used which may miss some alignments.
Therefore, these mapping probabilities should not be trusted absolutely. Nevertheless, they prove useful.
Implementation
We expect that many existing read-mapping tools could be modified to incorporate the scoring scheme defined above. To demonstrate our method, we have incorporated it into our own large-scale alignment tool, LAST.
Since we intend to describe LAST in detail in a separate publication, we only give a minimal description here. LAST follows the same three steps as BLAST (9). It finds seeds (exact matches), extends gapless alignments from the seeds and finally extends gapped alignments. We incorporated the new scoring scheme into the last two phases, since the seed-finding phase does not use scores at all.
The main innovation of LAST is its use of adaptive seeds whose length adapts to the repetitiveness of the sequence. This makes it much faster for genomic data. Specifically, it finds exact matches of any length that occur no more than (say) 10 times in the genome. These can be found efficiently using enhanced suffix arrays (10). LAST can also use spaced seeds (11). Finally, LAST can use seeds that are both spaced and adaptive: in fact, this is the default algorithm in this study (Supplementary Data). LAST is freely available at: http://last.cbrc.jp/.
Alignment parameter settings
In this study, the gapless and gapped score thresholds of LAST (-d and -e) were set to 120, and the gapless max-drop parameter (-y) was set to 99 999 (effectively infinite). Gapped alignment was used only when aligning reads to the D. simulans genome. When mapping 51-bp reads, a score threshold of 150 was used instead of 120. When modeling sequencer errors only, the mismatch cost (-q) was set to 1 million (effectively infinite). To clarify: despite the infinite mismatch cost, mismatches were tolerated due to the modeling of sequencer errors.
Finding all alignments with up to two mismatches
For part of our analysis, we wished to avoid using adaptive seeds, and instead guarantee to find all alignments with up to two mismatches (and score ≥120). We did this with LAST using spaced seeds. We first found all matches of length 26 between each read and the genome, requiring only 18 out of the 26 bases to match. The positions required to match are indicated by ‘1’s in the following pattern: 11111011000111110110001111. Any length 36 read with up to two mismatches (and no gaps) is guaranteed to have a match using this pattern. Moreover, this pattern is optimal for this problem, in that no pattern with >18 ‘1’s provides this guarantee. The LAST documentation includes a table of optimal spaced seeds for various read lengths and mismatch limits, obtained using algorithms from others (12,13). Finally, as usual, we extended alignments from every seed match, and reported those with alignment score  120.
120.
Mapping DNA reads to Drosophila genomes
We obtained the genome sequences of D. melanogaster (dm3 excluding chrUextra) and D. simulans (droSim1) from the UCSC genome database. We only tested reads that could be confidently mapped to the D. melanogaster genome (53 748 reads in default mapping mode; 51 898 reads in two-mismatch guarantee mode). We considered a read confidently mapped if it has alignment score  150 and mapping probability
  0.99. (Alignments with score
  120 were used to calculate the mapping probabilities.) To cross-reference the mappings, we used the genome alignment file dm3.droSim1.all.chain from UCSC (14).
RESULTS
Our results show the effectiveness of combining quality scores with sequence alignment by applying LAST within two experiment settings: the first with synthetic data and the second with real data based on cross-species mapping.
Test with simulated DNA reads
In our first experiment, we employ simulated reads since we are able to know exactly where they should map to. We began by sampling 100 000 random 36-bp fragments from human chromosome 1 (hg19, both strands). To simulate real sequence differences, we made random substitutions at a low level (0.2, 0.5, 2 or 5%). These substitutions consisted of 60% transitions and 40% transversions: a realistic proportion (6). To keep this initial test simple, we did not introduce any insertions or deletions. Finally, we assigned 100 000 real quality score strings (those summarized in Figure 1A) to the simulated reads, and randomly mutated each base according to the corresponding error probability.
We then aligned the reads to chromosome 1, and checked whether or not they mapped back to their original locations. The ‘real’ sequence differences were modeled by using suitable alignment score parameters for each level of divergence (Table 1). We obtained alignments with score  120 (equivalent to 20 error-free matching bases), then calculated mapping probabilities, and kept alignments with mapping probability
  0.99. Figure 2 shows the relationship between the number of correctly and incorrectly mapped reads, as the score threshold is varied between 216 (the maximum possible) and 120. As the score threshold approaches 120, falsely mapped reads increase dramatically: this is because the mapping probabilities become less reliable since they fail to account for alignments with scores
  119. In all cases, however, mapping accuracy improves (i.e. we obtain more correctly mapped reads for a given number of incorrectly mapped ones) when we model both sequencer errors and ‘real’ substitutions. If we model only sequencer errors, there is the potential to do worse than traditional alignment, where only substitutions are modeled.
Table 1.
Alignment score parameters for DNA with various substitution rates
| Substitution Rate (%) | Match score | Mismatch costa | Ta | Transition costb | Transversion | Tb |
|---|---|---|---|---|---|---|
| costb | ||||||
| 0 | 6 | ∞ | 4.32809 | ∞ | ∞ | 4.32809 |
| 0.2 | 6 | 26 | 4.33391 | 23 | 28 | 4.33441 |
| 0.5 | 6 | 22 | 4.34295 | 19 | 24 | 4.34425 |
| 1 | 6 | 19 | 4.35838 | 16 | 21 | 4.36106 |
| 2 | 6 | 16 | 4.39082 | 13 | 18 | 4.39646 |
| 5 | 6 | 12 | 4.50212 | 10 | 14 | 4.49125 |
| 10 | 6 | 9 | 4.73387 | 7 | 12 | 4.65864 |
| 15 | 6 | 8 | 4.88281 | 6c | 9c | 4.92305c |
aApplies when there is no transition/transversion bias (i.e. one in three substitutions are transitions).
bFor the case where 60% of substitutions are transitions.
cFor the case where 45% of substitutions are transitions.
Figure 2.

Mapping accuracy for 100 000 simulated 36-bp reads. The reads differ from the genome by a certain rate of ‘real’ substitutions (0.2, 0.5, 1 or 2%) plus sequencer errors. Each line shows the relationship between the number of correctly and incorrectly mapped reads as the alignment score cutoff is varied. Circles indicate a score cutoff of 150. Dotted lines show the accuracy when we model the substitutions but not the sequencer errors. Dashed lines show the accuracy when we model the sequencer errors but not the substitutions. Solid lines show the accuracy when we model both.
To check whether these conclusions hold for a different read length and quality score distribution, we repeated the test using simulated reads of size 51 (Figure 3). The main conclusion still applies: mapping accuracy is improved by modeling both sequencer errors and substitutions. This time, however, traditional alignment performs worse relative to modeling sequencer errors only. The reason, presumably, is that the error probabilities used here are higher on average than those used for the 36-bp reads (Figure 1): so it becomes more important to model sequencing errors.
Figure 3.

Mapping accuracy for 100 000 simulated 51-bp reads. See legend of Figure 2. Circles indicate a score cutoff of 180.
It might be argued that, since we used a particular mapping algorithm (with adaptive seeds), the conclusions may not apply to other mapping techniques. To address this concern, we repeated the experiment using LAST in a different mode, where it guarantees to find all alignments with up to two mismatches (and score  120). (Many alignments with more than two mismatches are also returned in this mode.) This resembles several popular mapping methods. The main conclusions are unchanged: mapping accuracy is improved by modeling both sequencer errors and substitutions, and in some cases modeling only sequencer errors is less accurate than traditional alignment (Figure 4).
Figure 4.

Mapping accuracy for 100 000 simulated 36-bp reads using a mapping procedure that guarantees to find all matches with up to two substitutions. This is identical to Figure 2, except that a different mapping algorithm was used here.
The mapping algorithm does make a difference, though (Figures 2 and 4). The default adaptive seed method gives only a few hundred false mappings for 60 000–70 000 correctly mapped reads, but the two-mismatch guarantee method gives yet fewer false mappings – only a handful – for 50 000–60 000 correctly mapped reads. On the other hand, it ultimately gets fewer correctly mapped reads. In our simulation, all of the reads actually come from the reference sequence, and the two-mismatch guarantee method will never miss the correct alignment if the read has at most two differences: this is why there are so few false mappings. Real data is less clean than this, and we would expect more false mappings (see below).
In a further test, we mapped the simulated reads using a simple match/mismatch scoring matrix while also modeling the sequencer errors. This means that we accurately modeled the level of divergence, but ignored the difference between transitions and transversions. This approach works almost, but not quite as well as when we model transitions and transversions (Supplementary Figure S2). This is worth knowing, because match/mismatch scoring schemes are simpler to implement and slightly faster than general score matrices (Supplementary Data).
Test by xeno-mapping real DNA reads
We wished to test our approach with real (not simulated) reads, but we need a case where we can at least estimate whether the mappings are correct. To accomplish this, we mapped reads of D. melanogaster DNA (those in Figure 1A) to the genome of D. simulans, a closely related organism. This cross-species mapping exemplifies xeno-mapping and mapping to highly polymorphic genomes.
To estimate correctness, we first mapped the reads to the D. melanogaster genome, which can presumably be done much more accurately, and then used the D. melanogaster / D. simulans genome alignment from the UCSC database to cross-reference the mappings. The genome alignment no doubt has errors, but it should be much more accurate than short-read mapping because it can leverage the context provided by long sequences.
In order to construct a suitable alignment scoring scheme, we examined the divergence between D. melanogaster and D. simulans. In the UCSC ‘net’ alignments, 15% of aligned bases are mismatches, and 45% of these are transitions. There is about one gap per 101 aligned bases, and the average gap size is 6.67. These statistics suffice to construct a scoring scheme (Table 1, Supplementary Data).
In this test, mapping accuracy was greatly improved by modeling real sequence differences in addition to sequencing errors (Figure 4). At a score cutoff of 150, we get 35 667 correctly mapped reads (66% of the 53 748 that could be mapped confidently to D. melanogaster) and 197 falsely mapped reads. If we model sequencing errors only, we get 26 569 correctly mapped reads (49%) and 194 falsely mapped reads.
If we model real sequence differences without gaps, the accuracy is only slightly lower than when we do allow gaps (Figure 5). So it is not important to model gaps for this data set. Gaps are likely to be more important for longer reads, since a longer read is more likely to cross a gap, and it is also more likely that the alignment can be extended across the gap.
Figure 5.

Estimated mapping accuracy for 100 000 real 36-bp reads from D. melanogaster, mapped to the D. simulans genome. Circles indicate a score cutoff of 150. The dotted line shows the mapping accuracy when we model the sequencer errors but not the real differences. The solid line shows the accuracy when we model both. The dashed red line shows the accuracy when we model both but forbid insertions and deletions. Correctness was estimated by mapping the reads to the D. melanogaster genome (modeling sequencer errors only), and using the UCSC D. melanogaster / D. simulans pairwise genome alignment to cross-reference the mappings.
For completeness, we also tried mapping the reads to either or both Drosophila genomes in two-mismatch guarantee mode (Supplementary Figure S3). All combinations support the main conclusion that mapping accuracy increases significantly when we model real sequence differences in addition to sequencing errors. When we map to D. simulans in two-mismatch guarantee mode, the slight benefit of modeling gaps disappears, perhaps because this mode requires finding large (26 bp) gapless matches (see ‘Materials and Methods’ section). As expected, two-mismatch guarantee mode does not reduce false mappings as dramatically as it did for simulated data. Finally, two-mismatch guarantee mode gives fewer correctly mapped reads (as it did for simulated reads), perhaps because it requires seeds with 18 matches (see ‘Materials and Methods’ section), making it less sensitive in general than adaptive seeds.
DISCUSSION
We have described a general approach for incorporating sequence quality data into alignment. The method is straightforward, and it can be implemented with little additional computational cost over standard alignment (Supplementary Table S1). This approach noticeably improves DNA read mapping for substitution rates  0.2%, corresponding to a moderate rate of polymorphism. It also greatly increased the amount of correctly mapped reads when mapping D. melanogaster DNA to the D. simulans genome, and is likely to be beneficial for xeno-mapping in general. As explained above, xeno-mapping is especially crucial for extinct genomes.
On the other hand, the human polymorphism rate is only ∼0.1%, and many agricultural and laboratory organisms are even less polymorphic. So it is less important to allow for real sequence differences in these cases, although there is no harm in doing so. If we are specifically looking for polymorphisms, however, it seems wise to model them during read mapping even for these organisms. Another consideration is that sequence quality data is not necessarily accurate: high quality scores can be over-optimistic (15). Although explicit recalibration of quality scores is sometimes possible (16) our method can also roughly compensate for over-optimistic quality scores by assuming a real substitution rate of, say, 1%.
To make best use of our mapping approach we need good estimates of the real substitution and indel rates, as we calculated for D. simulans versus D. melanogaster. Such estimates can be obtained by first aligning the sequences with naive parameters and then measuring the substitution and indel rates in these alignments (and perhaps iterating).
One possibly useful generalization would be to incorporate quality data from both sequences being aligned, not just one. This could be relevant for mapping reads to low-quality draft genomes, for example. It is straightforward to generalize equations (7–12) to this case, but the resulting calculations seem to require much more time and/or memory. Some previous methods do consider quality scores in both sequences, but they do not use general score matrices (1,3,4).
It is worth remarking that we can map DNA reads efficiently using a general purpose, BLAST-like aligner (Supplementary Table S1). While the current trend is specialized algorithms for mapping short sequences allowing few differences, we have shown that this is not essential.
There is one very different approach to using sequence quality data that we should mention. If we obtain DNA reads from a small number of abundant sequences, then sequencing errors will manifest as low-frequency reads that are very similar to high-frequency reads. So we can infer the true frequency of each read, and correct sequencing errors, by comparing the reads to each other (16,17). This approach seems most relevant for certain transcriptome and metagenome data sets, where a few sequences are highly abundant. It is not straightforward to combine this approach with use of quality data during read mapping, because we must avoid double counting the quality data.
A major limitation of modern sequencing systems is their short read lengths. One cause of this is that the error rate increases along the read until it becomes too high (Figure 1). By incorporating quality data into alignment, we can more sensibly use lower quality sequences than standard alignment techniques can. This should allow read lengths to increase ‘for free’ without improving the sequencing hardware, because the alignment software can profitably use lower quality bases.
SUPPLEMENTARY DATA
Supplementary Data are available at NAR Online.
FUNDING
INTEC Systems Institute, Inc. (to R.W.); Japanese Ministry of Education, Culture, Sport, Science and Technology [Grant-in-Aid for Scientific Research (B) to P.H.]. Funding for open access charge: AIST internal budget.
Conflict of interest statement. None declared.
Supplementary Material
ACKNOWLEDGEMENTS
We are grateful to Michiaki Hamada for incorporating the calculation of T into LAST and commenting on the manuscript. M.C.F. thanks Shashank Bujimal and Peter Waddell for motivation to work on this project.
REFERENCES
- 1.Cokus SJ, Feng S, Zhang X, Chen Z, Merriman B, Haudenschild CD, Pradhan S, Nelson SF, Pellegrini M, Jacobsen SE, et al. Shotgun bisulphite sequencing of the Arabidopsis genome reveals DNA methylation patterning. Nature. 2008;452:215–219. doi: 10.1038/nature06745. [DOI] [PMC free article] [PubMed] [Google Scholar]
- 2.Li H, Ruan J, Durbin R. Mapping short DNA sequencing reads and calling variants using mapping quality scores. Genome Res. 2008;18:1851–1858. doi: 10.1101/gr.078212.108. [DOI] [PMC free article] [PubMed] [Google Scholar]
- 3.Malde K. The effect of sequence quality on sequence alignment. Bioinformatics. 2008;24:897–900. doi: 10.1093/bioinformatics/btn052. [DOI] [PubMed] [Google Scholar]
- 4.Na JC, Roh K, Apostolico A, Park K. Alignment of biological sequences with quality scores. Int. J. Bioinformatics Res. Appl. 2009;5:97–113. doi: 10.1504/IJBRA.2009.022466. [DOI] [PubMed] [Google Scholar]
- 5.Millar CD, Huynen L, Subramanian S, Mohandesan E, Lambert DM. New developments in ancient genomics. Trends Ecol. Evol. 2008;23:386–393. doi: 10.1016/j.tree.2008.04.002. [DOI] [PubMed] [Google Scholar]
- 6.Kim JH, Waterman MS, Li LM. Diploid genome reconstruction of Ciona intestinalis and comparative analysis with Ciona savignyi. Genome Res. 2007;17:1101–1110. doi: 10.1101/gr.5894107. [DOI] [PMC free article] [PubMed] [Google Scholar]
- 7.Karlin S, Altschul SF. Methods for assessing the statistical significance of molecular sequence features by using general scoring schemes. Proc. Natl Acad. Sci. USA. 1990;87:2264–2268. doi: 10.1073/pnas.87.6.2264. [DOI] [PMC free article] [PubMed] [Google Scholar]
- 8.States DJ, Gish W, Altschul SF. Improved sensitivity of nucleic acid database searches using application-specific scoring matrices. Methods Companion to Methods Enzymol. 1991;3:66–70. [Google Scholar]
- 9.Altschul SF, Madden TL, Schäffer AA, Zhang J, Zhang Z, Miller W, Lipman DJ. Gapped BLAST and PSI-BLAST: a new generation of protein database search programs. Nucleic Acids Res. 1997;25:3389–3402. doi: 10.1093/nar/25.17.3389. [DOI] [PMC free article] [PubMed] [Google Scholar]
- 10.Abouelhoda MI, Kurtz S, Ohlebusch E. Replacing suffix trees with enhanced suffix arrays. J. Discrete Algorithms. 2004;2:53–86. [Google Scholar]
- 11.Ma B, Tromp J, Li M. PatternHunter: faster and more sensitive homology search. Bioinformatics. 2002;18:440–445. doi: 10.1093/bioinformatics/18.3.440. [DOI] [PubMed] [Google Scholar]
- 12.Burkhardt S, Kärkkäinen J. Better filtering with gapped q-grams. Fundam. Inform. 2003;XXIII:1001–1018. [Google Scholar]
- 13.Kucherov G, Noé L, Roytberg M. Multiseed lossless filtration. IEEE/ACM Trans. Comput. Biol. Bioinformatics. 2005;2 doi: 10.1109/TCBB.2005.12. [DOI] [PubMed] [Google Scholar]
- 14.Kent WJ, Baertsch R, Hinrichs A, Miller W, Haussler D. Evolution's; cauldron: duplication, deletion, and rearrangement in the mouse and human genomes. Proc. Natl Acad. Sci. USA. 2003;100:11484–11489. doi: 10.1073/pnas.1932072100. [DOI] [PMC free article] [PubMed] [Google Scholar]
- 15.Dohm JC, Lottaz C, Borodina T, Himmelbauer H. Substantial biases in ultra-short read data sets from high-throughput DNA sequencing. Nucleic Acids Res. 2008;36:e105. doi: 10.1093/nar/gkn425. [DOI] [PMC free article] [PubMed] [Google Scholar]
- 16.Qu W, Hashimoto S.-I, Morishita S. Efficient frequency-based de novo short-read clustering for error trimming in next-generation sequencing. Genome Res. 2009;19:1309–1315. doi: 10.1101/gr.089151.108. [DOI] [PMC free article] [PubMed] [Google Scholar]
- 17.Wijaya E, Frith MC, Suzuki Y, Horton P. Recount: Expectation maximization based error correction tool for next generation sequencing data. Genome Inform. 2009;23:189–201. [PubMed] [Google Scholar]
Associated Data
This section collects any data citations, data availability statements, or supplementary materials included in this article.