Abstract
Pancreatic islets are highly vascularized and arranged so that regions containing β-cells are distinct from those containing other cell types. Although islet blood flow has been studied extensively, little is known about the dynamics of islet blood flow during hypoglycemia or hyperglycemia. To investigate changes in islet blood flow as a function of blood glucose level, we clamped blood glucose sequentially at hyperglycemic (∼300 mg/dl or 16.8 mM) and hypoglycemic (∼50 mg/dl or 2.8 mM) levels while simultaneously imaging intraislet blood flow in mouse models that express green fluorescent protein in the β-cells or yellow fluorescent protein in the α-cells. Using line scanning confocal microscopy, in vivo blood flow was assayed after intravenous injection of fluorescent dextran or sulforhodamine-labeled red blood cells. Regardless of the sequence of hypoglycemia and hyperglycemia, islet blood flow is faster during hyperglycemia, and apparent blood volume is greater during hyperglycemia than during hypoglycemia. However, there is no change in the order of perfusion of different islet endocrine cell types in hypoglycemia compared with hyperglycemia, with the islet core of β-cells usually perfused first. In contrast to the results in islets, there was no significant difference in flow rate in the exocrine pancreas during hyperglycemia compared with hypoglycemia. These results indicate that glucose differentially regulates blood flow in the pancreatic islet vasculature independently of blood flow in the rest of the pancreas.
the islets of langerhans are highly vascularized miniorgans within the pancreas. Researchers have long observed an intimate relationship between pancreatic islets and their distinguished vasculature (7). The vessels within the islet are more numerous and more tortuous than vessels in the surrounding exocrine tissue (2, 4). These characteristics of islet vasculature are likely related to the islets' function of sensing and responding to changes in blood glucose. The morphology of the pancreatic islet is notable in that regions containing β-cells are distinct from those containing α- and δ-cells (19). However, investigations of the physiological importance of this distinct cellular organization of the islet and its vasculature are limited (19, 26, 27).
Prior studies have shown two predominant islet blood flow patterns in murine islets (6, 18, 23, 25). The most common pattern is where the blood initially perfuses the islet core and then the islet perimeter (3, 18, 22, 25). In the second pattern, blood flows from one side of the islet to the other side, and thus perfuses core and perimeter areas simultaneously (16, 18). The majority of these experimental data, however, have been gathered irrespective of blood glucose levels. Thus, little is known about islet blood flow during different metabolic states or changes in blood glucose levels. Since it has been suggested that glucose and/or insulin levels affect blood flow (10), we examined the islet blood flow dynamics as a function of blood glucose level.
To examine the effects of changes in blood glucose on islet blood flow direction, speed, and intensity, we clamped blood glucose in anesthetized animals at both hyperglycemic and hypoglycemic levels. Using fast line-scanning confocal microscopy, we measured blood flow velocity within the islet and in the surrounding exocrine tissue by use of fluorescent dextran injected into the blood plasma and fluorescently labeled red blood cells. The data show that islet blood flow is faster and islet blood volume greater during hyperglycemia compared with hypoglycemia. In contrast, blood flow dynamics through the exocrine pancreas were not different during hyperglycemia or hypoglycemia, which suggests that glucose-induced differences in blood flow are specific to the islet vasculature.
METHODS
Animals.
All experiments involving mice were approved by and performed according to the guidelines of the Vanderbilt University Institutional Animal Care and Use Committee. The mouse insulin I promoter-green fluorescent protein (MIP-GFP) transgenic mice were courtesy of Hara and Bell from the University of Chicago (9, 20). The Glucagon-Cre mice were obtained from MMRRC at the University of North Carolina, Chapel Hill (20) and bred with Rosa26-YFP reporter mice (24) to produce Glucagon-Cre-YFP mice. Clamp studies from 16 mice were used for data analysis.
Surgical catheterization and pancreas exteriorization for imaging studies.
Catheters were placed in the left common carotid artery and right jugular vein as previously described (1, 17). The free ends of catheters were tunneled under the skin to the back of the neck, where they were exteriorized and sealed with stainless steel plugs. Lines were flushed the next day with 10–50 μl of saline containing 200 U/ml heparin and 5 mg/ml ampicillin (Sigma, St Louis, MO). Animals were individually housed after surgery, and body weight was recorded. The success rate of the surgery and catheterization procedures was ∼70%. Mice were allowed to recover from surgery for 1 day.
For imaging, mice were anesthetized using an intraperitoneal injection of xylazine-ketamine (20/80 mg/kg). An incision was made in the abdominal cavity so that the splenic end of the pancreas could be visualized, as described previously (18). A coverslip wrapped with gauze bedding was placed gently on the abdominal cavity, and the pancreas-spleen connection was fixed over the bedding. The mouse was then placed prone on the stage so that the pancreas was in contact with the coverslip. Mice were covered with a heating pad to maintain body temperature throughout the imaging period.
Hyperglycemic and hypoglycemia clamps.
After the mice were allowed to recover overnight, a baseline sample was drawn for measurement of glucose. In 5 of the 13 studies, we performed the hypoglycemic clamp experiments first, and in 8 of the studies we perfomed hyperglycemic clamp experiments before the hypoglycemic clamp experiments. For the protocol in which hypoglycemia was achieved before hyperglycemia, 10 mU/kg insulin was infused at a constant rate of 1.5 μl/min until hypoglycemia (50 mg/dl) was achieved (8, 21). After the measurements had been taken, glucose was infused with insulin as necessary to attain hyperglycemia on the basis of feedback from frequent arterial glucose measurements (∼5 μl; HemoCue, Mission Viejo, CA). For the protocol in which hyperglycemia was achieved before hypoglycemia, 10 mU/kg insulin plus glucose was infused at a constant rate of 1.5 μl/min until hyperglycemia (300 mg/dl) was achieved. After images had been collected, insulin alone was infused until hypoglycemia was reached. The fluid removed for blood glucose testing did not exceed 60 μl/h. Fluid replacement was a minimum of 90 μl/h plus an additional .06–2.59 μl/min infused with the glucose clamp to achieve hyperglycemia. In addition, the abdominal cavity and pancreas were hydrated with saline throughout the experiment to minimize any fluid loss in the open abdominal cavity. For the purpose of this paper, hyperglycemia refers to a blood glucose of ∼300 mg/dl, and hypoglycemia refers to a blood glucose ∼50 mg/dl.
In vivo fluorescence imaging.
To label blood cells by osmotic loading, ∼100 μl of red blood cells was added to a water-sulforhodamine mixture [225 μl H20 and 25 μl sulforhodamine (25 mg/ml, Molecular Probes)] and then incubated for 10 min at room temperature. Following the addition of 30 μl of 10× PBS to restore normal osmolarity, the mixture was centrifuged at 4,000 rpm for 1 min. The supernatant was decanted, and labeled red blood cells were washed with heparin-saline four times and then suspended in saline for injection.
An LSM5 LIVE (Carl Zeiss) laser scanning confocal microscope was used for imaging with a ×20/0.8 NA planapochromat objective lens. The slit aperture was adjusted for each channel to allow for optimal signal-to-noise ratio and spatial resolution in each sample. After the pancreas was exposed on the microscope stage, islets were found by eye using epifluorescence to identify the green fluorescent protein (GFP)- or yellow fluorescent protein (YFP)-positive regions. Islets were identified close to the surface for the best resolution possible. Once the GFP-labeled β-cells were found, they were imaged using the 488-nm diode laser line for excitation and a band-pass 495–525 emission filter for detection. Once the imaging parameters were established, imaging commenced at ∼70 fps, and then 50 μl of rhodamine dextran- or sulforhodamine-labeled red blood cells was injected into the ocular plexus. After the filling of the pancreas or islet vasculature, images were saved and analyzed.
Two million MW rhodamine dextran tracer (Molecular Probes) or Cy5.5 dextran tracer (Nanocs) was then injected via the ocular plexus to visualize blood flow. Sulforhodamine-labeled red blood cells were injected for assessing red blood cell speeds during hyperglycemia and hypoglycemia. Rhodamine dextran- or sulforhodamine-labeled red blood cells were imaged using the 532-nm diode laser line for excitation and a band-pass 560–675 emission filter for detection. Cy5.5 dextran was imaged using a 635-nm diode laser for excitation and a long-pass 650 emission filter for detection. To assess islet blood flow directionality, Z-stacks were made in increments of 4 μm over an average of 25–40 μm in depth. Images were acquired at a rate of ∼70 fps; e.g., 10 images at different focal planes could be repeated 7 times/second (18). The microscope focal plane nearest to the bottom of the islet or the side closest to the coverglass was called the “top” boundary, and the “bottom” boundary was selected from the focal plane in the image farthest from the coverglass. For imaging red blood cell speeds in hyperglycemia and hypoglycemia, single-plane image series were taken at 108 fps.
Blood flow analysis.
To investigate the dynamics of flowing red blood cells in the islet and the exocrine tissue during hypoglycemia and hyperglycemia, we timed and tracked individual red blood cells in time series captured using the LSM 5 live during both hyperglycemia and hypoglycemia. Because of the high spatial and temporal resolution of the images taken in vivo, we were able to measure individual cell trajectories extracted from 1,000–4,000 image frames. All images were analyzed using region-of-interest (ROI) analysis using the microscope software (Zeiss LSM5 v. 4.0). The figures presented in this paper have been contrast-enhanced to aid visualization; however, all data analysis was conducted on the original raw images before any contrast enhancement.
To determine the blood vessel filling rates during hyperglycemia and hypoglycemia, we determined the arrival time of a bolus at each of the selected ROIs by finding the first time point that met both of the following criteria: 1) the ROI had an intensity value greater than the arithmetic mean, and 2) intensities at each following time point had to have increased monotonically until the first local maxima was reached. We used the intensity mean as a trigger value to minimize the effects of background noise. Comparison included filling rates, intensity differences, and regional differences during hyperglycemia vs. hypoglycemia.
Statistics.
Student's t-tests were used to analyze comparison of ROIs during hyperglycemia and hypoglycemia. P values < 0.05 were considered significant.
RESULTS
Identifying and imaging islets and islet blood flow in vivo.
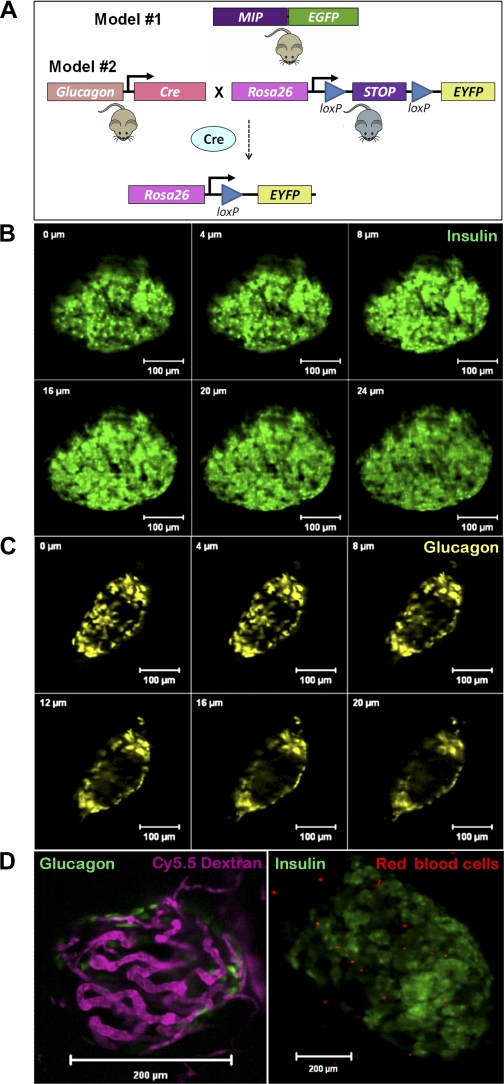
For the experiments described herein, we first needed to locate and focus on a single islet within the intact pancreas. To assess the exact location of α-cells and β-cells in relation to their neighboring vessels, we utilized two mouse models expressing fluorescent proteins specifically in either α-cells or β-cells (Fig. 1A). MIP-GFP mice expressed the enhanced GFP in pancreatic β-cells (9) and the Glucagon-Cre-YFP mice expressed YFP in α-cells (20). In both models, islets could be located and imaged efficiently within 200 μm of the pancreatic surface, and, in every pancreas examined, at least one islet meeting this criterion could be found. Three-dimensionally resolved optical slices (Z-stacks) were acquired through much of an islet in either MIP-GFP mice (Fig. 1B) or Glucagon-Cre-YFP mice (Fig. 1C). The resulting Z-stacks were used to define a partial islet volume for the subsequent imaging of blood flow.
Fig. 1.
Models used for identifying and imaging islets in vivo. Islets within a living mouse with β-cells expressing enhanced green fluorescent protein (eGFP) (MIP-GFP; A, top) or α-cells expressing enhanced yellow fluorescent protein (eYFP) (Gluc-Cre-YFP; A, bottom) are used to locate these cells in relation to their neighboring vessels. Three-dimensionally resolved optical slices (Z-stacks) through the islet of a MIP-GFP mouse (B) and a Gluc-Cre-YFP mouse (C) show the peripheral location of glucagon cells in the mouse islet. D: single-plane confocal microscope image of an islet with GFP-labeled β-cells (green) and islet vasculature visualized with a Cy5.5 dextran tracer (purple). E: single-plane image of an islet in a mouse injected with sulforhodamine-labeled red blood cells.
We measured blood flow using two different approaches, by tracing a bolus injection of fluorescent dextran into the bloodstream (Fig. 1D) and by imaging fluorescently labeled red blood cells (Fig. 1E). The first method images blood plasma flow and has been previously described (18). For the imaging of red blood cells (15), we injected sulforhodamine-labeled red blood cells and collected a series of images. Because of the high spatial and temporal resolution of these images, we could measure individual cell trajectories extracted from a series of 1,000–4,000 images. The use of sulforhodamine-labeled red blood cells is particularly well suited for visualization of flow velocity (Supplemental Movies 1 and 2; supplemental materials are found in the online version of this paper at the Journal website).
Glucose clamp experiments.
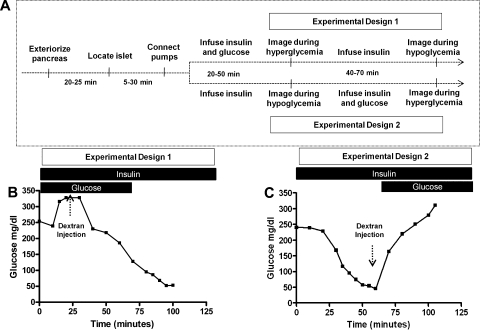
To investigate whether or not blood flow dynamics are dependent on blood glucose concentration, hyperglycemic or hypoglycemic conditions were induced in mice undergoing imaging experiments. The experimental protocol timeline (Fig. 2A) shows that each experimental run required between 90 and 180 min. For experimental design 1 (Fig. 2A, top), the mouse was given a constant amount of insulin and varying amounts of glucose until a hyperglycemic state was attained (∼300 mg/dl). A series of images was taken to capture the injection of rhodamine or Cy5.5 dextran as it filled the islet during this hyperglycemic state. The glucose infusion was terminated while insulin infusion was kept constant to achieve hypoglycemia. A second injection of fluorescent dextran was imaged during the hypoglycemic state (a representative example of blood glucose levels during this procedure is shown in Fig. 2B). For experimental design 2 (Fig. 2A, bottom), the mouse was infused with a constant level of insulin until hypoglycemia was achieved, at which time images were taken as fluorescent dextran filled the islet during hypoglycemia. Following this, the mouse was infused with both insulin and glucose to achieve hyperglycemia where another set of images was taken to capture the filling of the islet after injection with a differently labeled dextran (a representative example of blood glucose levels during this procedure is shown in Fig. 2C).
Fig. 2.
Glucose clamp experiments. A: time line for experimental design shows that, after the mouse was anesthetized, the pancreas exteriorized, and islet located, blood glucose levels were measured every 10 min. For experimental design 1, where experiments were conducted first under hyperglycemia and then hypoglycemia, the mouse was given insulin continuously and varying amounts of glucose until the hyperglycemic state was achieved. A series of images was then taken to capture injection of fluorescent dextran as it filled the islet in the hyperglycemic state. The glucose infusion was terminated while insulin infusion was kept constant to achieve hypoglycemia (∼50 mg/dl). A second injection of fluorescent dextran was imaged in the hypoglycemic state. For experimental design 2, where experiments were conducted first under hypoglycemia and then hyperglycemia, the mouse was infused continuously with insulin until hypoglycemia was achieved, at which time images were taken. Following this, the mouse was infused with both insulin and glucose to achieve hyperglycemia, when another set of images was taken to capture the filling of the islet after a fluorescent dextran injection. B: glucose levels during a representative design 1 experiment where hyperglycemia was achieved before hypoglycemia. C: glucose levels during a representative design 2 experiment where hypoglycemia was achieved before hyperglycemia.
Islet blood flow intensity during hyperglycemia and hypoglycemia.
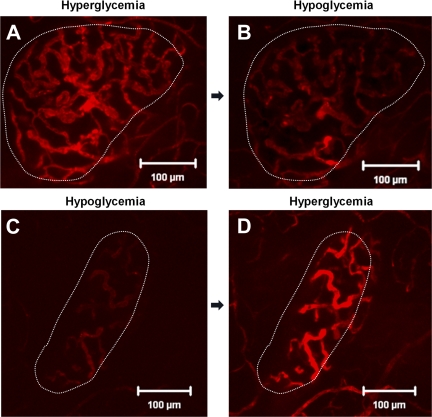
Neither MIP-GFP nor Glucagon-Cre-YFP islets show a difference in the direction of islet blood flow during hyperglycemia and hypoglycemia. However, total islet blood flow intensity increased in the hyperglycemic state (Fig. 3A). After a bolus injection of fluorescent dextran, the amount of fluorescence measured in the islet vasculature was greater during hyperglycemia than during hypoglycemia (Fig. 3, A and 3B). To assess whether this change in flow intensity could be attributed to the duration of insulin administration, the order of the hypoglycemic and hyperglycemic clamp experiments was varied (i.e., in some studies we performed the hyperglycemic clamp before the hypoglycemic clamp and in others we clamped hypoglycemia before hyperglycemia). Islet blood flow intensity was decreased during hypoglycemia regardless of whether hypoglycemia or hyperglycemia was clamped first (Fig. 3, C and D), indicating that blood flow intensity changes were likely due to changes in blood glucose rather than to the order of hyperglycemia/hypoglycemia or duration of insulin administration.
Fig. 3.
Islet blood flow during hyperglycemia and hypoglycemia. Images taken at peak fluorescence intensity in the same islet under experimental design 1 during hyperglycemia (A) and hypoglycemia (B) or under experimental design 2 during hypoglycemia (C) and hyperglycemia (D).
Blood flow velocity during hyperglycemia and hypoglycemia.
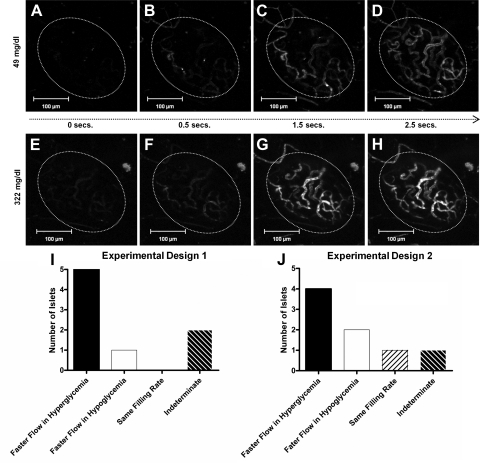
We next addressed the question whether the increase in fluorescent signal was due to blood flow velocity, vascular volume, or both. After a bolus injection of fluorescent dextran, the islet blood vessel filling rate was slower during hypoglycemia (Fig. 4, A–D) than it was during hyperglycemia (Fig. 4, E–H). With the two experimental protocols shown in Fig. 2A, the measured filling rate of the islet was shorter (i.e., faster) during hyperglycemia than it was during hypoglycemia regardless of the order that these glucose levels were introduced (Fig. 4, I and J). Following experimental design 1 (hypoglycemia before hyperglycemia), four mice demonstrated faster flow in hyperglycemia, two mice showed islet blood flow filling rates that were faster in hypoglycemia than in hyperglycemia, one mouse showed the same filling rate during both treatments, and the results from one mouse were indeterminate (Fig. 4I). Following experimental design 2 (hyperglycemia before hypoglycemia), five mice demonstrated faster filling rates in hyperglycemia than in hypoglycemia, one mouse demonstrated faster filling fate in hypoglycemia, and the results from one mouse were indeterminate (Fig. 4J).
Fig. 4.
Vessel filling rate during hyperglycemia and hypoglycemia. A series of images taken from 0–2.5 s captures filling rate of islet vasculature during hypoglycemia (A–D) or hyperglycemia (E–H). By 1.5 s, the islet has completely filled under hyperglycemic conditions, whereas the islet is only partially filled at the same time point during hypoglycemia. No. of islets that exhibit faster filling rates in hyperglycemia vs. hypoglycemia using experimental design 2 (I) or experimental design 1 (J).
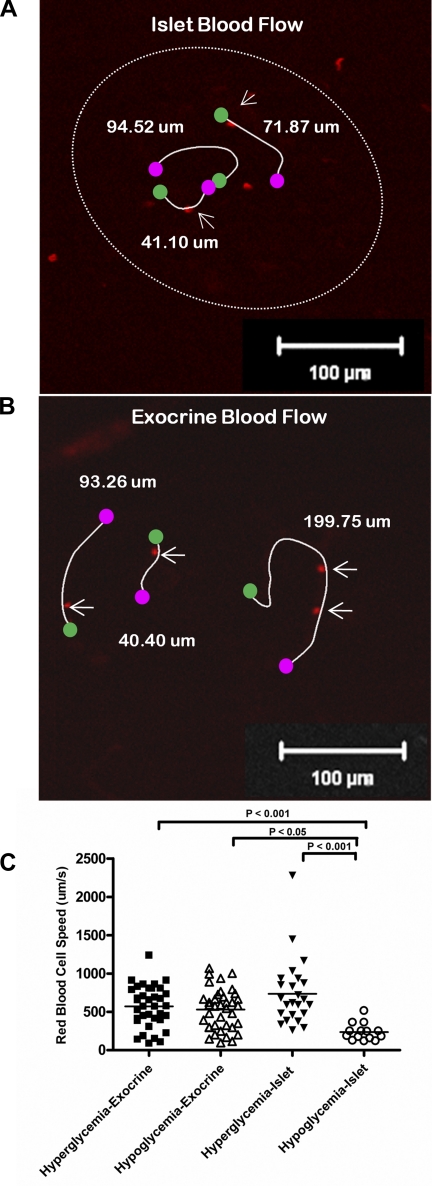
These data suggest that blood flow velocity contributes to the increased fluorescence intensity measured during hyperglycemia. To measure directly whether islet blood flow is faster in hyperglycemia than hypoglycemia, labeled red blood cells were injected into the ocular plexus of the mouse at the beginning of the clamp experiments. Single-plane time series were collected at 108 fps, and the red blood cells were tracked over time to assess their speed during both hyperglycemia and hypoglycemia (Fig. 5A and Supplemental Movie 1). The same procedure could be performed to measure blood flow in the surrounding exocrine tissue during hyperglycemia and hypoglycemia (Fig. 5B and Supplemental Movie 2). Despite a wide variation of blood cell velocities in different vessels, islet blood flow was significantly faster during hyperglycemia than during hypoglycemia (Fig. 5C). In contrast, exocrine blood flow was not significantly different during hyperglycemia compared with hypoglycemia (Fig. 5C).
Fig. 5.
Blood flow in endocrine vs. exocrine tissue. Labeled red blood cells tracked in an islet (A) and in surrounding exocrine tissue of the pancreas (B) during hyperglycemia and hypoglycemia. C: red blood cell flow velocities in exocrine tissue are not significantly different during hyperglycemia vs. hypoglycemia, but islet blood flow is significantly slower during hypoglycemia.
Regional differences in flow during hyperglycemia and hypoglycemia.
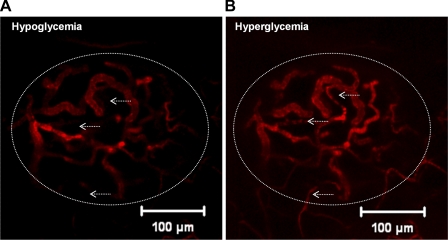
Beyond the global changes in blood flow velocity seen between hypoglycemia and hyperglycemia, we sometimes observed regional differences in flow within islets between the different glycemic conditions (noted in ∼30% of the islets examined). A small number of vessels exhibited very little or no flow under hypoglycemic conditions (Fig. 6A, arrows) despite the fact that they were fully active during hyperglycemia (Fig. 6B, arrows). In at least one islet, this effect was observed throughout a significant portion of the islet, where there was a marked reduction in flow during the hypoglycemic state (Supplemental Fig. 1, A–C).
Fig. 6.
Regional differences in flow in hyperglycemia and hypoglycemia. Islet vasculature filled with fluorescent dextran at peak fluorescence intensity during hypoglycemia (A) or hyperglycemia (B). Arrows point to vessels that do not appear to be active in hypoglycemia (A) but are filled with fluorescent tracer under hyperglycemic conditions (B).
DISCUSSION
We used glucose clamp methods in combination with genetically modified reporter mice and high-speed laser scanning microscopy to capture the dynamics of pancreatic islet and exocrine tissue blood flow under different metabolic conditions. Our aim was to investigate the effects of blood glucose concentration on islet blood flow. Many previous studies examining islet blood flow used techniques that were limited to static assessments in post mortem experimental periods. In this report, we applied a novel real-time technique that provided dynamic information that could not be acquired by other methods.
Throughout these experiments, we consistently measured significant differences in blood flow magnitude and velocity as a function of blood glucose level. Islet blood flow velocity and intensity were greater during hyperglycemia than during hypoglycemia, suggesting that hyperglycemia may lead to increased islet perfusion. By comparing the filling rate following injection of a bolus of fluorescent dextran during hyperglycemia and hypoglycemia, we found that the vast majority of islets have slower filling rates in hypoglycemia (Fig. 4). This regulation of islet blood flow as a function of glucose level was also confirmed using a complementary technique to track labeled red blood cells flowing though the islet using line scanning confocal microscopy. Our experimental approach provides direct visualization and quantification of blood cell velocities during hyperglycemia and hypoglycemia. This permits a direct comparison with flow speeds in the surrounding exocrine tissue during the same imaging session and under the same blood glucose levels. Our findings show that islet blood flow velocity is higher during hyperglycemia and lower during hypoglycemia but that flow rates in the surrounding exocrine tissue are not glucose concentration dependent (Fig. 5). We did note a range of blood cell velocities in different vessels in both the islet and exocrine tissue, and this may reflect different vessel sizes as well as differences in venous vs. arterial flow.
These findings suggest that the rise in blood glucose in the postprandial state increases islet blood flow and that this may contribute to more rapid insulin delivery into the circulation. The pancreatic islet is a highly vascularized tissue, and a reduction in islet vessel density has been shown to impair glucose tolerance (5). These findings suggest that a rapid rise in insulin secretion, in response to a glucose challenge, is aided by both increased vessel density in the islet and the glucose-induced increase in islet blood flow. The islet specificity of glucose-induced increase in blood flow is highlighted by the lack of a similar response in exocrine blood flow in the same pancreatic study (Fig. 5). Whether the glucose-induced increase in islet blood flow may be detrimental under pathological states like chronic hyperglycemia is not known (11). Likewise, the reduced islet blood flow during hypoglycemia suggests that a glucose level below the physiological range slows insulin delivery into the systemic circulation, as would be desired during hypoglycemia. By comparing islet blood flow intensity to the glucose-secreting α-cells during hypoglycemia, we tested the hypothesis that hypoglycemia would promote increased α-cell perifusion. However, we did not find evidence to support cell type-dependent regional blood flow within the islet.
One surprise was the observations of localized differences in flow velocities within a single islet. Such differences were observed in ∼30% of the islets and generally involved one or more vessels that exhibited near-zero flow rates during hypoglycemia (Fig. 6). In one islet, there was a large region of low flow during hypoglycemia, whereas the entire islet was perfused uniformly during hyperglycemia (Supplemental Fig. 1). These regional differences were not observed in every islet but were sufficiently common to suggest that this effect may be a normal component of islet blood flow regulation during hypoglycemia. Such a regulation would provide an additional mechanism for reducing insulin delivery during hypoglycemia. To investigate whether these changes were due to the administration of insulin for long periods of time, we altered the order in which we measured flow during hyperglycemia and hypoglycemia. There were no significant differences due to the order of hyperglycemia/hypoglycemia or the duration of insulin administration (Fig. 3). Considering that insulin was infused at a constant rate, the data suggest that glucose, not insulin, plays the major role in directly regulating islet blood flow intensity and speed.
The use of anesthesia and the effect it has on blood glucose homeostasis may be a limitation of these studies. We used continuous infusion of glucose and insulin during the experiments to minimize any potential artifact, but we cannot rule out the possibility that our results were affected by the anesthesia. Possible effects of blood pressure variation during anesthesia cannot be excluded from our results. However, we do not expect this to be a major effect in this work, based on previous results in rats treated with pharmacological interventions affecting the rennin-angiotension system, which showed that systemic blood pressure decreases did not affect islet blood flow (10). The data presented in this paper are also limited to islets close to the surface in the tail region of the pancreas. Although we do not have any evidence that this sampling of islets results in a bias, it is possible that investigation of such a small percentage of the islets in the mouse is not representative of the whole pancreas. Still, our results are consistent with previously published data (12, 13). Also, the islets varied in size: large, medium, and small. Multiple islets in the same mouse were studied in only a few cases where the islets were visible, and in each case the blood flow dynamics were found to be similar.
The mechanisms regulating islet blood flow are not completely understood. Studies from Jansson et al. (13) suggest that islet blood flow is regulated via a complex interaction among vasodilators and vasoconstrictors, gastrointestinal peptides, and the autonomic nervous system. Our results did not investigate a role for the nervous system in this regulation, but we and others (14) have not found evidence of smooth muscle actin within the islet. The areas of reduced islet flow during hypoglycemia appear to be entire vessels, thus providing some support for a role of sphincter or valve regulation in islet blood flow. Future studies will be required to elucidate the mechanism(s) by which glucose regulates islet blood flow.
GRANTS
This study was supported by NIH Grants DK-53434, DK-69603, DK-68764, RR-22620, DK-66636, DK-63439, DK-07563, and DK-07563; a Merit Review Award from the Veterans Affairs Research Service; a grant from the Juvenile Diabetes Research Foundation International; the Vanderbilt Mouse Metabolic Phenotyping Center; a mentored fellowship award from the American Diabetes Association; and the Vanderbilt Diabetes Research and Training Center (NIDDK Grant DK-20593). Imaging and data analysis were performed in part through the use of the Vanderbilt University Medical Center Cell Imaging Shared Resource, supported by NIH Grants CA-68485, DK-20593, DK-58404, HD-15052, DK-59637, and EY-08126.
DISCLOSURES
No conflicts of interest are reported by the author(s).
Supplementary Material
ACKNOWLEDGMENTS
We thank Tasneem Ansari, Emily Born, and Carlo Malabanan from the Vanderbilt Mouse Metabolic Phenotyping Center for assistance with the mouse catheterizations (supported by National Institute of Diabetes and Digestive and Kidney Diseases Grant DK-59637).
REFERENCES
- 1.Ayala JE, Bracy DP, McGuinness OP, Wasserman DH. Considerations in the design of hyperinsulinemic-euglycemic clamps in the conscious mouse. Diabetes 55: 390–397, 2006. [DOI] [PubMed] [Google Scholar]
- 2.Bonner-Weir S. The microvasculature of the pancreas, with emphasis on that of the islets of Langerhans. In: The Pancreas: Biology, Pathobiology, and Disease. New York: Raven, 1993 [Google Scholar]
- 3.Bonner-Weir S, Orci L. New perspectives on the microvasculature of the islets of Langerhans in the rat. Diabetes 31: 883–889, 1982 [DOI] [PubMed] [Google Scholar]
- 4.Brissova M, Blaha M, Spear C, Nicholson W, Radhika A, Shiota M, Charron MJ, Wright CV, Powers AC. Reduced PDX-1 expression impairs islet response to insulin resistance and worsens glucose homeostasis. Am J Physiol Endocrinol Metab 288: E707–E714, 2005 [DOI] [PubMed] [Google Scholar]
- 5.Brissova M, Shostak A, Shiota M, Wiebe PO, Poffenberger G, Kantz J, Chen Z, Carr C, Jerome WG, Chen J, Baldwin HS, Nicholson W, Bader DM, Jetton T, Gannon M, Powers AC. Pancreatic islet production of vascular endothelial growth factor-a is essential for islet vascularization, revascularization, and function. Diabetes 55: 2974–2985, 2006 [DOI] [PubMed] [Google Scholar]
- 6.Brunicardi FC, Stagner J, Bonner-Weir S, Wayland H, Kleinman R, Livingston E, Guth P, Menger M, McCuskey R, Intaglietta M, Charles A, Ashley S, Cheung A, Ipp E, Gilman S, Howard T, Passaro E., Jr Microcirculation of the islets of Langerhans. Long Beach Veterans Administration Regional Medical Education Center Symposium. Diabetes 45: 385–392, 1996 [DOI] [PubMed] [Google Scholar]
- 7.Dewitt LM. Morphology and physiology of areas of Langerhans in some vertebrates. J Exper Med 8: 193–239, 1906 [DOI] [PMC free article] [PubMed] [Google Scholar]
- 8.Fueger PT, Heikkinen S, Bracy DP, Malabanan CM, Pencek RR, Laakso M, Wasserman DH. Hexokinase II partial knockout impairs exercise-stimulated glucose uptake in oxidative muscles of mice. Am J Physiol Endocrinol Metab 285: E958–E963, 2003 [DOI] [PubMed] [Google Scholar]
- 9.Hara M, Wang X, Kawamura T, Bindokas VP, Dizon RF, Alcoser SY, Magnuson MA, Bell GI. Transgenic mice with green fluorescent protein-labeled pancreatic β-cells. Am J Physiol Endocrinol Metab 284: E177–E183, 2003 [DOI] [PubMed] [Google Scholar]
- 10.Iwase M, Uchizono Y, Nohara S, Sasaki N, Sonoki K, Iida M. Angiotensin II type 1 receptor antagonists prevent glucose-induced increases in islet blood flow in rats. Scand J Clin Lab Invest 69: 145–150, 2009 [DOI] [PubMed] [Google Scholar]
- 11.Iwase M, Uchizono Y, Tashiro K, Goto D, Iida M. Islet hyperperfusion during prediabetic phase in OLETF rats, a model of type 2 diabetes. Diabetes 51: 2530–2535, 2002 [DOI] [PubMed] [Google Scholar]
- 12.Jansson L. Glucose stimulation of pancreatic islet blood flow by redistribution of the blood flow within the whole pancreatic gland. Pancreas 3: 409–412, 1988 [DOI] [PubMed] [Google Scholar]
- 13.Jansson L, Andersson A, Bodin B, Kallskog O. Pancreatic islet blood flow during euglycaemic, hyperinsulinaemic clamp in anaesthetized rats. Acta Physiol (Oxf) 189: 319–324, 2007 [DOI] [PubMed] [Google Scholar]
- 14.Johansson A, Lau J, Sandberg M, Borg LA, Magnusson PU, Carlsson PO. Endothelial cell signalling supports pancreatic beta cell function in the rat. Diabetologia 52: 2385–2394, 2009 [DOI] [PubMed] [Google Scholar]
- 15.Kleinfeld D, Mitra PP, Helmchen F, Denk W. Fluctuations and stimulus-induced changes in blood flow observed in individual capillaries in layers 2 through 4 of rat neocortex. Proc Natl Acad Sci USA 95: 15741–15746, 1998 [DOI] [PMC free article] [PubMed] [Google Scholar]
- 16.Liu YM, Guth PH, Kaneko K, Livingston EH, Brunicardi FC. Dynamic in vivo observation of rat islet microcirculation. Pancreas 8: 15–21, 1993 [DOI] [PubMed] [Google Scholar]
- 17.Niswender KD, Shiota M, Postic C, Cherrington AD, Magnuson MA. Effects of increased glucokinase gene copy number on glucose homeostasis and hepatic glucose metabolism. J Biol Chem 272: 22570–22575, 1997 [DOI] [PubMed] [Google Scholar]
- 18.Nyman LR, Wells KS, Head WS, McCaughey M, Ford E, Brissova M, Piston DW, Powers AC. Real-time, multidimensional in vivo imaging used to investigate blood flow in mouse pancreatic islets. J Clin Invest 118: 3790–3797, 2008 [DOI] [PMC free article] [PubMed] [Google Scholar]
- 19.Orci L, Unger RH. Functional subdivision of islets of Langerhans and possible role of D cells. Lancet 2: 1243–1244, 1975 [DOI] [PubMed] [Google Scholar]
- 20.Quoix N, Cheng-Xue R, Guiot Y, Herrera PL, Henquin JC, Gilon P. The GluCre-ROSA26EYFP mouse: a new model for easy identification of living pancreatic alpha-cells. FEBS Lett 581: 4235–4240, 2007 [DOI] [PubMed] [Google Scholar]
- 21.Rottman JN, Bracy D, Malabanan C, Yue Z, Clanton J, Wasserman DH. Contrasting effects of exercise and NOS inhibition on tissue-specific fatty acid and glucose uptake in mice. Am J Physiol Endocrinol Metab 283: E116–E123, 2002 [DOI] [PubMed] [Google Scholar]
- 22.Samols E, Stagner JI. Islet somatostatin—microvascular, paracrine, and pulsatile regulation. Metabolism 39: 55–60, 1990 [DOI] [PubMed] [Google Scholar]
- 23.Samols E, Stagner JI, Ewart RB, Marks V. The order of islet microvascular cellular perfusion is B–A–D in the perfused rat pancreas. J Clin Invest 82: 350–353, 1988 [DOI] [PMC free article] [PubMed] [Google Scholar]
- 24.Srinivas S, Watanabe T, Lin CS, William CM, Tanabe Y, Jessell TM, Costantini F. Cre reporter strains produced by targeted insertion of EYFP and ECFP into the ROSA26 locus. BMC Dev Biol 1: 4, 2001 [DOI] [PMC free article] [PubMed] [Google Scholar]
- 25.Stagner JI, Samols E, Bonner-Weir S. Beta–alpha–delta pancreatic islet cellular perfusion in dogs. Diabetes 37: 1715–1721, 1988 [DOI] [PubMed] [Google Scholar]
- 26.Stagner JI, Samols E, Marks V. The anterograde and retrograde infusion of glucagon antibodies suggests that A cells are vascularly perfused before D cells within the rat islet. Diabetologia 32: 203–206, 1989 [DOI] [PubMed] [Google Scholar]
- 27.Weir GC, Bonner-Weir S. Islets of Langerhans: the puzzle of intraislet interactions and their relevance to diabetes. J Clin Invest 85: 983–987, 1990. [DOI] [PMC free article] [PubMed] [Google Scholar]
Associated Data
This section collects any data citations, data availability statements, or supplementary materials included in this article.


