Abstract
Pitch, our perception of how high or low a sound is on a musical scale, crucially depends on a sound's periodicity. If an acoustic signal is temporally jittered so that it becomes aperiodic, the pitch will no longer be perceivable even though other acoustical features that normally covary with pitch are unchanged. Previous electrophysiological studies investigating pitch have typically used only periodic acoustic stimuli, and as such these studies cannot distinguish between a neural representation of pitch and an acoustical feature that only correlates with pitch. In this report, we examine in the auditory cortex of awake marmoset monkeys (Callithrix jacchus) the neural coding of a periodicity's repetition rate, an acoustic feature that covaries with pitch. We first examine if individual neurons show similar repetition rate tuning for different periodic acoustic signals. We next measure how sensitive these neural representations are to the temporal regularity of the acoustic signal. We find that neurons throughout auditory cortex covary their firing rate with the repetition rate of an acoustic signal. However, similar repetition rate tuning across acoustic stimuli and sensitivity to temporal regularity were generally only observed in a small group of neurons found near the anterolateral border of primary auditory cortex, the location of a previously identified putative pitch processing center. These results suggest that although the encoding of repetition rate is a general component of auditory cortical processing, the neural correlate of periodicity is confined to a special class of pitch-selective neurons within the putative pitch processing center of auditory cortex.
INTRODUCTION
An essential function of the auditory system is to extract and encode the time-varying features of acoustic signals. Acoustic parameters like modulation frequency and envelope repetition rate are important information-bearing components for vocal communication across many species (DiMattina and Wang 2006; Rosen 1992; Singh and Theunissen 2003; Suga 1994). Moderately complex acoustic signals like sinusoidally amplitude modulated (sAM) tones and acoustic pulse trains have been commonly used in previous studies of temporal processing in the auditory system (Eggermont 1998; Gaese and Ostwald 1995; Joris et al. 2004; Phan and Recanzone 2007; Schreiner and Urbas 1988). In response to sAM tones, neurons in the auditory cortex of awake primates represent modulation frequency using a temporal and/or rate representation, the latter typically taking the form of a band-pass-tuned modulation transfer function (Bendor and Wang 2008; Liang et al. 2002; Malone et al. 2007). Here we refer to neurons that covary their firing rate with the modulation frequency or envelope repetition rate of the stimulus as “modulation sensitive.” Single-unit recordings in the primary auditory cortex (AI) of marmosets have identified two types of modulation sensitive responses involved with encoding the repetition rate of an acoustic pulse train (Lu et al. 2001; Wang et al. 2003). The first neuronal population encodes repetition rates within the perceptual range of acoustic flutter (subpitch sounds with pulse rates of 10–45 Hz) (Besser 1967; Miller and Taylor 1948) using both stimulus synchronization (Lu et al. 2001) and a discharge rate based neural representation (Bendor and Wang 2007). A second neuronal population referred to in previous studies as the “nonsynchronizing population” (Lu and Wang 2004; Lu et al. 2001) encodes faster repetition rates that are within the perceptual range of pitch (Krumbholz et al. 2000; Plack et al. 2005). The term nonsynchronizing is used to indicate that this population does not synchronize its neuronal firing to the acoustic signal's envelope and as such encodes repetition rate by only using its discharge rate.
For temporally regular sounds, like unipolar click trains and sine phase harmonic complex tones, the repetition rate generally matches the perceived pitch (Plack et al. 2005). If temporal regularity is degraded, the pitch-salience decreases eventually making the pitch undetectable even though the average repetition rate has not been changed. A putative pitch-processing center in the low frequency region of auditory cortex has recently been identified in both humans and monkeys (Bendor and Wang 2005, 2006; Patterson et al. 2002; Penagos et al. 2004; Schneider et al. 2005; Schönwiesner and Zatorre 2008). The firing rates of pitch-selective neurons in this cortical region increase with pitch strength and are tuned to fundamental frequency. Pitch-selective neurons respond to both pure tones at their best fundamental frequency and missing fundamental sounds (composed of higher order harmonics) that have the same pitch but lack spectral energy at their fundamental frequency. As such, these neurons provide a neural correlate of certain acoustical features that covary with pitch perception (Bendor and Wang 2005). Behavioral evidence that these neurons are necessary for pitch perception still remains to be demonstrated.
If neurons throughout auditory cortex can encode the repetition rate of complex sounds using their discharge rate, then what is the difference between pitch-selective neurons and modulation sensitive neurons? Modulation sensitive neurons encode repetition rates for acoustic signals with carrier frequencies near their best frequency, whereas pitch-selective neurons are capable of responding to complex tones the spectrum of which does not overlap with their best frequency when such a tone is modulated at the neuron's preferred repetition rate. (Bendor and Wang 2005). Here we compare the repetition rate tuning of neurons for acoustic stimuli that differ in spectral bandwidth and envelope shape and rise time. We find that pitch-selective neurons have a more consistent best repetition rate across different acoustic stimuli than modulation sensitive neurons outside of the putative pitch center, indicating that some modulation sensitive neurons are tuned to additional acoustic features (e.g., envelope rise time).
Another potential difference between modulation sensitive and pitch-selective neurons is their sensitivity to changes in temporal regularity, an acoustic feature that covaries with pitch salience (Patterson et al. 1996; Pollack 1968). Human imaging studies have reported a neural correlate of pitch salience in lateral Heschl's gyrus, the anatomical location of a putative pitch center in human auditory cortex (Penagos et al. 2004). In contrast to pitch-selective neurons, neurons that encode repetition rate but not pitch salience may be only encoding the average repetition rate and lack sensitivity to temporal regularity. We tested this hypothesis using acoustic pulse trains, a sequence of brief sounds that can be temporally jittered parametrically between a periodic temporal structure (“regular”) and a highly random temporal structure (“irregular”). A regular pulse train generates a salient pitch percept, and the pitch salience degrades with increasing temporal irregularity even though the average repetition rate remains unchanged (Kaernbach and Demany 1998; Yost et al. 2005). Here we show that pitch-selective neurons are sensitive to temporal regularity and that the firing rates of modulation sensitive neurons outside the putative pitch center generally do not change between regular and irregular acoustic pulse trains with the same average repetition rate.
METHODS
General experimental procedures
Details of experimental procedures can be found in recent publications from our laboratory (Wang et al. 2005). Single-unit recordings were conducted in four awake marmosets [M36N (right hemisphere), M2P (left and right hemisphere), M41O (left hemisphere), and M32Q (left hemisphere)]. For each experiment, the marmoset was sitting quietly in a semi-restraint device with its head immobilized. Experiments were carried out within a double-walled soundproof chamber (Industrial Acoustics, Bronx, NY) with an interior covered by 3-in acoustic absorption foam (Sonex, Illbruck. High-impedance tungsten microelectrodes (AM Systems, 2–5 MΩ) were mounted on a micromanipulator (Narishige) and advanced by a manual hydraulic microdrive (Trent Wells). Typically 5–15 electrode penetrations were made within a miniature recording hole (diameter: ∼1 mm), after which the hole was sealed with dental cement, and another hole was opened for new electrode penetrations. Action potentials were detected on-line using a template based spike sorter (MSD, Alpha Omega Engineering), which was continuously monitored during the experiment. Neurons were recorded from all cortical layers but most commonly from supragranular layers. All experimental procedures were approved by the Johns Hopkins University Animal Use and Care Committee.
Generation of acoustic stimuli
Digitally generated acoustic stimuli were played from a free-field speaker located 1 m in front of the animal. All sound stimuli were generated at a 100 kHz sampling rate and low-pass filtered at 50 kHz. Harmonic artifacts were ≥43 dB lower than the fundamental at 80 dB SPL. This difference grew as the sound level of the fundamental decreased. The maximum sound level of individual frequency components used in this study was 80 dB SPL. The animal was awake and semi-restrained in a custom-made primate chair but was not performing a task during these experiments.
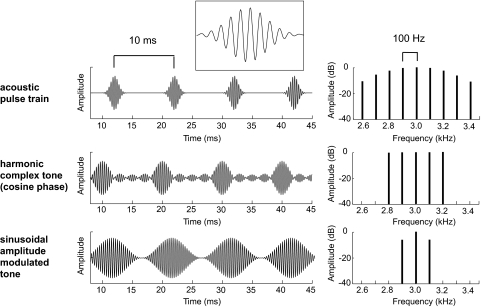
After each neuron was isolated, we measured its basic response properties, such as best frequency (BF) and sound level threshold. Neurons that were responsive to pure tones were tested with sAM tones, harmonic complex tones, and/or acoustic pulse trains (see Fig. 1). Complex tone, sAM tone, and acoustic pulse train stimuli were 500 ms in duration. All intertrial intervals for these stimuli were ≥1 s long. Modulation frequency tuning functions for sAM stimuli spanned 4–512 Hz in octave or half-octave steps.
Fig. 1.
Acoustic stimulus. Acoustic waveform (left) and spectrum (right) of a Gaussian narrowband acoustic pulse train (top), a missing fundamental harmonic complex tone (middle), and a sinusoidally amplitude modulated (sAM) tone (bottom). The acoustic pulse train has a 3 kHz carrier, 100 Hz repetition rate, and σ = 0.89. Inset: an enlarged view of a single Gaussian pulse. The missing fundamental harmonic complex tone is composed of harmonics 28–32 and has a 100 Hz fundamental frequency (repetition rate). The sAM tone has a modulation frequency of 100 Hz and a 3 kHz carrier.
ACOUSTIC PULSE TRAINS.
Each pulse was generated by windowing the preferred carrier signal (pure tones) by a Gaussian envelope. In a limited number of cases, we used other types of acoustic pulse trains, including rectangular clicks and Gaussian windowed acoustic pulses with a broadband noise carrier. Pulse widths ranged from 0.1 to 1 ms for rectangular clicks and Gaussian pulses had a σ ranging from 0.89 to 2.53 ms. Pulse train repetition rates between 13 and 500 Hz were used. The sound intensity level of each acoustic pulse train was generally at the preferred sound level for modulation sensitive neurons with nonmonotonic rate-level functions and 10–30 dB above threshold for modulation sensitive neurons with monotonic rate-level functions. For pitch-selective neurons, sound levels for acoustic pulse trains were at or near the threshold for a tone at the neuron's BF. Regular acoustic pulse trains had repetition rates near the preferred fundamental frequency for pitch-selective and nonmonotonic modulation sensitive neurons while for positive monotonic modulation sensitive neurons a repetition rate between 200 and 500 Hz was chosen. For modulation sensitive neurons, the carrier frequency was equal to the BF, while the carrier frequency for pitch-selective neurons was an integer multiple of the acoustic pulse train's repetition rate, somewhere within the range of 1–4 kHz. Temporally regular acoustic pulse trains had interpulse intervals equal to the inverse of the repetition rate. Irregular acoustic pulse trains were created by randomly jittering each interpulse interval (IPI) by a random number generated from a uniform distribution between [Ja, Jb], where Ja = IPI − IPI*(maximum jitter) and Jb = IPI + IPI*(maximum jitter). The maximum jitter was varied between 5 and 50% in 5% steps. Thus for a mean interpulse interval of 10 ms and a maximum jitter of 10%, each interpulse interval would be chosen from a uniform distribution spanning values between 9 and 11 ms. For a given jitter amount, the temporal pattern of aperiodic acoustic pulses was the same across all trials.
HARMONIC COMPLEX TONES.
The most commonly used harmonic complex tone had three components in cosine phase, and each component was played at the neuron's sound level threshold measured at its BF. Sound levels 10 dB or more below BF threshold were also used in roughly one-third of pitch-selective neurons (25/74) to evoke significant missing fundamental responses. In a few cases we used harmonic complex tones composed of more than three components with harmonics most commonly in Schroeder phase (Schroeder and Strube 1986). Neurons failed the criteria of pitch selectivity if they did not respond to missing fundamental sounds with the individual harmonics presented at 10 dB above the neuron's sound level threshold at its BF (or lower sound levels). Components of the missing fundamental harmonic complex tone (MF) were considered outside the neuron's excitatory frequency response area if each harmonic component, when played individually at 0 and +10 dB relative to its sound level within the harmonic complex, did not evoke a significant excitatory response. Also for neurons tested with harmonic complex tones composed of greater than three components, no response to individual components +20 dB above threshold was also required. Sound levels were varied in 10 dB steps.
Typically 10 repetitions of each acoustic pulse train, complex tone, and rate level stimulus set were presented; however, data with a minimum of five repetitions per stimulus were included in the analysis. Frequency tuning curves and rate-level functions were typically generated using 200 ms long pure tone stimuli and interstimulus intervals >500 ms.
Data analysis
Discharge rates >2 SD above the mean spontaneous rate and >1 spike for 50% of the trials were considered significant. Vector strengths >0.1 with a Rayleigh statistic >13.8 (P < 0.001) were considered statistically significant (Mardia and Jupp 2000). The weighted best repetition rate, was the spike rate weighted average of all repetition rates (in octaves) near the best repetition rate (peak firing rate) that had firing rates >50% of the peak firing rate.
CRITERIA FOR PITCH-SELECTIVE NEURONS.
Pitch selectivity was defined as a neuron that responded to pure tones, responded to missing fundamental sounds with a fundamental frequency near its BF and did not respond significantly to components of the missing fundamental sound when they were played individually and the sound level of the missing fundamental sound (measured relative to the individual components) did not need to be >10 dB above the neuron's BF sound level threshold to drive the neuron (Bendor and Wang 2005). Missing fundamental sounds are complex tones containing only harmonics above the fundamental frequency and have the same pitch as a pure tone played at the fundamental frequency. Sound levels were limited to <10 dB above the neuron's BF sound level threshold to avoid combination tones (nonlinear distortion products produced by the cochlea when multiple harmonics are simultaneously played). The combination tone present at the fundamental frequency is ∼20 dB below the sound level of a single harmonic component (Pressnitzer and Patterson 2001).
Firing rates were calculated using the entire stimulus duration. It is important to note that sensitivity to temporal regularity was not used as part of the criteria for pitch selectivity. Pitch-selective neurons were found in each of the four marmosets used in these experiments. A previous publication (Bendor and Wang 2005) presented data from pitch-selective neurons recorded from three of the four marmosets (M36N, M2P, M41O) used in these experiments.
CRITERIA FOR MODULATION SENSITIVE NEURONS.
Neurons that had significant firing rates for at least a subset of repetition rates within the range of pitch but responded to pure tones at higher frequencies were considered modulation sensitive neurons. A subset of repetition rates was defined as at least three sequential repetition rates tested between 30 and 500 Hz, spanning at least one-half octave. Discharge rates were calculated over the duration of the acoustic stimulus plus 100 ms following the stimulus. In addition, modulation sensitive neurons were also required to have significant firing rates for a subset of repetition rates when both the onset (1st 100 ms) and offset (100 ms following the end of the stimulus) were not included in the calculation of discharge rate. Without removing the onset and offset, we cannot distinguish between sustained responses (observed in nonsynchronizing neurons) and onset responses (observed in synchronizing neurons). Synchronizing neurons typically produce an onset response (followed by suppression) when the repetition rate is above their synchronization limit. In addition because some neurons had very low spontaneous firing rates, significant responses were also required to have one or more spikes on ≥50% of trials.
Our analysis only focused on neurons with significant firing rates during the acoustic stimulus. Neurons with purely onset responses (and nonsignificant sustained responses) to repetition rates in the range of pitch were not included in the analysis (n = 66). We did not find any evidence of jitter sensitivity in this population of neurons given that normalized firing rates between regular and irregular acoustic pulse trains were not significantly different (Wilcoxon rank sum test, P > 0.05 uncorrected, n = 10). We also did not find any evidence of similarity in repetition rate tuning between sAM tones and acoustic pulse trains (Spearman correlation coefficient r = 0.16, P = 0.46, n = 24).
The population of modulation sensitive neurons was further subdivided into nonsynchronized and mixed response neurons according to each neuron's ability to synchronize its firing to acoustic pulses in the stimulus (Rayleigh statistic >13.8, P < 0.001). Mixed response neurons synchronized within the range of acoustic flutter (subpitch sounds with repetition rates below 40–45 Hz) while nonsynchronized neurons did not. It is important to note that nonsynchronized neurons differ from unsynchronized neurons (Bendor and Wang 2007) in that unsynchronized neurons have significant firing rates in the range of acoustic flutter while nonsynchronized neurons have significant firing rates in the range of pitch (>30 Hz).
In addition to a classification based on synchronization, modulation sensitive neurons were also classified according how they co-varied their firing rate with the repetition rate of pulses within the acoustic pulse train. Positive monotonic neurons had higher discharge rates for acoustic pulse trains with higher repetition rates over the range of 30–512 Hz. A nonparametric rank order correlation between discharge rate and repetition rate (Spearman correlation coefficient, r > 0, P < 0.05) was used to determine statistically significant positive-sloped monotonicity. Because positive monotonic responses were the most commonly observed, all remaining tuning curve shapes were classified collectively as “other” in our analyses. This group contained both negative monotonic and multiple types of nonmonotonic tuning curves (see Table 1).
Table 1.
Types of modulation sensitive neurons
| Mixed | Nonsynchronized | Total | |
|---|---|---|---|
| Positive monotonic | 17 | 56 | 73 |
| Negative monotonic | 10 | 6 | 16 |
| Other tuning curve shape | 10 | 16 | 26 |
| Total | 37 | 78 | 115 |
Five modulation sensitive neurons (2 mixed response, 3 nonsynchronizing) showed either a large or insignificant change in discharge rate between regular and irregular pulse trains depending on either the carrier frequency or repetition rate used. These five neurons were excluded from the analysis in Fig. 14 and 15.
Fig. 14.
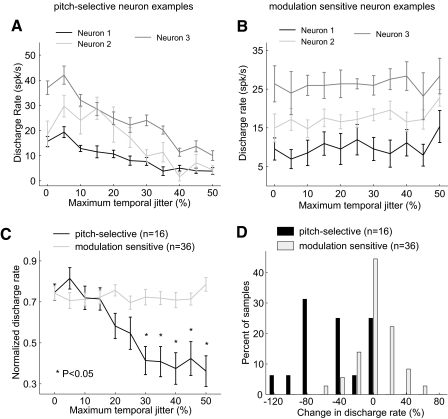
Comparison of sensitivity to temporal irregularity between pitch-selective and modulation sensitive neurons. A: individual examples of regular and irregular pulse train responses in pitch-selective neurons. Neuron 1 (unit M32Q-101.1, rectangular clicks), neuron 2 (unit M41O-276.1, acoustic pulse train with tone carrier), neuron 3 (unit M36N-523.1, acoustic pulse train with noise carrier). B: individual examples of regular and irregular pulse train responses in modulation sensitive neurons: neuron 1 (unit M2P-357.2, field RT), neuron 2 (unit M32Q-117.1, field R), neuron 3 (unit M36N-418.1, field AI). C: normalized tuning in pitch-selective and modulation sensitive neurons to acoustic pulse trains varying in temporal irregularity. For pitch-selective neurons, normalized responses for all jitter values significantly different from regular click trains (P < 0.05 Bonferonni corrected, Wilcoxon rank sum test) are indicated (*). Normalized responses of modulation sensitive neurons to irregular acoustic pulse trains were not significantly different from regular acoustic pulse trains. D: a comparison between pitch-selective and modulation sensitive neurons in their interpolated percent change in discharge rate between a regular and irregular (50% jitter) acoustic pulse train. The 2 distributions are significantly different (P < 3.6× 10⁻⁵, Wilcoxon rank sum test).
Fig. 15.
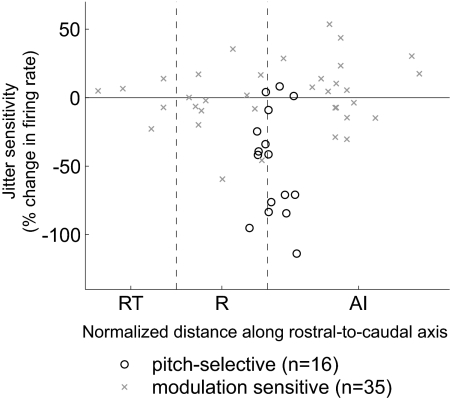
Topographic distribution of temporal regularity sensitivity. Temporal regularity sensitivity (from Fig. 14D) of modulation sensitive and pitch-selective neurons plotted according to their position along the rostro-caudal axis of auditory cortex (in normalized coordinates). The dashed vertical lines indicate the boundaries between AI/R and R/RT.
A normalized map of the location of pitch-selective neurons and modulation sensitive neurons was created using data from four hemispheres. We did not adequately sample the fifth hemisphere (M2P right hemisphere) that we recorded from to define the borders of each auditory field. Frequency reversals were used to define the borders of the three core fields: primary auditory cortex (AI), rostral field (R), and rostrotemporal field (RT) (Bendor and Wang 2008; Kaas and Hackett 2000; Morel and Kass 1992; Petkov et al. 2006). Differences in the spatial distribution of pitch-selective neurons and modulation sensitive neurons were quantified using a Kolmogorov-Smirnov test (P < 0.05). We compared both the caudal-to-rostral or medial-to-lateral axis of auditory cortex in this analysis.
Statistical significant differences in population responses (normalized discharge rate and average vector strength) between two repetition rates was determined using a Wilcoxon rank sum test (P < 0.05, Bonferroni corrected for multiple comparisons).
The change in discharge rate between regular and irregular acoustic pulse trains (Fig. 14D), was calculated by performing a linear interpolation on the firing rates at all tested jitter values (0–50%). The slope obtained from this calculation was used to determine the change in firing rate between acoustic pulse trains with 0 and 50% maximum temporal jitter.
RESULTS
The data presented in this report include a total of 254 neurons recorded from the auditory cortex of four marmosets (5 hemispheres) that responded significantly to moderately complex acoustic stimuli such as sAM tones, acoustic pulse trains, or harmonic complex tones (Fig. 1).
In auditory cortex, the spectrum of an acoustic signal must typically overlap with a neuron's frequency response area to evoke a response. For such neurons, we centered the spectra of these acoustic stimuli at the neuron's BF. Given that a modulation frequency is lower than its carrier frequency, these neurons were generally tuned to modulation frequencies that were outside of their frequency response area. We use the term “modulation sensitive neurons” in this report to refer to this population of neurons.
Responses of modulation sensitive neurons
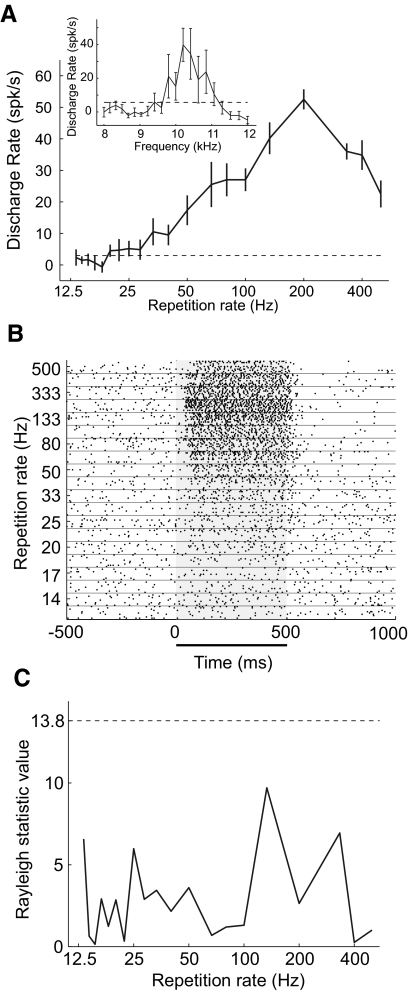
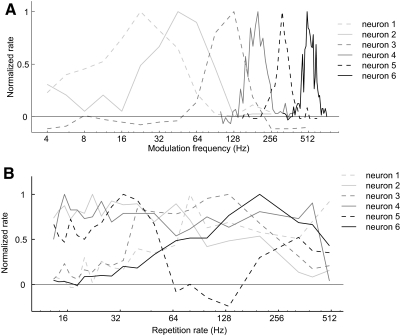
The example modulation sensitive neuron shown in Fig. 2 is tuned to repetition rates within the range of pitch (for an acoustic pulse train) with a peak response at a repetition rate of 200 Hz (A and B). This neuron does not synchronize to the acoustic pulse train (Fig. 2C) and therefore only provides a neural representation of the repetition rate with its discharge rate. This neuron has a BF of 10.2 kHz (Fig. 2A, inset), which is substantially higher than its response range of repetition rates (in frequency). Across the population of modulation sensitive neurons, tuning for modulation frequency (frequency of periodicity in sAM tones) and repetition rate (frequency of periodicity in acoustic pulse trains) spanned the entire range of modulation frequencies producing a missing fundamental pitch (≤800 Hz; Fig. 3) (Ritsma 1962).
Fig. 2.
Response from an individual modulation sensitive neuron. A: discharge rate of a neuron [unit M2P-921.1, primary auditory cortex/rostral field (AI/R) border] to acoustic pulse trains (σ = 0.89). Inset: the response of the neuron to pure tones varying in frequency. Error bars indicate the SE. B: raster plot of the neuron shown in A responding to acoustic pulse trains at different repetition rates (13–500 Hz). The horizontal line underneath the raster plot indicates the time period that the acoustic stimulus was played. C: Rayleigh statistic for neuronal response shown in A. None of these responses reached the criteria for statistical significance (13.8, P < 0.001) which is indicated on the plot with a dashed horizontal line.
Fig. 3.
Modulation frequency and repetition rate tuning in modulation sensitive neurons. A: modulation frequency tuning to sAM tones for 6 neurons in auditory cortex: neuron 1 (unit M41O-242.1), neuron 2 (unit M2P-109.1), neuron 3 (unit M32Q-348.1), neuron 4 (unit M41O-248.2), neuron 5 (unit M41O-241.1), neuron 6 (unit M2P-56.1). Neuron 3 was recorded in field AI. The remaining neurons were recorded from field R. B: repetition rate tuning to acoustic pulse trains for 6 neurons in auditory cortex: neuron 1 (unit M2P-799.1, field AI), neuron 2 (unit-M32Q-79.1, field R), neuron 3 (unit M2P-30.1, field AI), neuron 4 (unit M2P-843.1, field AI), neuron 5 (unit M2P-411.1, field R), neuron 6 (unit M2P-921.1, AI/R border). All neurons have significant discharge rates over a subset of repetition rates in the range of pitch perception (>30 Hz). (Note that these neurons are not the same neurons shown in Fig. 3A).
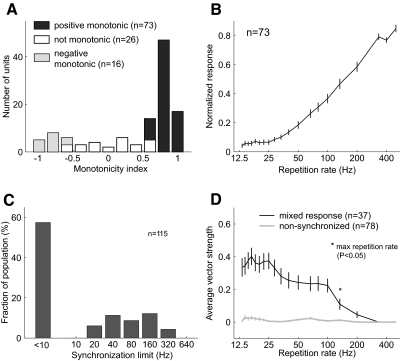
Repetition rate tuning in modulation sensitive neurons took a variety of forms, the most common being a positive monotonic trend (n = 73) for which the firing rate increased monotonically with repetition rate (Fig. 4, A and B). We also classified 16 neurons as having negative monotonic responses where discharge rate increased with a decreasing repetition rate. The remaining 26 neurons failing the criteria for monotonicity (see methods) had all-pass, band-pass, or notch/multipeak tuning.
Fig. 4.
Rate coding and synchronization ability of modulation sensitive neurons. A: distribution of monotonicity tuning in modulation sensitive neurons. The monotonicity index is the Spearman correlation coefficient for firing rates between 30 and 500 Hz. Statistically significant Spearman correlation coefficients (P < 0.05) are indicated. B: normalized discharge rate of modulation sensitive neurons with positive monotonic responses. Neurons monotonically increased their discharge rate with increasing repetition rate over the range 25–333 Hz. Population responses at repetition rates between 40 and 200 Hz and at 400 Hz were significantly different (Wilcoxon rank sum, P < 0.05 Bonferonni corrected) from the population discharge rates at both 500 and 13 Hz. C: distribution of the synchronization limit in modulation sensitive neurons. D: mean vector strength of modulation sensitive neurons with nonsynchronized and mixed responses. Only the mixed response population had an average vector strength significantly different from zero, and only for repetition rates equal to and <133 Hz (Wilcoxon rank sum test, P < 0.05 Bonferonni corrected).
The majority of modulation sensitive neurons were not able to stimulus synchronize to the individual pulses of acoustic pulse trains in our stimulus set (Fig. 4C). In this report, we will refer to neurons that were unable stimulus synchronize as “nonsynchronized,” whereas neurons showing some degree of stimulus synchronization (while also covarying their firing rate with repetition rate) will be referred to as having a “mixed response” (Fig. 4D). The median synchronization limit of mixed response neurons was 100 Hz (25–75%: 48–156 Hz). Using a criterion of stimulus synchronization (see methods), 78 nonsynchronized neurons and 37 mixed response neurons were identified (Table 1). For both nonsynchronized and mixed response neurons all types of repetition rate tuning was observed (see Table 1). The most common observed response occurring in roughly half of samples (56/115) was both positive monotonic and nonsynchronized.
Pitch-selective responses
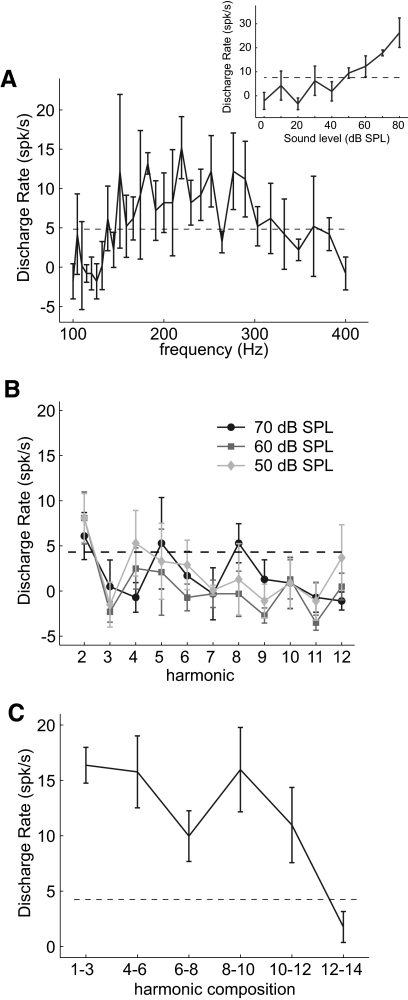
We have previously identified an additional class of neurons that have best repetition rates that are similar to their BFs (based on pure tones) (Bendor and Wang 2005). We refer to these neurons as “pitch selective” because they respond to missing fundamental sounds with a pitch near their BF and with a spectrum outside of their excitatory frequency response area (Fig. 5, see methods).
Fig. 5.
Pitch-selectivity criteria in an example pitch-selective neuron. All data are shown is from unit M2P-157.1. Error bars in A–C indicate the SE. A: frequency tuning curve for tones played at 50 dB SPL. Inset: a rate-level response at best frequency. B: response to harmonics of the best fundamental frequency (182 Hz) played individually at 0, +10, and +20 dB above the sound level threshold at the best frequency. C: response to harmonic complex tones (each harmonic is played at 50 dB SPL). All acoustic stimuli are missing the fundamental frequency except for the acoustic stimulus composed of harmonics 1–3.
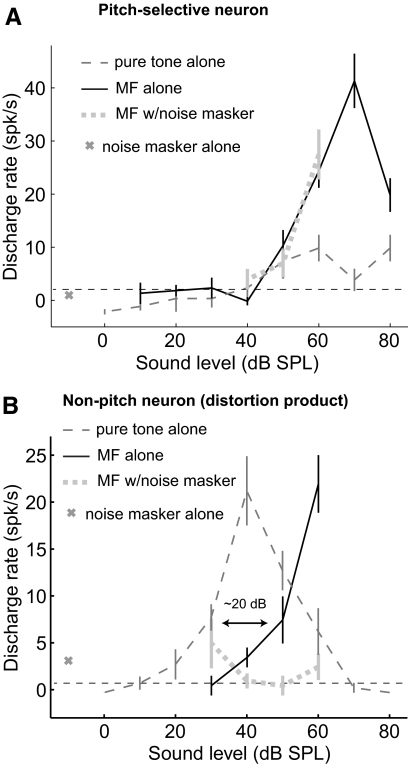
Using these criteria, a total of 74 pitch-selective neurons were identified in four marmosets. A subset of these pitch-selective neurons (53/74) have been reported in an earlier publication (Bendor and Wang 2005) (see methods). Missing fundamental responses were measured near the sound level threshold of the neuron's BF to avoid the effect of combination tones. Combination tones are nonlinear distortion products produced by the cochlea when multiple harmonic tones are present. The combination tone produced at the fundamental frequency is ∼20 dB below the sound level of a single component (Pressnitzer and Patterson 2001). Therefore at sufficiently high sound levels, missing fundamental responses could be the result of combination tones produced at the neuron's BF. Neurons within the putative pitch center that did not respond to near threshold missing fundamental sounds could still respond to missing fundamental sounds when sound levels were 20 dB or more above threshold (Fig. 6). However, unlike pitch-selective neurons, these missing fundamental responses could be blocked with the addition of a noise masker (Fig. 6).
Fig. 6.
Example of a pitch-selective neuron's response and a distortion product response in a nonpitch neuron. Error bars indicate the SE. A: a pitch-selective neuron's rate-level response (unit M41O-294.1) to pure tones and missing fundamental sounds (with and without a noise masker). The neuron has a similar threshold for both pure tones and missing fundamental sounds. At higher sound levels, the response to the missing fundamental is greater than the pure tone response. With the addition of the noise masker, the missing fundamental response does not change. The noise masker itself did not evoke a significant response in the neuron. B: a nonpitch neuron's rate-level response (unit M41O-251.2) to pure tones and missing fundamental sounds (with and without a noise masker). The response to missing fundamental sounds had a 20 dB higher sound level threshold. On the addition of the noise masker, the neuron no longer responded to the missing fundamental sound. This neuron was recorded from within the pitch center.
Comparison pitch-selective and modulation sensitive neurons
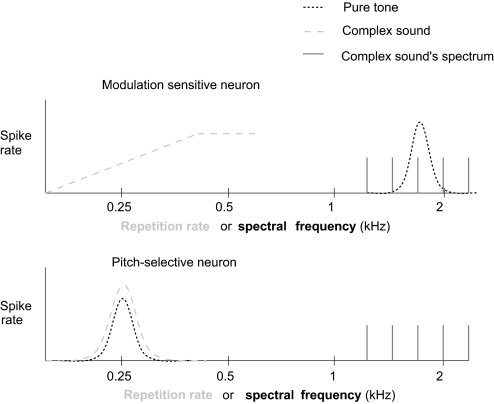
Given that repetition rate tuning is observed in both modulation sensitive and pitch-selective neurons, how do these two neuronal populations differ? As we have already discussed, modulation sensitive neurons have different best frequencies and best repetition rates and respond to complex sounds with spectra overlapping their BF (Fig. 7). On the other hand, pitch-selective neurons have similar repetition rate and pure tone tuning and respond to complex sounds with spectra that do not overlap with their BF (Fig. 7).
Fig. 7.
Comparison of modulation sensitive and pitch-selective neurons. Modulation sensitive neurons have different best frequencies (pure tone tuning) and best repetition rates (complex tone tuning) and respond to complex sounds with spectra overlapping their best frequency. Pitch-selective neurons have similar pure tone and complex tone tuning and respond to complex sounds with spectra that do not overlap with their best frequency.
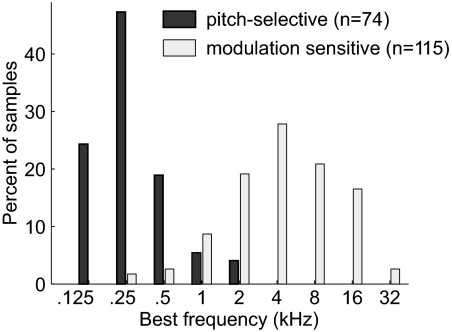
Although pitch-selective neurons generally have low frequency BFs (Bendor and Wang 2005), we observed that the range of BFs in modulation sensitive neurons stretched across almost the entire tonotopic axis (Fig. 8, Wilcoxon rank sum test, P < 7.4 × 10⁻²⁹). The lack of modulation sensitive neurons with very low BFs is due to our criteria that the neuron's BF needed to be higher than the repetition rates that the neuron encoded. Neurons that do not pass the criteria of pitch selectivity also exist within the putative pitch center (Bendor and Wang 2005); however, these are low BF neurons that do not encode the repetition rate of complex sounds with spectra at higher frequencies (outside of their excitatory frequency response area).
Fig. 8.
Best frequency (BF) distribution of pitch-selective and modulation sensitive neurons. Distribution of the BF of pitch-selective and modulation sensitive neurons across 4 subjects (5 hemispheres). Pitch-selective neurons had a significantly lower BF (Wilcoxon rank sum test, P < 7.4 × 10⁻²⁹).
Spatial distribution of pitch-selective and modulation sensitive neurons
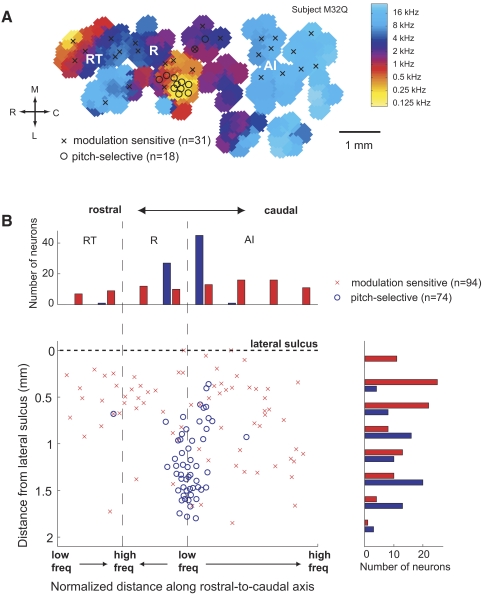
We next examined the spatial distribution of pitch-selective neurons and modulation sensitive neurons. An example of a cortical map from one subject with the locations of these two classes of neurons is shown in Fig. 9A. We compared the spatial distributions of pitch-selective neurons with modulation sensitive neurons across four subjects on a normalized cortical map (Fig. 9B). Pitch-selective neurons were found on the border of AI, R, and lateral belt, whereas modulation sensitive neurons were distributed throughout auditory cortex. The spatial distributions were significantly different along the medial-to-lateral axis (Kolmogorov-Smirnov test, P < 7.4 × 10⁻⁹) and caudal-to-rostral axis of auditory cortex (Kolmogorov-Smirnov test, P < 1.1 × 10⁻⁹).
Fig. 9.
Spatial distribution of pitch-selective and modulation sensitive neurons. A: frequency map from 1 subject (M32Q-left hemisphere) with the location of pitch-selective neurons and modulation sensitive neurons indicated. B: normalized cortical map of locations of pitch-selective and modulation sensitive neurons across four subjects (4 hemispheres).
Similarity in repetition rate tuning for different acoustic signals
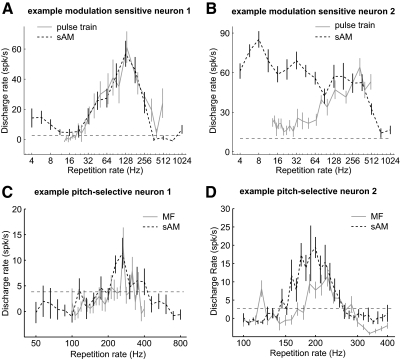
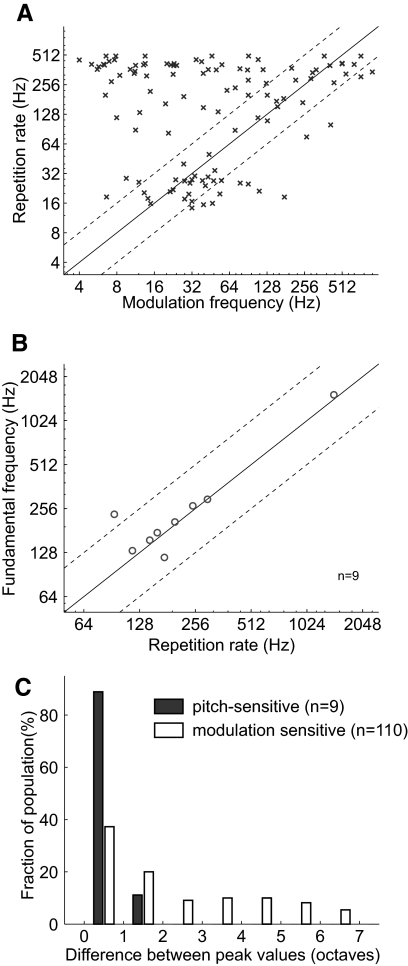
We next compared the similarity in repetition rate tuning across different acoustic signals for these two neuronal populations. A total of 110 modulation sensitive neurons were tested with both sAM tones and acoustic pulse trains, which differ in both their spectral bandwidth and envelope shape. The tuning for repetition rate was similar for sAM tones and acoustic pulse trains for some neurons (Fig. 10A), whereas other neurons showed very different responses for the two types of acoustic signals (B). Nine pitch-selective neurons were tested with missing fundamental (MF) complex tones and either sAM tones or acoustic pulse trains. We observed similar tuning for repetition rate between the two acoustic signals tested (Fig. 10, C and D).
Fig. 10.
Repetition rate tuning of modulation sensitive and pitch-selective neurons to 2 different acoustic stimuli. Error bars in A–D indicate the SE. A: similar repetition rate tuning for acoustic pulse trains and sAM tones for a neuron in auditory cortex (unit M2P-901.2, AI/R border). B: dissimilar repetition rate tuning for acoustic pulse trains and sAM tones for a neuron in auditory cortex [unit M2P-311.2, field rostrotemporal (RT)]. C. similar repetition rate tuning for a missing fundamental complex tone and an sAM tone for a pitch-selective neuron (unit M2P-233.1). D: similar repetition rate tuning for a missing fundamental complex tone and an sAM tone for a pitch-selective neuron (unit M41O-248.2).
Overall, modulation sensitive neurons did not have a significant correlation (Spearman correlation coefficient, r = −0.0091, P = 0.93) between their weighted best repetition rate for acoustic pulse trains and their weighted best modulation frequency for sAM tones (Fig. 11A). Only 38 of 110 modulation sensitive neurons (35%) had best repetition rates within one octave of each other for the two acoustic stimuli.
Fig. 11.
Similarity in repetition rate tuning for 2 acoustic signals. A: comparison of the weighted best modulation frequency (sAM tones) and weighted best repetition rate (acoustic pulse trains) for individual neurons within auditory cortex. The correlation was not statistically significant (Spearman correlation coefficient, r = −0.0091, P = 0.9252). The solid diagonal line indicates where y = x. The dashed diagonal lines indicate the 1 octave boundaries surrounding the y = x line. B: comparison of the weighted best fundamental frequency (missing fundamental complex tones) and weighted best repetition rate (sAM tone or acoustic pulse trains) for individual pitch-selective neurons. The correlation did reach statistical significance (Spearman correlation coefficient, r = 0.65, P = 0.067). C: a histogram of the absolute difference in peak values for repetition rate tuning in the 2 acoustic stimuli used in A and B. Pitch-selective neurons have a more similar best repetition rate for 2 spectrally different acoustic stimuli (Wilcoxon rank sum test, P < 2.0 × 10⁻⁴).
We next compared the monotonicity index (see methods) of modulation sensitive neurons for sAM tones and acoustic pulse trains. Similarity in this index for two tuning curves indicates a similar trend (firing rate increases or decreases with repetition rate) even when peak values differ. We observed a significant correlation between the monotonicity indices of neurons for these two acoustic stimuli (Spearman correlation coefficient, r = 0.54, P < 1.5 × 10⁻⁹). Even though repetition rate tuning can have a similar trend across different acoustic stimuli, a best repetition rate generally appears to be stimulus specific. Spectral bandwidth and envelope shape changes with modulation frequency for sAM stimuli (but is constant for acoustic pulse trains). Thus modulation sensitive neurons that do not have consistent best repetition rates across different acoustic stimuli may be also sensitive to acoustic parameters such as spectral bandwidth and envelope shape.
In our population of pitch-selective neurons, we observed that the best fundamental frequency was generally similar to the best repetition rate (from an acoustic pulse train or sAM tone). We did not observe a significant correlation (Spearman correlation coefficient, r = 0.065, P = 0.067), but this may be a result of the small sample size and a single outlier (Fig. 11B). Pitch-selective neurons had a significantly smaller difference in their best repetition rates for different acoustic signals than modulation sensitive neurons (Wilcoxon rank sum test, P < 2 × 10⁻⁴, Fig. 11C).
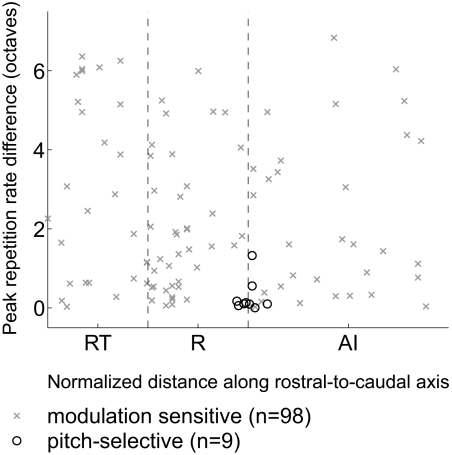
Pitch-selective neurons were found along the low-frequency border of fields AI and R, while modulation sensitive neurons were distributed all over fields AI, R, and RT. Modulation sensitive neurons with large and small differences in best repetition rate between acoustic stimuli were found in all three cortical fields (Fig. 12).
Fig. 12.
Topographic distribution of repetition rate tuning similarity. Peak repetition rate difference (from Fig. 11) of modulation sensitive and pitch-selective neurons plotted according to their position along the rostrocaudal axis of auditory cortex (in normalized coordinates). The dashed vertical lines indicate the boundaries between AI/R and R/RT.
Sensitivity to temporal regularity
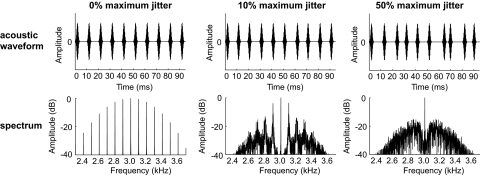
We next tested pitch-selective and modulation sensitive neurons with regular and irregular acoustic pulse trains. Irregular pulse trains had the same average repetition rates of regular pulse trains but were aperiodic. The temporal jitter of the interpulse interval was parametrically varied between 5 and 50% in irregular pulse trains (Fig. 13, see methods).
Fig. 13.
Acoustic stimuli used to test temporal regularity sensitivity. Acoustic waveform (top) and spectrum (bottom) of a Gaussian narrowband acoustic pulse train with a 3 kHz carrier, 100 Hz average repetition rate, and σ = 0.89 with 0% (left), 10% (middle), or 50% (right) temporal jitter.
The majority of pitch-selective neurons (11/16) decreased their firing rate more than 30% between regular and irregular (50% temporal jitter) acoustic pulse trains showing a preference for periodic acoustic signals (Fig. 14, A and C). In contrast to this, ∼80% of modulation sensitive neurons (29/36) did not change their firing rates more than 30% between regular and irregular acoustic pulse trains (Fig. 14, B and C).
We further quantified temporal regularity tuning by measuring the change in firing rate between regular acoustic pulse trains and irregular pulse trains with 50% jitter (maximum tested, see methods). Pitch-selective neurons had a negative mean change in firing rate between regular and maximally irregular pulse trains (–48.2 ± 38.0% change in firing rate, mean ± SD). This was not observed for modulation sensitive neurons (1.5 ± 23.3% change in firing rate). The difference in sensitivity to temporal irregularity between the two populations was statistically significant (Fig. 14D, Wilcoxon rank sum test, P < 3.6 × 10⁻⁵). There was also no difference in insensitivity to temporal irregularity for different types of modulation sensitive neurons. When modulation sensitive neurons were subdivided into smaller populations, based on their location in auditory cortex, stimulus synchronization, or tuning curve shape, no significant differences were observed in the mean change of firing rates for regular and irregular acoustic signals (Wilcoxon rank sum test, P > 0.05 uncorrected, Table 2). The jitter sensitivity of a modulation sensitive neuron did not depend on its location along the rostral-caudal axis of auditory cortex (Fig. 15).
Table 2.
Comparison of sensitivity to temporal irregularity between subclasses of modulation sensitive neurons
| Group 1 | Group 2 | Wilcoxon Rank Sum P Value |
|---|---|---|
| Nonsynchronized (29) | Mixed response (7) | 0.40 |
| Positive monotonic (22) | Other tuning curve shapes (14) | 0.47 |
| Al neurons (18) | R and RT neurons (18) | 0.81 |
n values in parentheses.
AI, primary auditory cortex; R, rostral field; RT, rostrotemporal field.
DISCUSSION
The temporal fidelity of the auditory nerve is remarkably precise with an ability to phase lock to the fine structure of an acoustic signal at rates ≤3–5 kHz (Johnson 1980). At each successive level in the pathway from the auditory nerve to auditory cortex, this temporal precession progressively decreases (Joris et al. 2004; Wallace et al. 2002). As a result, auditory cortex cannot encode an acoustic parameter such as envelope repetition rate over the entire range of rates required for pitch perception using an explicit temporal representation. To prevent the loss of information from a degraded temporal representation, temporal parameters such as repetition rate and temporal regularity must be re-encoded using the discharge rates of neurons. Using their discharge rate, pitch-selective neurons found within the putative pitch center of auditory cortex encode temporal regularity and repetition rate over the perceptual range of pitch (Figs. 11B and 14, C and D). In contrast, modulation sensitive neurons found throughout auditory cortex encode the average repetition rate of complex sounds but are generally insensitive to changes in temporal regularity (Fig. 14, C and D).
When a neuron is tuned to the repetition rate or fundamental frequency of a complex sound, can we consider this a sufficient criterion for a neural representation of pitch (Bizley et al. 2009; Kalluri et al. 2008)? In human subjects, pitch discrimination worsens when an acoustic stimulus is temporally jittered (Pollack 1968). Therefore if a neuronal population is insensitive to temporal regularity, it would provide a similar neural threshold for pitch discrimination of periodic and aperiodic acoustic stimuli; this does not correlate with the decrease in the perceptual threshold observed. Thus it is crucial to demonstrate that “pitch-selective” neurons are sensitive to temporal regularity.
The responses of pitch-selective neurons are correlated with several acoustic features that co-vary with pitch, namely repetition rate, fundamental frequency, and temporal regularity. However, because pitch is a percept rather than a physical sound property, it is important to measure how a subject's perception of pitch correlates with a neural response. To fully demonstrate the necessity of pitch-selective neurons for the encoding of pitch perception, a behavioral assay inactivating pitch-selective neurons would be required.
Implications for pitch-processing models
Given the complex nature of pitch perception, and the wide variety of acoustic stimuli that can generate a pitch percept, it is possible that regions of auditory cortex outside of the putative pitch center are required for pitch extraction. However, because firing rates were dependent on temporal regularity only in pitch-selective neurons and modulation sensitive neurons were not able to stimulus synchronize at high enough rates to encode the entire range of pitch perception, we must conclude that pitch-selective neurons do not rely on cortical inputs (outside of the pitch center) for their sensitivity to temporal regularity. The temporal-to-rate coding transformation representing temporal regularity likely happens in either the inferior colliculus or thalamus, which then serves as one of the primary inputs to pitch-selective neurons. Due to the putative pitch center's proximity to both the core and belt regions of auditory cortex (Fig. 9), it likely receives inputs from both the dorsal and ventral divisions of the medial geniculate body, and either one of these nuclei may provide periodicity information to pitch-selective neurons. Repetition rate (or modulation frequency) tuning in a subcortical nuclei that is based purely on a rate code is not sufficient for a pitch-processing model. As we have seen here, repetition rate tuning is a universal phenomenon throughout auditory cortex. However, repetition rate tuning that is dependent on temporal regularity generally occurs only within the putative pitch center. Identifying the neural representation of temporal regularity subcortically may provide the missing link between the representation of pitch in the periphery and at the level of auditory cortex.
The putative pitch center was located in the low frequency region of auditory cortex, bordering fields AI, R, and the lateral belt (Fig. 9), potentially a region anatomically homologous to lateral Heschl's gyrus in humans (Bendor and Wang 2006; Formisano et al. 2003; Hackett et al. 2001). Although pitch-selective neurons were more abundant in AI compared with field R, given that the size of AI is roughly double that of field R, the proportion of pitch-selective neurons found in each area were comparable. Unlike pitch-selective neurons, modulation sensitive neurons were found across the whole tonotopic range (Fig. 8, 9) which suggests that they play a more general role in temporal processing, as the pitch processing of missing fundamental sounds relies on harmonic frequencies below 5 kHz (Moore 2003; Oxenham et al. 2004). One prediction from these results is that the inactivation of the putative pitch center bilaterally would cause deficits in detecting changes in temporal regularity or pitch salience, but discrimination of average repetition rate would still be possible. However, the threshold for detecting changes in repetition rate is lower in acoustic signals with a high pitch salience (Pollack 1968), and so pitch-selective neurons may be more sensitive to changes in repetition rate than modulation sensitive neurons. Although repetition rate discrimination would be possible with the inactivation of the putative pitch center, the discrimination thresholds could be significantly higher. The slope of the tuning curve in positive monotonic modulation sensitive neurons is fairly constant up to ∼333 Hz (Fig. 4B), at which point it decreases. One possible consequence of this is that rate discrimination thresholds (when pitch is not involved) would worsen when the slope of the tuning curve decreases. This observation suggests a possible neural correlate for the limitation in rate discrimination in cochlear implantees (Baumann and Nobbe 2004; Shannon 1983; Zeng 2002). If pitch-selective neurons are not driven by cochlear implants, and the perception of repetition rate is due to only modulation sensitive neurons, rate-coding constraints could have a perceptual effect not observed in normal hearing subjects that have access to a working population of pitch-selective neurons. According to this hypothesis, the ability to discriminate the repetition rate of irregular acoustic pulse trains should be similar between cochlear implantees and normal hearing subjects as in this case, only the modulation sensitive population would be encoding the repetition rate of this stimulus.
One difficulty in using multiunit or hemodynamic responses to study pitch-selective neurons is the heterogeneous properties of neurons within the putative pitch center. Pitch-selective neurons only make up about 1/3 of the neurons in this region (Bendor and Wang 2005). If the responses of pitch-selective and modulation sensitive neurons in the putative pitch center are combined together (using techniques such as LFP or fMRI), the results can be difficult to interpret. The criteria used for pitch-selective neurons (Bendor and Wang 2005) are dependent on a single neuron's BF and sound level threshold and cannot be used if recording from a population of neurons. However, if distortion products are masked using noise, then a comparison between periodic and aperiodic acoustic pulse trains can provide a much more rapid identification of the putative pitch center. Due to the high pitch salience and matched spectral bandwidths of these acoustic stimuli, this is an optimal stimulus to use in LFP or fMRI based experiments.
Comparison with previous studies
We observed that mixed response neurons have a higher synchronization limit than reported for synchronizing cortical neurons (Lu et al. 2001) and a lower synchronization limit than synchronizing thalamic neurons (Bartlett and Wang 2007): median synchronization limit- current study mixed neurons: 100 Hz (25–75%, 48 Hz, 156 Hz); Lu et al. (2001), synchronizing neurons 46.9 Hz (25–75%, 18.4 Hz, 80.6 Hz); Bartlett and Wang (2007),thalamic synchronizing neurons 192 Hz (25–75%: 88–303 Hz). The majority of neurons in the auditory thalamus that can stimulus synchronize also have nonsynchronized responses at higher repetition rates, similar to the mixed response modulation sensitive neurons reported here (Bartlett and Wang 2007). As such, mixed response neurons may receive direct thalamic input and then project to both nonsynchronized and synchronized neurons within auditory cortex, acting as an intermediate stage in the temporal-to-rate coding transformation occurring between thalamus and cortex (Wang et al. 2008).
In addition to marmosets, nonsynchronized responses have also been reported in rats and cats (Anderson et al. 2006; Lu and Wang 2000; Sakai et al. 2009). Failure to observe nonsynchronized responses in auditory cortex (Malone et al. 2007) could be due to several issues including species differences, criteria of nonsynchronized responses, acoustic stimuli (sAM vs. narrowband click trains), and the use of anesthesia (Rennaker et al. 2007).
The positive monotonic responses we report here are different from those reported in flutter encoding neurons (Bendor and Wang 2007) for two reasons. First, they are encoding the range of repetition rates 30–500 Hz, within the range of pitch perception rather than the range of acoustic flutter perception (10–45 Hz). Second, roughly equal numbers of positive and negative monotonic responses were observed in flutter encoding neurons (Bendor and Wang 2007), while in this study the vast majority of monotonic response in modulation sensitive neurons were positive monotonic (increased their discharge rate with higher repetition rates). Nevertheless, neurons with monotonic and nonmonotonic tuning curves both likely play a role in encoding temporal information in the range of flutter and pitch perception.
Comparison with the somatosensory system
The need to encode temporal information is not unique to the auditory system, and similar neural coding strategies may also be utilized in other sensory systems. In the somatosensory system, Pacinian receptors in the periphery and Pacinian neurons in primary somatosensory cortex encode tactile vibration (50–400 Hz) at frequencies above the range of tactile flutter (Hyvarinen et al. 1968). Although stimulus synchronization exists at the periphery, Pacinian neurons in primary somatosensory cortex use a positive monotonic nonsynchronized rate code for vibration frequency (pulse repetition rate) similar to the majority of modulation sensitive neurons in this study (Hyvarinen et al. 1968). A similar neural coding strategy for temporal information may be used in primary auditory cortex and primary somatosensory cortex (Bendor and Wang 2007; Lemus et al. 2009; Romo and Salinas 2003). Slowly repeated stimuli, perceived as a stream of discretely occurring sensory events (acoustic or tactile flutter), are encoded by stimulus synchronization across one neuronal population. Faster repetition rates, perceived as a stream of fused sensory events (pitch or vibration), are encoded by a nonsynchronized positive monotonic rate code within a second neuronal population. Thus the change in perception from flutter to fusion may be the direct consequence of the lack of stimulus synchronization in the neuronal population at higher repetition rates. The upper limit of this positive monotonic rate code is where it is no longer monotonic (saturation of the tuning curve), which based on this model would correspond to the upper limit of rate discrimination in each modality. Although we refer to the fused auditory sensation of repetition rate here as pitch, we should point out that a fused percept can still be perceived when an acoustic signal has no pitch salience (e.g., an irregular click train with an average repetition rate of 200 Hz). Unlike pitch perception, which has a fine grain discrimination of repetition rate allowing for octave perception and recognition of melodies and harmonies, modulation sensitive neurons may instead be representing the acoustic perceptual equivalent of roughness or tactile vibration. Thus we suggest that flutter and vibration share similar perceptual ranges and neural coding strategies in both the auditory and somatosensory system. However, the perception of pitch and the sensitive encoding of periodicity by cortical neurons is unique to the auditory system.
GRANTS
This work was supported by National Institute of Deafness and Other Communication Disorders Grants DC-03180 to X. Wang and F31 DC-006528 to D. Bender and a Helen Hay Whitney Postdoctoral Fellowship D. Bender.
ACKNOWLEDGMENTS
We thank A. Pistorio, J. Estes, E. Issa, E. Bartlett, and Y. Zhou for assistance with animal care.
REFERENCES
- Anderson SE, Kilgard MP, Sloan AM, Rennaker RL. Response to broadband repetitive stimuli in auditory cortex of the unanesthetized rat. Hear Res 213: 107–117, 2006 [DOI] [PubMed] [Google Scholar]
- Bartlett EL, Wang X. Neural representations of temporally modulated signals in the auditory thalamus of awake primates. J Neurophysiol 97: 1005–1017, 2007 [DOI] [PubMed] [Google Scholar]
- Baumann U, Nobbe A. Pulse rate discrimination with deeply inserted electrode arrays. Hear Res 196: 49–57, 2004 [DOI] [PubMed] [Google Scholar]
- Bendor D, Wang X. The neuronal representation of pitch in primate auditory cortex. Nature 436: 1161–1165, 2005 [DOI] [PMC free article] [PubMed] [Google Scholar]
- Bendor D, Wang X. Cortical representations of pitch in monkeys and humans. Curr Opin Neurobiol 16: 391–399, 2006 [DOI] [PMC free article] [PubMed] [Google Scholar]
- Bendor D, Wang X. Differential neural coding of acoustic flutter within primate auditory cortex. Nat Neurosci 10: 763–771, 2007 [DOI] [PubMed] [Google Scholar]
- Bendor D, Wang X. Neural response properties of primary, rostral, and rostrotemporal core fields in the auditory cortex of marmoset monkeys. J Neurophysio 100: 888–906, 2008 [DOI] [PMC free article] [PubMed] [Google Scholar]
- Besser GM. Some physiological characteristics of auditory flutter fusion in man. Nature 214: 17–19, 1967 [DOI] [PubMed] [Google Scholar]
- Bizley JK, Walker KM, Silverman BW, King AJ, Schnupp JW. Interdependent encoding of pitch, timbre, and spatial location in auditory cortex. J Neurosci 29: 2064–2075, 2009 [DOI] [PMC free article] [PubMed] [Google Scholar]
- DiMattina C, Wang X. Virtual vocalization stimuli for investigating neural representations of species-specific vocalizations. J Neurophysiol 95: 1244–1262, 2006 [DOI] [PubMed] [Google Scholar]
- Eggermont JJ. Representation of spectral and temporal sound features in three cortical fields of the cat. Similarities outweigh differences. J Neurophysiol 80: 2743–2764, 1998 [DOI] [PubMed] [Google Scholar]
- Formisano E, Kim DS, Di Salle F, van de Moortele PF, Ugurbil K, Goebel R. Mirror-symmetric tonotopic maps in human primary auditory cortex. Neuron 40: 859–869, 2003 [DOI] [PubMed] [Google Scholar]
- Gaese BH, Ostwald J. Temporal coding of amplitude and frequency modulation in the rat auditory cortex. Eur J Neurosci 7: 438–450, 1995 [DOI] [PubMed] [Google Scholar]
- Hackett TA, Preuss TM, Kaas JH. Architectonic identification of the core region in auditory cortex of macaques, chimpanzees, and humans. J Comp Neurol 441: 197–222, 2001 [DOI] [PubMed] [Google Scholar]
- Hyvarinen J, Sakata H, Talbot WH, Mountcastle VB. Neuronal coding by cortical cells of the frequency of oscillating peripheral stimuli. Science 162: 1130–1132, 1968 [DOI] [PubMed] [Google Scholar]
- Johnson DH. The relationship between spike rate and synchrony in responses of auditory-nerve fibers to single tones. J Acoust Soc Am 68: 1115–1122, 1980 [DOI] [PubMed] [Google Scholar]
- Joris PX, Schreiner CE, Rees A. Neural processing of amplitude-modulated sounds. Physiol Rev 84: 541–577, 2004 [DOI] [PubMed] [Google Scholar]
- Kaas JH, Hackett TA. Subdivisions of auditory cortex and processing streams in primates. Proc Natl Acad Sci USA 97: 11793–11799, 2000 [DOI] [PMC free article] [PubMed] [Google Scholar]
- Kaernbach C, Demany L. Psychophysical evidence against the autocorrelation theory of auditory temporal processing. J Acoust Soc Am 104: 2298–2306, 1998 [DOI] [PubMed] [Google Scholar]
- Kalluri S, Depireux DA, Shamma SA. Perception and cortical neural coding of harmonic fusion in ferrets. J Acoust Soc Am 123: 2701–2716, 2008 [DOI] [PMC free article] [PubMed] [Google Scholar]
- Krumbholz K, Patterson RD, Pressnitzer D. The lower limit of pitch as determined by rate discrimination. J Acoust Soc Am 108: 1170–1180, 2000 [DOI] [PubMed] [Google Scholar]
- Lemus L, Hernández A, Romo R. Neural codes for perceptual discrimination of acoustic flutter in the primate auditory cortex. Proc Natl Acad Sci USA 106: 9471–9476, 2009 [DOI] [PMC free article] [PubMed] [Google Scholar]
- Lu T, Liang L, Wang X. Temporal and rate representations of time-varying signals in the auditory cortex of awake primates. Nat Neurosci 4: 1131–1138, 2001 [DOI] [PubMed] [Google Scholar]
- Lu T, Wang X. Temporal discharge patterns evoked by rapid sequences of wide- and narrowband clicks in the primary auditory cortex of cat. J Neurophysiol 84: 236–246, 2000 [DOI] [PubMed] [Google Scholar]
- Lu T, Wang X. Information content of auditory cortical responses to time-varying acoustic stimuli. J Neurophysiol 91: 301–313, 2004 [DOI] [PubMed] [Google Scholar]
- Malone BJ, Scott BH, Semple MN. Dynamic amplitude coding in the auditory cortex of awake rhesus macaques. J Neurophysiol 98: 1451–1474, 2007 [DOI] [PubMed] [Google Scholar]
- Mardia KV, Jupp P E. Directional Statistics New York: Wiley, 2000 [Google Scholar]
- Miller GA, Taylor WG. The perception of repeated bursts of noise. J Acoust Soc Am 20: 171–182, 1948 [Google Scholar]
- Moore BC. An Introduction to the Psychology of Hearing London: Academic, 2003 [Google Scholar]
- Morel A, Kaas JH. Subdivisions and connections of auditory cortex in owl monkeys. J Comp Neurol 318: 27–63, 1992 [DOI] [PubMed] [Google Scholar]
- Oxenham AJ, Bernstein JG, Penagos H. Correct tonotopic representation is necessary for complex pitch perception. Proc Natl Acad Sci USA 101: 1421–1425, 2004 [DOI] [PMC free article] [PubMed] [Google Scholar]
- Patterson RD, Handel S, Yost WA, Datta AJ. The relative strength of the tone and noise components in iterated rippled noise. J Acoust Soc Am 98: 1355–1364, 1996 [Google Scholar]
- Patterson RD, Uppenkamp S, Johnsrude IS, Griffiths TD. The processing of temporal pitch and melody information in auditory cortex. Neuron 36: 767–776, 2002 [DOI] [PubMed] [Google Scholar]
- Penagos H, Melcher JR, Oxenham AJ. A neural representation of pitch salience in nonprimary human auditory cortex revealed with functional magnetic resonance imaging. J Neurosci 24: 6810–6815, 2004 [DOI] [PMC free article] [PubMed] [Google Scholar]
- Petkov CI, Kayser C, Augath M, Logothetis NK. Functional imaging reveals numerous fields in the monkey auditory cortex. PLoS Biol 4: e215, 2006 [DOI] [PMC free article] [PubMed] [Google Scholar]
- Phan ML, Recanzone GH. Single-neuron responses to rapidly presented temporal sequences in the primary auditory cortex of the awake macaque monkey. J Neurophysiol 97: 1726–1737, 2007 [DOI] [PubMed] [Google Scholar]
- Plack CJ, Oxenham AJ, Fay RR, Popper AN. Pitch: neural coding and perception. Springer Handbook of Auditory Research, 2005 [Google Scholar]
- Pollack I. Discrimination of mean temporal interval within jittered auditory pulse trains. J Acoust Soc Am 43: 1107–1112, 1968 [DOI] [PubMed] [Google Scholar]
- Pressnitzer D, Patterson RD. Distortion products and the perceived pitch of harmonic complex tones. In: Physiological and Psychophysical Bases of Auditory Function, edited by Breebart DJ, Houtsma AJM, Kohlrausch A, Prijs VF, Schoonoven R. Maastricht, The Netherlands: Shaker Publishing BV; 2001, p. 97–104 [Google Scholar]
- Rennaker RL, Carey HL, Anderson SE, Sloan AM, Kilgard MP. Anesthesia suppresses nonsynchronous responses to repetitive broadband stimuli. Neuroscience 145: 357–369, 2007 [DOI] [PubMed] [Google Scholar]
- Ritsma RJ. Existence region of the tonal residue. I J Acoust Soc Am 24: 1224–1229, 1962 [Google Scholar]
- Romo R, Salinas E. Flutter discrimination: neural codes, perception, memory and decision making. Nat Rev Neurosci 4: 203–218, 2003 [DOI] [PubMed] [Google Scholar]
- Rosen S. Temporal information in speech: acoustic, auditory and linguistic aspects. Philos Trans R Soc Lond B Biol Sci 336: 367–373, 1992 [DOI] [PubMed] [Google Scholar]
- Sakai M, Chimoto S, Qin L, Sato Y. Neural mechanisms of interstimulus interval-dependent responses in the primary auditory cortex of awake cats. BMC Neurosci 10: 10, 2009 [DOI] [PMC free article] [PubMed] [Google Scholar]
- Schneider P, Sluming V, Roberts N, Scherg M, Goebel R, Specht HJ, Dosch HG, Bleeck S, Stippich C, Rupp A. Structural and functional asymmetry of lateral Heschl's gyrus reflects pitch perception preference. Nat Neurosci 8: 1241–1247, 2005 [DOI] [PubMed] [Google Scholar]
- Schönwiesner M, Zatorre RJ. Depth electrode recordings show double dissociation between pitch processing in lateral Heschl's gyrus and sound onset processing in medial Heschl's gyrus. Exp Brain Res 187: 97–105, 2008 [DOI] [PubMed] [Google Scholar]
- Schreiner CE, Urbas JV. Representation of amplitude modulation in the auditory cortex of the cat. II. Comparison between cortical fields. Hear Res 32: 49–63, 1988 [DOI] [PubMed] [Google Scholar]
- Schroeder MR, Strube HW. Flat-spectrum speech. J Acoust Soc Am 79: 1580–1583, 1986 [DOI] [PubMed] [Google Scholar]
- Shannon R. Multichannel electrical stimulation of the auditory nerve in man. I. Basic psychophysics. Hear Res 11: 157–189, 1983 [DOI] [PubMed] [Google Scholar]
- Singh NC, Theunissen FE. Modulation spectra of natural sounds and ethological theories of auditory processing. J Acoust Soc Am . 114: 3394–3411, 2003 [DOI] [PubMed] [Google Scholar]
- Suga N. Processing of auditory information carried by species-specific complex sounds. In: The Cognitive Neurosciences, edited by Gazzanica MS. Cambridge, MA: MIT Press, 1994, p. 295–313 [Google Scholar]
- Wallace MN, Shackleton TM, Palmer AR. Phase-locked responses to pure tones in the primary auditory cortex. Hear Res 172: 160–171, 2002 [DOI] [PubMed] [Google Scholar]
- Wang X, Lu T, Liang L. Cortical processing of temporal modulations. Speech Commun 41: 107–121, 2003 [Google Scholar]
- Wang X, Lu T, Bendor D, Bartlett E. Neural coding of temporal information in auditory thalamus and cortex. Neuroscience 157: 484–494, 2008 [DOI] [PubMed] [Google Scholar]
- Wang X, Lu T, Snider RK, Liang L. Sustained firing in auditory cortex evoked by preferred stimuli. Nature 435: 341–346, 2005 [DOI] [PubMed] [Google Scholar]
- Yost WA, Mapes-Riordan D, Shofner W, Dye R, Sheft S. Pitch strength of regular-interval click trains with different length “runs” of regular intervals. J Acoust Soc Am 117: 3054–3068, 2005 [DOI] [PMC free article] [PubMed] [Google Scholar]
- Yost WA, Patterson RD, Sheft S. A time domain description for the pitch strength of iterated rippled noise. J Acoust Soc Am 99: 1066–1078, 1996 [DOI] [PubMed] [Google Scholar]
- Zeng FG. Temporal pitch in electric hearing. Hear Res 174: 101–106, 2002 [DOI] [PubMed] [Google Scholar]


