

Abstract
The cercal sensory system of crickets mediates sensitivity to low-amplitude air currents. The sense organ for this system is a pair of antenna-like abdominal appendages called cerci, each of which is about 1 cm long in normal adult crickets. Although this system has been used extensively as a model system for studying the mechanisms underlying neural coding at the cellular and system levels, no previous studies have considered the functional significance of the physical dimensions of cerci. We show that the differential conduction characteristics of the receptor array in Acheta domesticus crickets are of substantial significance. All filiform sensory afferent axons we examined had the same propagation speeds to within a small variance, resulting in a significant and systematic differential propagation time for spikes from sensory receptors at different locations along the structure. Thus the sensory structures operate as delay lines. The delay-line structure supports neural computations in many of the projecting cercal interneurons (INs) that yield substantial differential sensitivity to the direction and velocity of naturalistic stimuli. Several INs show delay-line-derived sensitivities that are equivalent, in an engineering sense, to “notch filtering,” through which background noise is selectively eliminated by the delay-line-based processing.
INTRODUCTION
The cercal sensory system of the cricket functions as a low-frequency, near-field extension of the animal's auditory system and encodes information about the direction and dynamic properties of low-velocity air currents with great accuracy and precision. This system has been shown to be of critical importance for a variety of behaviors, from oriented escape responses to mate location (Jacobs et al. 2008). The sense organ for this system consists of a pair of antenna-like appendages called cerci at the rear of the cricket's abdomen. In Acheta domesticus, each cercus is about 1 cm long in a normal adult cricket and is covered with about 750 filiform mechanosensory hairs (Palka et al. 1977). Different filiform hairs have different directional and frequency sensitivities, which are determined by the structure, length, and location of the hairs on the cercus (Edwards and Palka 1974; Landolfa and Jacobs 1995; Shimozawa and Kanou 1984). Each hair is innervated by a single spike-generating mechanosensory receptor neuron (Edwards and Palka 1974) and the afferent axons of the entire ensemble of hairs project into the terminal abdominal ganglion (TAG) to form a continuous internal representation of air-current parameters (Bacon and Murphey 1984; Jacobs and Theunissen 1996). The goals of our study were 1) to determine whether the distribution of receptor hairs out along the length of the cerci leads to temporal dispersion of the receptors' spike trains on entry into the TAG and 2) to investigate the functional significance of any observed dispersion.
The cercal system has been the subject of many anatomical, developmental, functional, and theoretical studies over the last 35 yr. All but a few of the neurophysiological and theoretical studies have been based on experiments using “bulk-flow” air-current stimuli, i.e., stimuli that simultaneously activate all filiform hairs along the entire length of the cerci. Such experimental stimuli are typically generated by the movement of loudspeaker cones placed in close proximity to the specimens: movement of the speakers results in the displacement of a block of air around the cricket's cerci that is much larger than the scale of the cerci themselves. Large-scale bulk airflow would occur naturally during the animal's own self-movement or as typical background “noise” in the environment. However, many (perhaps most) behaviorally relevant stimuli would be expected to have spatial structure at a smaller scale than that of the characteristic scale of the cerci. Examples of such stimuli include discrete air-current wavefronts that sweep along the cerci (Comer et al. 1994; Gnatzy and Heusslein 1986; Gnatzy and Kamper 1990; Magal et al. 2006) and small recirculating vortex-like stimuli that would impose different directional forcing vectors simultaneously and/or sequentially at different positions along the cerci (Heinzel et al. 1987; Kamper et al. 1981). Studies by Casas, Dangles, and colleagues (Casas et al. 2008; Dangles et al. 2006, 2009; Magal et al. 2006) over the last few years have characterized, with great accuracy and precision, the small-scale spatiotemporal structure of the dynamic air currents generated by predatory spiders during attacks on crickets and have also demonstrated the importance of using behaviorally relevant stimuli in neuroethological studies.
Despite the recognized importance of using ethologically relevant stimuli, to the best of our knowledge none of the theoretical or modeling studies of the cercal system interneuron stimulus–response properties has taken differential conduction delay along the cercus into account and thus may have significantly misinterpreted the response characteristics of the cercal interneurons.
The first goal of the studies reported here was to determine whether there is any differential propagation time for spikes from filiform receptors at different locations along the length of a typical adult cercus. The second goal was to determine the functional significance of the extended distribution of filiform receptors, as judged by observing the differential responses of primary sensory interneurons to simultaneous versus sequential activation of the cercal filiform receptor array. As we will demonstrate, the differential conduction characteristics of the filiform receptor array are, in fact, of substantial significance. All filiform afferent axons have the same propagation speeds to within a very small variance, resulting in a significant dispersion of the spikes generated by bulk air movements. Using an air-current stimulus device capable of generating sequences of air jets along a single cercus, we demonstrate that the cerci operate as delay lines and support neural computations in many of the projecting cercal interneurons (INs) that yield substantial differential sensitivity to the direction and velocity of these more complex stimuli. We demonstrate that several cercal INs show much greater sensitivity to stimuli that sweep along the cerci than they do to bulk airflow stimuli, functioning as “notch filters” with selective insensitivity to bulk-flow stimuli.
METHODS
Dissection, specimen preparation, and electrophysiological recording
All experiments were performed on adult female Acheta domesticus crickets, obtained from Bassett's Cricket Ranch (Visalia, CA). Each cricket specimen was selected within 4 h following the final molt and anesthetized by placement on ice until it ceased to show escape behavior when touched. The legs and wings were removed. Subsequent stages of the specimen preparation depended on the specific experimental protocols to be used. All recordings were made at room temperature.
MEASUREMENT OF SENSORY AFFERENT AXONAL CONDUCTION TIMES.
Measurements of filiform afferent spike propagation speed required simultaneous recordings of afferent spikes at two different locations: one out along a cercus and one from the cercal nerve at the base of the cercus. For these experiments, a 3 × 8-mm section of dorsal cuticle was removed. Digestive, reproductive, and superficial fat tissues were removed along with the ovipositor. The abdominal cavity was filled with isotonic saline solution (O'Shea and Adams 1981) and perfused periodically. The preparation was pinned to a plate of silicone elastomer. To achieve mechanical stability for durations of ≤2 h, movements of the cerci were constrained by gluing each cercus to the silicone elastomer with marine epoxy. The entire plate-mounted preparation was placed on a vibration isolation table in a laminar air-current chamber. A set of filiform hairs to be studied was identified using a stereo dissecting microscope and the surrounding hairs were plucked out with fine forceps to provide access for the placement of tungsten electrodes and to reduce extraneous action potentials from nearby hairs. For control purposes, several measurements were taken from animals without plucking hairs and without epoxy applications to the distal cercus. Measurements from these animals were statistically indistinguishable from those taken with the standard protocols described earlier. Data from these control measurements were included in the subsequent analysis.
To record from sensory afferent axons in the cercus, two matched-impedance tungsten electrodes (FHC, Bowdoinham, ME) were used: one as the recording electrode and one as the indifferent electrode. The tip of the recording electrode was inserted just below the cuticle and just proximal to the base of a filiform hair. The indifferent electrode was placed on the cuticle a small distance from the recording electrode. The two electrodes were attached to the inputs of a Data model 2124 differential amplifier (Fort Collins, CO) and signals were amplified at a gain of ×300–1,800 and band-passed between 100 and 10,000 Hz.
To achieve simultaneous recordings from the same afferent axons in the cercal nerve, ensemble spiking activity through the entire cercal nerve was recorded near its exit point from the cercus using a glass suction electrode in the en passant configuration. The electrode was filled with standard isotonic saline and isolated from the intraabdominal bath with petroleum jelly. The suction electrode was connected to a differential amplifier (Data model 2124) grounded to the abdominal saline bath. Signals were amplified at ×300 and band-passed between 100 and 10,000 Hz.
Spikes recorded from the tungsten pair were used for spike-triggered averaging of activity through the cercal nerve suction electrode recordings. The averaging was carried out off-line after the experiment, using custom software based on Matlab v7.3. For the experiments requiring calculation of the spike propagation times, variation in proximal electrode placement and cercal nerve stretch was corrected for by removing the ordinate intercept value from each animal such that a hair 0 mm from the base would show 0 ms of latency.
RECORDING FROM SENSORY INTERNEURON AXONS IN THE ABDOMINAL NERVE CORD.
Some experiments required multichannel, multiunit extracellular recordings from the abdominal nerve cord between the TAG and the thoracic ganglia. To enable these recordings, the preparation was dissected beyond the minimal levels described earlier. After removal of the head and the digestive, reproductive, and superficial fat tissues from the abdominal cavity, the specimen was pinned out on silicone elastomer. The entire nerve cord was then surgically isolated from all connections to the remainder of the body by cutting all peripheral nerves, trachaea, and connective tissue between the TAG and the prothoracic ganglion. All of the animal's body was cut away and discarded except for the abdominal nerve cord, including all thoracic ganglia, all abdominal ganglia, the cercal nerves, the body walls of the posterior half of the abdomen (split along the dorsal and ventral midlines to the level of the cuticular cap at the posterior end of the abdomen), and the two cerci with all sensory hairs intact.
For a subset of these experiments, we reduced the filiform mechanosensor array by plucking out all of the filiform hairs on a cercus except those on the lateral and medial sides. This procedure eliminated all hairs that were activated by air currents oriented transversely or obliquely to the long axis of the cercus, leaving only those hairs activated by air currents directly in line with the cercus. This procedure was done to control for the possibility that turbulence surrounding the air jets generated by the air-current nozzles was resulting in variable activation of transverse hairs, thus confounding interpretation of the stimulus–response variability. IN stimulus–response characteristics from preparations having these reduced sensory arrays yielded results that were qualitatively and quantitatively similar to those obtained from preparations with full, unmodified sensory arrays.
The reduced preparation was transferred to a specially constructed platform and perfused periodically with isotonic saline. The platform, which was constructed to have a physical profile approximating the body shape of an adult cricket, enabled placement of the two cerci in a manner that was equivalent to their configuration on a freely behaving animal, i.e., elevated at 15° from the horizontal plane and at an angular separation of 60° (Landolfa and Jacobs 1995). A mounted preparation is shown in Fig. 1A. After the preparation was stabilized on the perfusion platform, the right connective of the abdominal nerve cord was cut at a point midway between the terminal ganglion and next most anterior ganglion. This left only the projecting axons in the left connective intact, which greatly simplified the subsequent tasks of cell identification and analysis from the multiunit recordings.
Fig. 1.

Multinozzle air-current stimulus device. A: photograph of the multinozzle stimulus device, positioned over a cricket cercus as in the actual experimental preparations. B: plot of the air currents generated through a single nozzle, recorded with the MicroFlown positioned at 5 different distances from the nozzle tip. The top trace is the voltage signal sent to the minispeaker connected to the nozzle and the bottom 5 traces are plots of air current velocity vs. time at the different indicated distances between the nozzle tip and MicroFlown sensor.
The array of extracellular electrodes consisted of a set of eight insulated stainless steel wires (0.005-in. heavy polyimide enamel [HML] coated, California Fine Wire, Grover Beach, CA) integrated into the preparation chamber and a ninth uninsulated silver wire that served as a common (grounded) reference electrode. These eight wires were placed across the top of the preparation chamber, perpendicular to the long (“body”) axis, at an interwire spacing of about 1 mm. Each of the eight transverse wires had a small patch of the HML insulator removed along the center axis of the chamber, to function as the point of electrical contact with the abdominal nerve cord. At the beginning of each experiment, the nerve cord was positioned to extend across the uninsulated patches of the eight-electrode array and shielded from the bath with a mixture of 70% petroleum jelly and 30% mineral oil. The right hemiconnective was then cut between the terminal ganglion and the next most anterior ganglion, so that the axons from only 10 of the 20 projecting interneurons were recorded. The entire preparation was placed into a laminar air-current chamber on a vibration isolation table. The leads from the eight electrodes and common reference electrode were attached to a bank of differential amplifiers constructed in our laboratory and signals were amplified at a gain of ×1,000–2,000 and band-passed between 100 and 10,000 Hz.
Spike trains from all eight recording electrodes plus records of all stimulus waveform channels were digitally sampled at 40 kHz (DataMAX, RC Electronics, Santa Barbara, CA) and stored for subsequent analysis. Signals were also monitored simultaneously on a digital oscilloscope. Spike discrimination was accomplished using the phased-array spike discrimination technique described in detail elsewhere (Huang and Miller 2004), as implemented in the general-purpose data analysis program suite MIEN (http://mien.msu.montana.edu).
Air-Current stimulus generation
A device was used to generate independent air-current jets at four different positions along a single cercus. The device, shown in Fig. 1A, consisted of four small-diameter stainless steel nozzles (1-in. lengths of 18-gauge hypodermic syringe needles) connected to a corresponding set of four microspeakers of the type used in headphones (RadioShack 273092), via 3-in. lengths of small-diameter Tygon tubing. Movement of a single microspeaker cone drove air through the corresponding nozzle. Coordinated control of the four microspeakers with a four-channel computer-controlled signal generator (National Instruments) enabled the generation of arbitrarily complex sequences of air currents through the four nozzles. For each experiment, the tips of the four tubes were adjusted to direct air currents at four equally spaced positions along a single cercus, from a distance of 1.5 mm above the cercus. Note that the nozzles are at a shallow angle over the cercus, so that the air jets have a substantial projection onto the horizontal plane along the major axis of the cercus. It is the horizontal component that drives these filiform hairs. We verified that the stimuli were driving the hairs in the horizontal plane, by observing the movements of the hairs through the dissecting microscope. Additionally, plucking out hairs with preferred planes of motion transverse to the long axis of the cercus did not alter the observed firing of cercal INs. This suggests that it was primarily the longitudinal hairs that were stimulated in our experiments.
For the experiments we report here, the individual stimulus waveforms sent to each speaker were unidirectional jets. The waveform of each jet was constructed to present approximately a half-cosine wave (i.e., a positive-velocity air displacement with no discontinuities at the beginning and termination). Air velocities and waveforms were measured using a low-velocity air-current sensor (Titan sensor, MicroFlown Technologies, Zevenaar, The Netherlands), placed 1.5 mm from the nozzle. Example measurements, shown in Fig. 1B, confirmed that the half-period cosine wave produced primarily an outward going “puff” without significant rebounding airflow.
For all experiments shown here, the peak velocity of the air puffs was set to values measured to be in the range from 2 to 7 mm/s at the target location on the cercus. For each experiment, the air velocity was adjusted to be just suprathreshold for generation of a reliable neurophysiologically measured response. We chose to use this “just suprathreshold” criterion for several reasons. First, this was a very straightforward criterion to achieve across different preparations: the amplitude of the stimuli could be increased from a very low setting until the same stereotypical responses were obtained. Second, this least-reliable stimulus ensured minimal rebound of the hairs directly in line with the jet nozzles (which would have added subsequent bursts of spikes on the “bounce” after rebound) and minimal stimulation of hairs having different movement directions (due to turbulence from vortex shedding from the jet). We note that these stimuli, which were just suprathreshold for eliciting reliable responses, were actually well above the absolute threshold for the afferents. In experiments corresponding to Figs. 4 and 5, each of the four jets was reliably activating a relatively small patch of hairs on the cercus and so the “threshold” air currents were activating enough hairs in four different patches to get a reliable compound action potential in the nerve and/or reliable responses from the INs.
Fig. 4.
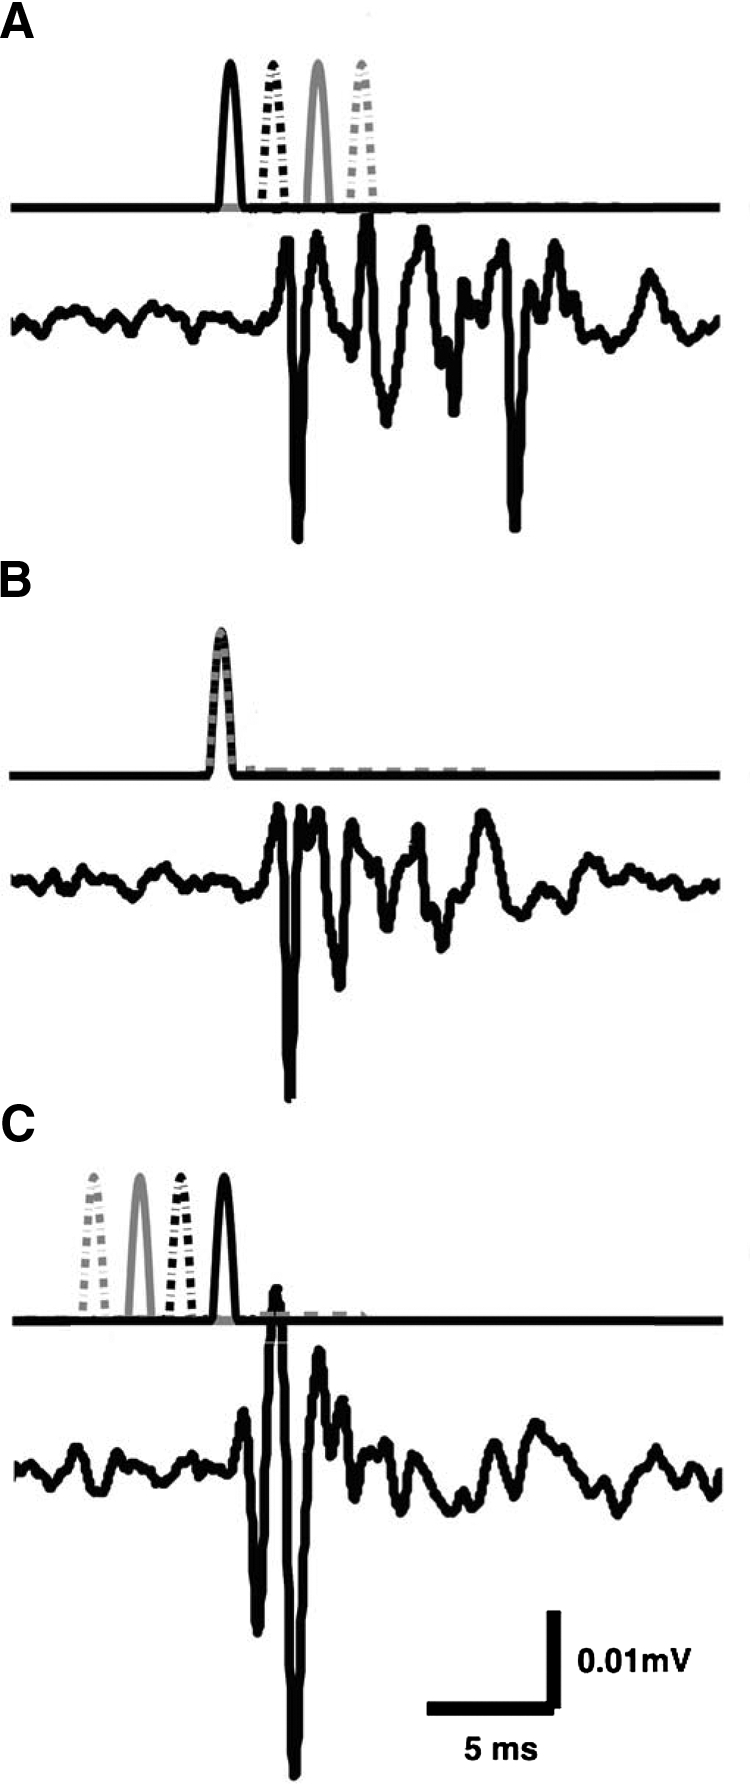
Dispersion of the ensemble response of the filiform sensory afferent array. In each panel, the top trace plots the stimulus waveforms driving 4 independent air jets through 4 nozzles aligned along a cercus. Each jet was a unidirectional half-cosine waveform of duration 1.25 ms, adjusted in amplitude to be just suprathreshold for elicitation of spikes as observed on the extracellular electrode at the base of the cercal nerve. The waveform for each nozzle is shown with a different line type: the solid black line is for the first nozzle at the base of the cercus, the dashed black line is for the second nozzle 3.3 mm out from the base, the solid gray line is for the third nozzle 6.7 mm out from the base, and the dashed gray line is for the fourth nozzle at the distal tip of the cercus. Note that in A and C, the puffs were separated in time and were therefore separable on the top traces. In B the puffs were presented simultaneously and were therefore superimposed. The bottom trace in each panel shows the average of 200 cercal nerve responses to repeated presentations of the corresponding stimulus sequence. A: average ensemble response of the cercal nerve to a stimulus sequence that started at the base of a cercus and swept toward the tip of the cercus, i.e., opposite to the direction of spike propagation along the cercus, with base-to-tip delay of 5 ms. B: average ensemble response of the cercal nerve to a stimulus in which all 4 positions along the cercus were activated simultaneously. C: average ensemble response of the cercal nerve to a stimulus sequence that started at the tip of a cercus and swept toward the base of the cercus, i.e., in the direction of spike propagation along the cercus, with tip-to-base delay of 5 ms.
Fig. 5.

Response of projecting interneurons (INs) to stimulus jet sequences along the cercus. In each of the 3 panels, the top trace plots the stimulus waveforms driving 4 independent air jets through 4 independent nozzles aligned along a cercus. Each jet was a unidirectional half-cosine waveform of duration 1.25 ms, adjusted to the same amplitude as used for Fig. 4. The waveform for each nozzle is shown with a different line type. As in Fig. 4, the solid black line is for the first nozzle at the base of the cercus, the dashed black line is for the second nozzle 3.3 mm out from the base, the solid gray line is for the third nozzle 6.7 mm out from the base, and the dashed gray line is for the fourth nozzle at the distal tip of the cercus. Below each stimulus trace are raw electrophysiological recordings from 3 of the 5 extracellular electrodes placed along the abdominal nerve cord during presentation of that stimulus sequence. The top traces are from the electrode closest to the TAG and the bottom traces are from the electrode farthest from the TAG. Segments of these traces are color-coded for 3 of the 14 different units that were discriminated. Below each set of recordings is a raster plot showing the stimulus-elicited spike occurrence times for the 3 different color-coded INs elicited by 50 repeated stimulus presentations. The bottom plot for each panel is a histogram (with 2-ms time bins) for the occurrence times of spikes elicited from these 3 different cells. A: IN responses to stimulus sequences that started at the base of a cercus and swept toward the tip of the cercus, i.e., opposite to the direction of spike propagation along the cercus, with base-to-tip delay of 5 ms. B: IN responses to stimuli in which all 4 positions along the cercus were activated simultaneously. C: IN responses to stimulus sequences that started at the tip of a cercus and swept toward the base of the cercus, i.e., in the direction of spike propagation along the cercus, with tip-to-base delay of 5 ms.
The MicroFlown was used to verify that the air-current velocity fell to <10% of the peak velocity at a distance away from the axis of the nozzle equal to the internozzle spacing. This ensured that filiform afferents in adjacent regions were not stimulated. This was verified by visual inspection under the microscope: during a single puff from an individual nozzle, only the filiform hairs directly below the center of the nozzle could be seen to move and there was no perceptible movement of any hairs at a distance greater than the diameter of the nozzle.
Three different classes of puff sequences were used. The first class was a control stimulus, in which all four positions along the cercus were activated simultaneously. This set was equivalent to a uniform bulk air displacement, similar to those that have been used in all previous studies that used standard loudspeakers to generate bulk airflow over an entire cricket specimen. The second stimulus class was a sequence that started at the tip of a cercus and swept toward the base of the cercus. The third class was a sequence that swept in the opposite direction: from base to tip. The speed of the moving sequences were varied by changing the intervals between the individual puffs. For the experiments reported here stimuli were presented every 500 ms with the direction and velocity of sweep randomized.
We note that the nozzles were positioned and aligned with the cercus in a manner that resulted primarily in the deflection of the “longitudinal” hairs, i.e., those hairs located on the lateral and medial aspects of the cercus that have movement axes in line with the long axis of the cercus. The “transverse” hairs located on the dorsal and ventral aspects of the cercus have movement axes that were perpendicular to the direction of the air jets and, when present, were minimally activated by the jets (as determined by visual inspection).
RESULTS
Spike conduction latencies for sensory afferent axons in the cerci
We measured the action potential conduction speeds for a sample of 23 sensory afferents from filiform mechanosensory hairs on cerci from six different crickets. The filiform hairs innervated by this sample of afferents were located on the dorsal cercal surface, had movement axes that were perpendicular to the cercal axis, and ranged in length from 500 to 1,200 μm. For each hair we studied, simultaneous recordings at two different sites were obtained from the sensory afferent axon that innervated the hair. The first recording site was on the cercal nerve at the base of the cercus and the second recording site was out along the cercus, at a distance from the base that ranged from roughly 15 to 80% of the entire cercal length for the different hairs in our sample set. For each hair we studied, the distance between the distal recording site and the base of the cercus was measured from a digital micrograph taken through a stereo dissecting microscope during the experiment. Figure 2 shows a typical data set from a single filiform afferent, resulting from spike-triggered averaging of about 1,000 samples. The top trace is an average of the largest unit recorded from the tungsten electrode at the base of the hair. The individual spikes recorded at this tungsten electrode were used as the trigger for averaging the activity recorded through the suction electrode at the base of the cercus, shown in the bottom trace. The propagation time was measured as the time between the peak in the distal trace and the first peak in the averaged proximal traces. Later peaks in the proximal trace were found not to respond to air-current stimuli and were ignored. These later peaks were due, presumably, to activity of the hairs in response to the uncontrolled background air currents in the experimental chamber and/or to subsequent spikes elicited by rebound of the hairs to the air-current stimuli.
Fig. 2.
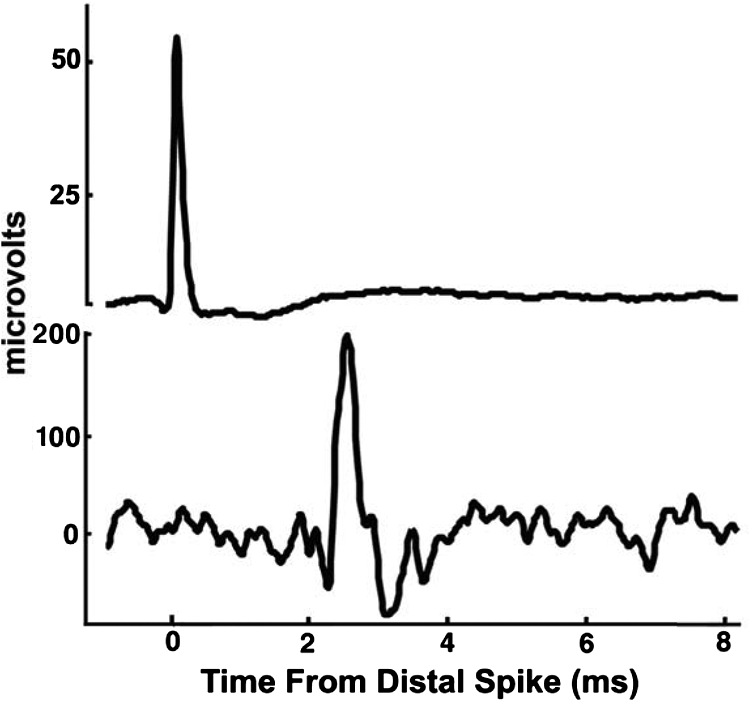
Spike-triggered averages of recordings from one filiform sensory afferent axon. The top trace is averaged from roughly 1,000 recordings from a distal tungsten electrode at the base of a hair. The bottom trace is an average of the corresponding traces recorded simultaneously from the proximal suction electrode on the cercal nerve near the terminal abdominal ganglion (TAG).
Each point on the graph in Fig. 3 corresponds to a measurement of the spike propagation latency between the distal recording site and the base of the cercus for a single afferent axon, plotted against the distance between these two sites. The dashed line is the best-fit linear regression through the data pooled across all samples. The slope of the regression line corresponds to an axonal spike propagation speed of 1.87 ± 0.09 mm/ms (R2 = 0.96, P < 0.001). There were no significant differences in conduction speeds within this sample of 23 measurements, either within or between animals, between different hair lengths, or between different locations of the sensor out along the cerci. Inverting this velocity value yields a spike conduction time of 0.54 ms/mm of axon. Over the 10-mm length of a typical adult cercus, this spike propagation speed translates to a differential propagation latency of about 5 ms between the most proximal and the most distal filiform hairs.
Fig. 3.
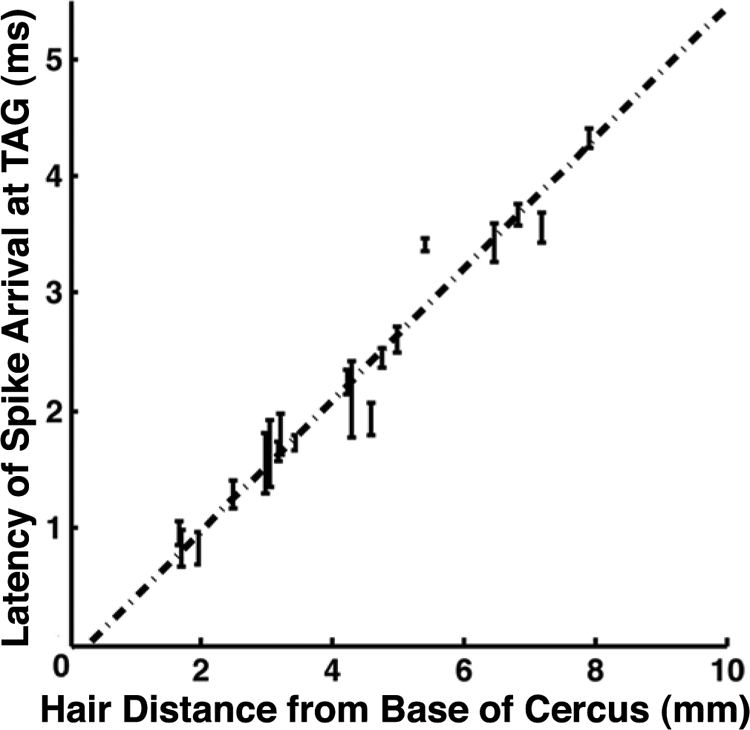
Linear dependence of spike propagation time on sensory afferent axon length. Each point on this graph is the spike propagation latency between the distal recording site and the base of the cercus for a single afferent axon, plotted against the distance between these 2 sites. Error bars show the SD of latencies measured for each hair. The dashed line is the best-fit linear regression for 23 hairs on 6 animals. The slope of the regression line measures the average axonal conduction velocity: 1.87 ± 0.09 mm/ms (R2 = 0.96, P < 0.001). This corresponds to a differential conduction delay of 0.54 ms/mm, or 5.4 ms over the length of a typical adult cercus.
These 23 measurements were taken from a totally random sample of hairs that were accessible to our electrophysiological techniques. Although the low variance indicates a very uniform conduction velocity across this sample, 23 hairs still represents a very small subset of the ≥700 hairs per cercus. To test the uniformity of the conduction velocity across a larger sample of filiform afferents, additional measurements were carried out from whole cercal nerve recordings.
Ensemble response of the filiform sensory afferent array to sequenced stimuli
Most (if not all) behaviorally relevant air-current stimuli activate the entire ensemble of nearly 1,500 filiform hairs distributed across both of the two cerci of a cricket. Given the observed range of spike conduction latencies, we would expect that the ensemble response of the entire afferent array to any specific stimulus would arrive at the TAG as a distribution of spikes, with a width that depends on the specific dynamic characteristics of the stimulus. Due to the differential spike propagation latencies caused by the length of the cerci, we would expect an impulsive step-function-like displacement of the entire block of air surrounding a cercus to elicit a train of afferent spikes that would be dispersed within a minimum of a 5-ms interval on arrival at the TAG. Air-current wavefronts that swept along the cercus would be expected to either increase or decrease the dispersion of the spike distribution. In particular, if the conduction velocities measured from the 23 afferent axons in the experiments described in the preceding section were uniform across the entire ensemble of afferents, then we would predict that the narrowest distribution of spikes would result from a stimulus wavefront traveling from the tip of a cercus toward the base of the cercus at that spike conduction velocity. This narrow distribution would cause the compound waveform from all afferent spikes to be highly compressed.
To test these hypotheses, we measured the ensemble spike train responses of cercal sensory afferents in a cercal nerve during the presentation of a variety of air-current stimuli that mimicked these different scenarios, i.e., bulk air movement across the entire cercus, and wavefronts moving at different directions and speeds along the cercus. This was accomplished through the presentation of sets of four independent air-current jets, directed at equally spaced positions along the cercus, either simultaneously (to mimic bulk flow) or in timed sequences (to mimic traveling wavefronts), as described in methods.
Figure 4 shows three examples of the ensemble afferent responses to different stimulus sets. In each panel, the top trace shows the timing of the four independent air-current jets, all of which were half-cosine waveforms of the same amplitude and duration. The bottom trace in each panel shows the average of 200 cercal nerve responses to repeated presentations of the corresponding stimulus sequence. Figure 4B (central panel) serves as the control case and shows the cercal nerve response to a stimulus in which all four positions along the cercus were activated simultaneously (resulting in a superposition of the four half-cosine waveforms into a single peak). This set was equivalent to a uniform bulk air displacement, similar to those that have been used in all previous studies that used standard loudspeakers to generate bulk airflow over an entire cricket specimen. The averaged compound spike waveform is distributed over an interval of about 10 ms.
Figure 4A shows the average compound waveform response to a stimulus sequence that started at the base of a cercus and swept toward the tip of the cercus, i.e., opposite to the direction of spike propagation along the cercus. The base stimuli preceded the tip stimuli by 5 ms. As expected, the spikes were dispersed to an even greater extent than observed for the control (simultaneous) case shown in Fig. 4B, over an interval of about 15–18 ms.
Figure 4C shows the average compound waveform response to a stimulus sequence that started at the tip of a cercus and swept toward the base of the cercus. The tip-to-base delay time was 5 ms, equivalent in duration to the 5-ms differential spike conduction delay time calculated from the previous set of experiments. This stimulus sequence yielded an ensemble response, which was clearly greater in amplitude and shorter in duration than those in the other panels. The spikes originating from hairs at all different locations along the cercus appeared to fuse into a compound waveform resembling a single action potential at the recording site at the base of the cercal nerve.
Measurements were repeated for a variety of sequence intervals ranging between 0 and 10 ms in 0.5-ms increments, and in both directions along the cerci, for five crickets. In all cases, the stimulus sequence with 5-ms total delay from tip to base elicited the average compound response having the largest peak amplitude. We interpret this as corresponding to the highest degree of synchronous arrival of the elicited spikes at the recording site. We interpret the very narrow compound waveform as indicating a very low variance in conduction velocities across the ensemble of afferents.
Responses of primary cercal sensory interneurons to sequenced stimuli
The primary synaptic targets of the cercal filiform afferents constitute a set of sensory interneurons in the TAG. All of the information extracted by this system and conveyed to higher CNS levels is carried through the axons of approximately 20 of these INs, which project through the paired abdominal connectives to ganglia in the thorax and head. All of our previous studies of these INs have been based on experiments using bulk-flow air-current stimuli, i.e., stimuli that simultaneously activate all filiform hairs along the entire length of the cerci. Here we tested whether any of the projecting INs had differential sensitivity to the differently timed sequences of air puffs used for the experiments described in the preceding section. To do so, the stimulus sequences were presented while we recorded the spiking activity through one abdominal hemicord in each of eight animals. We were able to obtain unequivocal discrimination of ≤13 different units in these preparations, using simultaneous extracellular recordings from five points along the abdominal nerve cord as the basis for phased-array spike sorting (see methods). Air-current stimuli elicited reliable spiking responses in 10 of these 13 units.
Of these 10 air-current-sensitive INs, 7 showed some degree of differential sensitivity to the direction and speed of the simulated wavefront. Figure 5 shows examples of stimulus-evoked responses of 3 different cercal interneurons, which are representative of three broad classes of IN responsiveness we observed. Each of the three colors in the panels is associated with data from a different one of the three cells and each vertical panel is associated with a different stimulus sequence. The top trace in each panel shows the timing of the four independent air-current jets, all of which were half-cosine waveforms of the same amplitude and duration as those in the experiments associated with Fig. 4. Below each stimulus trace are raw data traces recorded from three of the five extracellular electrodes placed along the abdominal nerve cord during presentation of that stimulus sequence. Spikes were recorded for 50 repeated presentations of each stimulus sequence and discriminated on the basis of their waveforms and propagation velocities, to obtain a series of spike times for each individual cell. A raster plot showing the stimulus-elicited spike occurrence times for 3 different INs for 50 stimulus presentations is shown below the raw data traces. Histograms for the occurrence times of spikes elicited from these 3 different cells are shown at the bottom of each vertical panel.
Each of these cercal INs had a different characteristic responsiveness to the three different stimulus sequences. The simplest case was that of the cell represented with the red markers and red histograms. This cell was equally responsive to all three stimulus sequences, in terms of the number of spikes elicited per stimulus and the distribution of those spikes in time following the stimulus. The other two cells (represented by black and blue markers and histograms) showed substantial sensitivity to the timing of the air-current puff sequences. Both of these units were activated reliably by the set of pulses sweeping from the tip of the cercus to the base at a speed equivalent to the average propagation speed of the filiform afferent axons (Fig. 5C). Note, however, that the temporal distributions of elicited spikes were quite different in these two cells. For simultaneous puffs mimicking bulk-flow stimuli (Fig. 5B), the responses of the cells were quite different from one another: although the activity of the cell indicated with red markers changed very little from the case in Fig. 5C, the reliability of the unit represented with black markers dropped to <0.5 and the unit corresponding to the blue data points was essentially unresponsive. For the set of four pulses sweeping from the base of the cercus to the tip (Fig. 5A), the cell indicated with black markers was even less responsive, but the cell indicated with blue markers showed significant responsiveness.
A more comprehensive representation of the dynamic sensitivities of these three cercal interneurons is shown in Fig. 6. These graphs plot the relative responsiveness of the three INs to multi-air-jet stimulus sequences that were swept along the cercus over a wide range of velocities. Figure 6A shows the cells' responses over a wide range of sweep speeds and Fig. 6B shows their responses at a finer resolution within the central range surrounding the zero-latency “bulk-flow” condition. Each of the three colored plots in these panels is color-matched to one of the cells in Fig. 5. A single data point on a plot indicates that cell's mean response to 50 repeated presentations of a specific four-jet sequence. For instance, the data point marked with an asterisk near the left end of the red plot in Fig. 6A was calculated from the data set corresponding to the red-colored unit in Fig. 5A. Responses were calculated by counting the mean number of spikes occurring within a 25-ms window after the presentation of the last of the four stimulus jets in that particular sequence set and then normalizing that value to the mean spike count recorded for the stimulus sequence that yielded the maximal response. Error bars indicate 1SD around the mean. Two different scales are presented for the abscissa. The black ordinate scale corresponds to the time between the first and last stimulus puffs, with positive numbers indicating that the cercal tip was stimulated first (i.e., 0 corresponds to simultaneous presentation of the four pulses, positive values correspond to tip-to-base sweeps, and negative values correspond to base-to-tip sweeps; a total delay of +5 ms corresponds to the conduction velocity of the filiform afferents). The green scale translates these delays into simulated wavefront velocities. (The velocity is simply the 1-cm length of the cercus divided by the total delay time between the tip and base pulses.)
Fig. 6.

Differential behavior of INs to simulated wave fronts. A: the 3 plots show the responses of 3 INs to a set of multi-air-jet stimulus sequences presented at a variety of sweep speeds and directions. The 3 cells are the same as those described in Fig. 4 and the same color-coding is used. The ordinate is the mean number of elicited spikes (counted within 25 ms after stimulus termination) for 50 repeated presentations of the corresponding stimulus sequence, normalized by the spike count recorded for the stimulus sequence that yielded the maximal response. Error bars indicate 1SD around the mean. The abscissa indicates the speed with which the stimulus jets were swept along the cercus. Two different scales are presented for the abscissa. The black ordinate scale corresponds to the time between the first and last stimulus jets, with positive numbers indicating that the cercal tip was stimulated first (i.e., 0 corresponds to simultaneous presentation of the 4 pulses, positive values correspond to tip-to-base sweeps, and negative values correspond to base-to-tip sweeps; a total delay of +5 ms corresponds to the conduction velocity of the filiform afferents). The green scale translates these delays into simulated wavefront velocities. B: the range between 1-ms tip lead and 1-ms base lead for all 3 plots from A is displayed at an expanded ordinate scale, with error bars, for improved visibility.
The IN represented with the red plots in Fig. 6 responds with approximately the same number of spikes to stimulus sequences at all sweep velocities, as well as to bulk-flow stimuli. As can be seen in Fig. 5, this cell fires at a fixed latency from stimulation at the cercal base.
The IN represented with the black plots was activated best by sets of four pulses sweeping from the tip of the cercus to the base at speeds between 1 and 5 mm/ms, which is near the average propagation speed of the filiform afferent axons. Its responsiveness decreases by about 50% as stimulus sequence latencies approach 0 (i.e., the bulk-flow case). Its minimum responsiveness is for stimulus sequences that sweep from base to tip at speeds between 1 and 5 mm/ms.
The IN represented with the blue plots has the most complex differential sensitivity to the directional sequences. This cell was activated strongly and reliably by all sets of four pulses sweeping from the tip of the cercus to the base at speeds >0.5 mm/ms. Its responsiveness dropped sharply to almost zero for stimulus sequence velocities within ±0.5 mm/ms of the bulk-flow case; however, it was also reliably responsive for stimulus sequences that swept from base to tip at speeds of <5 mm/ms.
Experiments were replicated using a total of eight cricket specimens. Cells with equivalent dynamic sensitivities to the three shown in Figs. 5 and 6 were observed in all preparations. We did not characterize the stimulus–response characteristics of the other seven air-current-sensitive units we discriminated to the same degree of precision as for the three units presented in these figures. However, we note that the stimulus–response sensitivities of all of the ten units we observed could be divided into the following general classes: three cells showed no significant differential responsiveness to different multijet stimulus sequences and the remaining seven cells showed significant selective responsiveness to stimulus sequences advancing from the tip of the cercus toward the base of the cercus. Of these seven cells, two showed substantial selective suppression of responsiveness to simultaneous air jets (i.e., “bulk-flow” stimuli).
DISCUSSION
The general goals of our study were 1) to determine the extent to which the distribution of receptor hairs out along the length of the cerci leads to temporal dispersion of the receptors' spike trains on entry into the TAG and 2) to investigate the functional significance of the observed dispersion. The results presented here demonstrate that the differential conduction characteristics of the filiform receptor array are of substantial significance: the cerci operate as delay lines and their functional organization supports computations by identified interneurons that have not been realized in earlier studies. These results force a substantial revision of our understanding of the structural and functional organization and operation of this system.
Cricket cerci function as delay lines
We report a mean spike propagation speed for the cercal filiform afferent fibers of about 1.9 mm/ms. This is consistent with values reported for other insect sensory axons of equivalent diameter (Chapman and Pankhurst 1967; Pumphrey and Rawdon-Smith 1937). The immediate consequence is that spikes from mechanosensory hairs at distal locations on a typical cercus take about 5 ms longer to arrive at the TAG than spikes from proximal locations. Considering the extremely low intra- and interanimal variance around the mean conduction speed (R2 = 0.96 at the 0.001 level), the functional organization of the cercal filiform sensory array could, in theory, support subsequent computations based on the observed delay-line characteristics. The cercal sensory system therefore shares common operational features with several other sensory systems that are implemented around delay-line processing (Beckius et al. 1999; Carr 1993; Carr and Konishi 1988; Carr et al. 1986; Saitoh and Suga 1995; Schnupp and Carr 2009). Our results suggest that the diameters of the filiform afferents may be extremely uniform, within and between animals. To our knowledge, however, there has been no systematic anatomical analysis of filiform afferent axon diameters. The only published anatomical data concerning afferent axons in Acheta domesticus were derived from a single cross section of a cercal nerve and the authors were unable to identify the subset of the axons that corresponded to the filiform afferents (Edwards and Palka 1974).
This delay-line phenomenology is not surprising in and of itself: delay-line characteristics would be expected from a linear sensor array, if the spike propagation velocity were nearly equal in all afferent axons. We note, however, that our results are in direct contrast to those reported recently for a linearly distributed array of sensory afferent axons in an analogous system in the crayfish (Mellon and Christison-Lagay 2008). A population of hydrodynamic mechanoreceptors located on the antennules of Procambarus clarkii drives the initiation of the animal's startle response. Although the mechanoreceptors are distributed along the crayfish antennules, afferent spikes generated in this sensory array by bulk fluid movements arrive simultaneously at the central integration site. This simultaneity results from position-dependent variations in the sensory-axon conduction velocities, which appears to derive from a systematic graduated increase in axon diameter for more distally located sensilla. It may be that the relative incompressibility of water would lead to most signals arriving simultaneously for the crayfish, whereas they could be distributed in air for the cricket. Similar mechanisms underlying a systematic gradation in conduction velocity that result in neuronal synchrony have also been demonstrated in mollusks (Young 1939) and vertebrates (Bennett 1971; Sugihara et al. 1993).
Although the presence of some degree of differential delay-line phenomenology might have been expected in the cercal system, to the best of our knowledge neither its timescale nor its variance had been measured in previous studies, nor had the possible functional implications of delay-line characteristics been considered.
Some interneurons are sensitive to the direction and speed of stimulus wavefronts
We obtained clear discrimination of ten units that were sensitive to air currents in our preparations. This number of ten units corresponds to the expected number of cercal-projecting interneurons that run through each hemiconnective. Although our use of extracellular recording techniques did not allow unequivocal identification of the air-current-sensitive units with respect to the ten known classes of reidentifiable interneurons, we conclude that the units we describe in detail in Figs. 5 and 6 are among the identified cercal INs that have been described in previous studies (Jacobs and Murphey 1987). As indicated earlier, the stimulus–response characteristics of three cells described in Figs. 5 and 6 are representative of the three different general classes of responsiveness observed from the ten cells in our experiments.
The class with the least complex responsiveness is exemplified by the cell represented with the red symbols and plots in Figs. 5 and 6. That cell had no significant differential sensitivity to any of the different stimulus sequences: it always fired in phase with the one jet delivered to the base of the cercus. We hypothesize that this IN makes differential synaptic connectivity with the subset of filiform afferents innervating the dense group of mechanosensory hairs at the base of the cercus. However, we note that this directional sequence independent neuron may still play an important functional role in sequence discrimination at the system level. Its independence from sequence direction and velocity would enable it to serve the role of a “normalizer” for extraction of the sweep parameters across the ensemble of neurons: the relative firing rates of the three classes of cells shown in Fig. 6 would provide sufficient information to discriminate stimuli moving proximally from those moving distally or occurring simultaneously, with the sequence-independent neuron shown with the red plots serving as a baseline for comparison.
The responsiveness of the cell represented with the black symbols and lines in Figs. 5 and 6 is also easily understandable within the context of the observed afferent delay-line characteristics. The amplitude of this cell's response was greatest for stimulus sequences that swept along the cercus from tip to base at a speed near the spike propagation speed. The responsiveness decreased to less than half of the best response for simultaneous (bulk-flow) stimuli and decreased even further for stimuli that swept along the cercus in the base-to-tip direction (i.e., opposite to the spike propagation direction). No special dendritic structure or synaptic connectivity would be required for this cell to function as a “filter” for such sweeps: a simple linear summation of all inputs, processed with a threshold, would yield this characteristic sensitivity. That is, the delay-line characteristics of the cercal afferent array could be sufficient for the observed dynamic sensitivity of this IN. In the engineering sense, this cell appears to function as a phased array detector.
Although the behavioral role of this cell may be understood within the context of the population coding scheme discussed earlier, interpretation of its specific behavioral relevance is more problematic. This cell is tuned to wavefronts oriented from the rear of the animal between 2 and 10 m/s. This range is much higher than the velocities of air currents that have been measured during most neuroethological studies of predator attacks on crickets: most reported measurements range between a few mm/s to a few cm/s (Camhi et al. 1978; Casas et al. 2008; Dangles et al. 2006; Gnatzy and Husslein 1986; Gnatzy and Kamper 1990; Tautz and Markl 1978). Further, it is known from many studies that crickets are responsive to stimuli coming from directions other than the rear (see, for example, Gras et al. 1994). However, this cell's sensitivity range corresponds precisely to measurements of the air-current velocities necessary to trigger the cricket's defensive kick behavior against Digger wasp predators (Dumpert and Gnatzy 1977; see also Gnatzy and Heusslein 1986; Gnatzy and Kamper 1990). During the final 100 ms as a wasp run toward a cricket, the cricket (if successful) has already oriented itself with its rear (and cerci) toward the wasp, on the basis of other cercal sensory input. Air-current stimuli from the rear of the animal of ≥2 m/s are required to trigger the self-defensive hind-leg kicks at the wasps and the precise timing of the backward kick is crucial to its effectiveness. This neuron is therefore a strong candidate for involvement in this behavior.
The characteristic sensitivity for the cell represented with the blue symbols and plots in Figs. 5 and 6 is more complex from a mechanistic standpoint. This cell was approximately equally responsive to all stimulus sequences that swept along the cercus from tip to base, regardless of sequence speed. However, the responsiveness dropped effectively to zero for a small range of stimulus-sequence speeds bracketing the bulk-flow case and then returned to as much as 80% of the best response for a range of stimulus sequences that swept from base to tip. In the engineering sense, this cell appears to function as a “notch filter,” in a manner that would filter out the responses of the receptor array to bulk flow of the air around the animal. The behavioral significance of this filtering operation could be very straightforward: the animal's own movements would generate such bulk air movements, as would any large-scale air movements caused by wind or movements of nearby large objects. This cell is therefore a candidate for involvement in subsequent computations requiring small-scale dynamic feature detection.
Some aspect of this neuron's dendritic structure and/or synaptic integrative properties results in its being “tuned” to (or to filter out) a particular dynamic activation sequence along the cerci other than the one sequence that yields the largest linear sum through delay-line-based superposition. Several plausible biological mechanisms can be imagined through which this cercal IN (and similar INs) could achieve such complex dynamical sensitivity. These mechanisms would require that the interneuron has dendritic architecture that would enable segregation of the synaptic inputs from the different afferents on the basis of their cercal location. This segregation could be used to enhance discrimination of dynamic aspects of stimulus waveforms that are smaller than the spatial scale of a single cercus. For example, configurations can be imagined that would use the delay-line characteristics of the cercus to directly discriminate the direction of air-current wavefronts traveling toward or away from the animal at speeds in the range of 1 cm per 5 ms, in a manner equivalent to that proposed by Rall (1964). This would require the synaptic arbors of afferents from distal hairs to project into regions of the filiform map that are distinct from the arbors of similar hairs located at proximal locations on the cercus. Such a location-based topographic segregation of afferent arborizations has not been considered in earlier anatomical characterizations of the afferent map (Bacon and Murphey 1984; Jacobs and Theunissen 1996). Multicellular circuit-based mechanisms might also be involved in producing the complex dynamic sensitivities observed in this cell.
Considering the possible functional implications of differential latency of afferents from different locations out along the cerci, it will be important to determine whether the filiform sensory afferents are in fact segregated and/or labeled in a manner that would allow such differential connectivity to the INs. The electrophysiological response properties and anatomy of the filiform sensory afferent arborizations of a sample of the filiform receptors have been studied previously (Jacobs and Theunissen 1996; Paydar et al. 1999) and used as the basis for predicting the global activity patterns that would be elicited across the ensemble of afferent terminals in response to several types of air-current stimuli (Jacobs and Pittendrigh 2002; Jacobs and Theunissen 2000). The mechanoreceptors used for those previous studies were all located near the base of the cerci. Subsequent modeling studies made the implicit assumption that cercal interneurons integrate sensory input from filiform afferents, with no consideration of any systematic temporal dispersion (Jacobs and Pittendrigh 2002; Jacobs and Theunissen 2000; Magal et al. 2006). Based on the results presented here, it will be necessary to refine the anatomical atlas to incorporate the information regarding cercal delay-line properties. This will, in turn, enable a more accurate representation of the dynamic activity patterns for modeling studies of the primary interneurons that are the decoders of the afferent input.
GRANTS
This work was supported by an interdisciplinary National Institutes of Health/National Science Foundation (NSF) Collaborative Research in Computational Neuroscience Grant CRCNS-0515290, NSF Grant CMMI-0849433, NSF Grant EF-0425878, and National Institute of Mental Health Grant 2R01 MH-064416.
ACKNOWLEDGMENTS
We thank T. Gedeon and G. Jacobs for helpful discussions and comments.
REFERENCES
- Bacon J, Murphey R. Receptive fields of cricket giant interneurones are related to their dendritic structure. J Physiol 352: 601–623, 1984 [DOI] [PMC free article] [PubMed] [Google Scholar]
- Beckius GE, Batra R, Oliver DL. Axons from anteroventral cochlear nucleus that terminate in medial superior olive of cat: observations related to delay lines. J Neurosci 19: 3146–3161, 1999 [DOI] [PMC free article] [PubMed] [Google Scholar]
- Bennett MVL. Electric organs. In: Fish Physiology, edited by Hoar WS, Randall DR. New York: Academic Press, 1971, V, p. 347–491 [Google Scholar]
- Camhi J, Tom W, Volman S. The escape behavior of the cockroach Periplaneta americana. J Comp Physiol A Sens Neural Behav Physiol 128: 203–212, 1978 [Google Scholar]
- Carr C. Processing of temporal information in the brain. Annu Rev Neurosci 16: 223–243, 1993 [DOI] [PubMed] [Google Scholar]
- Carr C, Heiligenberg W, Rose G. A time-comparison circuit in the electric fish midbrain. I. Behavior and physiology. J Neurosci 6: 107–119, 1986 [DOI] [PMC free article] [PubMed] [Google Scholar]
- Carr C, Konishi M. Axonal delay lines for time measurement in the owl's brainstem. Proc Natl Acad Sci USA 85: 8311–8315, 1988 [DOI] [PMC free article] [PubMed] [Google Scholar]
- Casas J, Steinmann T, Dangles O. The aerodynamic signature of running spiders. PLoS One 3: e2116, 2008 [DOI] [PMC free article] [PubMed] [Google Scholar]
- Chapman K, Pankhurst J. Conduction velocities and their temperature coefficients in sensory nerve fibres of cockroach legs. J Exp Biol 46: 63–84, 1967 [Google Scholar]
- Comer CM, Mara E, Murphey K, Getman M, Mungy M. Multisensory control of escape in the cockroach Periplaneta americana. J Comp Physiol A Sens Neural Behav Physiol 174: 13–26, 1994 [Google Scholar]
- Dangles O, Irshchick D, Chittka L, Casas J. Variability in sensory ecology: expanding the bridge between physiology and evolutionary biology. Q Rev Biol 84: 51–84, 2009 [DOI] [PubMed] [Google Scholar]
- Dangles O, Ory N, Steinmann T, Christ J-P, Casas J. Spider's attack versus cricket's escape: velocity modes determine success. Anim Behav 72: 603–610, 2006 [Google Scholar]
- Dumpert K, Gnatzy W. Cricket combined mechanoreceptors and kicking response. J Comp Physiol 122: 9–25, 1977 [Google Scholar]
- Edwards S, Palka J. The cerci and abdominal giant fibres of the house cricket, Acheta domesticus. I. Anatomy and physiology of normal adults. Proc R Soc Lond B Biol Sci 185: 83–103, 1974 [DOI] [PubMed] [Google Scholar]
- Gnatzy W, Heusslein R. Digger wasp against crickets. I. Receptors involved in the antipredator strategies of the prey. Naturwissenschaften 73: 212–215, 1986 [Google Scholar]
- Gnatzy W, Kamper G. Digger wasp against crickets. II. An airborne signal produced by a running predator. J Comp Physiol A Sens Neural Behav Physiol 167: 551–556, 1990 [Google Scholar]
- Gras H, Hörner M, Schürmann F-W. A comparison of spontaneous and wind-evoked running modes in crickets and cockroaches. J Insect Physiol 40: 373–384, 1994 [Google Scholar]
- Heinzel H-G, Dambach M. Travelling air vortex rings as potential communication signals in a cricket. J Comp Physiol A Sens Neural Behav Physiol 160: 79–88, 1987 [Google Scholar]
- Huang Y, Miller JP. Phased-array processing for spike discrimination. J Neurophysiol 92: 1944–1957, 2004 [DOI] [PubMed] [Google Scholar]
- Jacobs G, Miller J, Aldworth Z. Computational mechanisms of mechanosensory processing in the cricket. J Exp Biol 211: 1819–1828, 2008 [DOI] [PubMed] [Google Scholar]
- Jacobs G, Murphey R. Segmental origins of the cricket giant interneuron system. J Comp Neurol 265: 145–157, 1987 [DOI] [PubMed] [Google Scholar]
- Jacobs G, Theunissen F. Functional organization of a neural map in the cricket cercal system. J Neurosci 16: 769–784, 1996 [DOI] [PMC free article] [PubMed] [Google Scholar]
- Jacobs G, Theunissen F. Extraction of sensory parameters from a neural map by primary sensory interneurons. J Neurosci 20: 2934–2943, 2000 [DOI] [PMC free article] [PubMed] [Google Scholar]
- Jacobs GA, Pittendrigh CS. Predicting emergent properties of neuronal ensembles from a database of individual neurons. In: Computational Neuroanatomy: Principles and Methods, edited by Ascoli G. Clifton, NJ: Humana Press, 2002, p. 151–170 [Google Scholar]
- Kamper G, Dambach M. Response of the cercus-to-giant interneuron system in crickets to species-specific song. J Comp Physiol A Sens Neural Behav Physiol 141: 311–317, 1981 [Google Scholar]
- Landolfa M, Jacobs G. Direction sensitivity of the filiform hair population of the cricket cercal system. J Comp Physiol A Sens Neural Behav Physiol 177: 759–766, 1995 [Google Scholar]
- Magal C, Dangles O, Caparroy P, Casas J. Hair canopy of cricket sensory system tuned to predator signals. J Theor Biol 241: 459–466, 2006 [DOI] [PubMed] [Google Scholar]
- Mellon D, Christison-Lagay K. A mechanism for neuronal coincidence revealed in the crayfish antennule. Proc Natl Acad Sci USA 105: 14626–14631, 2008 [DOI] [PMC free article] [PubMed] [Google Scholar]
- O'Shea M, Adams M. Pentapeptide (proctolin) associated with an identified neuron. Science 213: 567–569, 1981 [DOI] [PubMed] [Google Scholar]
- Palka J, Levine R, Schubiger M. The cercus-to-giant interneuron system of crickets. J Comp Physiol A Sens Neural Behav Physiol 119: 267–283, 1977 [Google Scholar]
- Paydar S, Doan C, Jacobs G. Neural mapping of direction and frequency in the cricket cercal sensory system. J Neurosci 19: 1771–1781, 1999 [DOI] [PMC free article] [PubMed] [Google Scholar]
- Pumphrey R, Rawdon-Smith AF. Synaptic transmission of nervous impulses through the last abdominal ganglion of the cockroach. Proc R Soc Lond B Biol Sci 122: 106–118, 1937 [Google Scholar]
- Rall W. Theoretical significance of dendritic trees of neuronal input-output relations. In: Neural Theory and Modeling, edited by Reiss RF Palo Alto, CA: Stanford Univ. Press, 1964, p. 73–97 [Google Scholar]
- Saitoh I, Suga N. Long delay lines for ranging are created by inhibition in the inferior colliculus of the mustached bat. J Neurophys 74: 1–11, 1995 [DOI] [PubMed] [Google Scholar]
- Schnupp J, Carr C. On hearing with more than one ear: lessons from evolution. Nat Neurosci 12: 692–697, 2009 [DOI] [PMC free article] [PubMed] [Google Scholar]
- Shimozawa T, Kanou M. The aerodynamics and sensory physiology of range fractionation in the cereal filiform sensilla of the cricket Gryllus bimaculatus. J Comp Physiol A Sens Neural Behav Physiol 155: 495–505, 1984 [Google Scholar]
- Sugihara I, Lang E, Llinas R. Uniform olivocerebellar conduction time underlies Purkinje cell complex spike synchronicity in the rat cerebellum. J Physiol 470: 243–271, 1993 [DOI] [PMC free article] [PubMed] [Google Scholar]
- Tauber E, Camhi J. The wind-evoked escape behavior of the cricket Gryllus bimaculatus: integration of behavioral elements. J Exp Biol 198: 1895–1907, 1995 [DOI] [PubMed] [Google Scholar]
- Tautz J, Markl H. Caterpillars detect flying wasps by hairs sensitive to airborne vibration. Behav Ecol Sociobiol 4: 101–110, 1978 [Google Scholar]
- Young J. Fused neurons and synaptic contacts in the giant nerve fibres of cephalopods. Philos Trans R Soc Lond B Biol Sci 229: 465–503, 1939 [Google Scholar]