Abstract
It is now well established that the antidiuretic response to vasopressin is modulated by changes in aquaporin-2 (AQP2) expression in response to hydration status. While vasopressin itself is one signal driving expression, other signals also play a part. In this study, we planned to investigate whether prostaglandins, known to modulate AQP2 trafficking, may play a role in this process. Male Wistar rats were kept in metabolic cages, with either free access to water and food, or were given 15 g of food gelled with water, such that they were fluid restricted or fluid loaded. The effects of oral administration of two structurally different NSAIDs, indomethacin and ibuprofen, and a COX-2-selective NSAID, meloxicam, on urine output and AQP2 expression were investigated in kidneys removed under terminal anesthesia. All the NSAIDs decreased AQP2 expression significantly in water-restricted rats but did not significantly alter PGE excretion. In water-loaded rats, the effects were less marked, and meloxicam had no significant effect. Consistent with this, ibuprofen prevented the increase in AQP2 expression seen in response to dehydration. These results demonstrate that NSAIDs decrease AQP2 protein abundance, particularly during adaptation during dehydration. This may be of particular significance in older and critically ill patients, who are prone to dehydration.
Keywords: antidiuresis, vasopressin, collecting duct
it is now well established that the acute antidiuretic action of vasopressin depends on the exocytic insertion of aquaporin-2 (AQP2) water channels from a store in intracellular vesicles to the apical plasma membrane of collecting duct principal cells (13, 24, 29, 34), the so-called “shuttle” mechanism. Furthermore, there is now clear evidence that this acute response is modulated by changes in the total amount of AQP2 present in the cells. Such changes occur in response to chronic alterations in hydration, with water loading causing a decrease in AQP2 expression, while dehydration increases the AQP2 levels (28). Changes in AQP2 expression are also found in association with a variety of pathological conditions associated with either excess water loss (1, 7, 11, 12, 23, 25) or water retention (2, 30, 31, 39).
The signals associated with changes in AQP2 expression are currently being sought. One signal is vasopressin, which causes an increase in AQP2 expression when given as a chronic infusion to either Brattleboro rats (which lack endogenous vasopressin) (5) or normal rats (8, 9). This effect is thought to be mediated by cAMP and protein kinase A, which also plays a pivotal role in the acute shuttling response, via phosphorylation of a CRE-binding protein, which then binds to the promoter of the AQP2 gene (38). However, it is now clear that vasopressin-independent pathways also play a role, since decreases in AQP2 are seen in association with the ability to lose water in the urine despite ongoing vasopressin infusion (vasopressin escape phenomenon) (8, 9). This escape phenomenon has been shown to depend on both nitric oxide and prostaglandin production (26). There is evidence that tonicity may be a significant signal (16, 19). However, chronic furosemide treatment, which will also wash out the medullary gradient, did not decrease AQP2 levels in vivo (25, 37). Furthermore, AQP2 expression is dissociated from vasopressin levels and the ability to cause delivery of AQP2 to the plasma membrane, in a number of models of nephrogenic diabetes insipidus (NDI) (12, 23, 25). In particular, in lithium-treated rats AQP2 is profoundly downregulated (23), probably at least partly via decreased cAMP levels (3). Administration of 1-deamino-8-d-AVP in these animals at levels sufficient to cause efficient delivery of AQP2 to the plasma membrane had little effect on AQP2 expression. In contrast, dehydration of lithium-treated animals could markedly increase AQP2 expression despite being unable to induce delivery (23). Taken together, this evidence indicates that changes in hydration status provide a stimulus for altered AQP2 levels that is independent of vasopressin.
Prostaglandins are also known to play a part in modulating diuresis. Not only has vasopressin been shown to stimulate prostaglandin synthesis in both collecting duct and interstitial cells, but renal prostaglandin synthesis is also increased in a variety of pathological conditions as well as during periods of dehydration (6, 20, 33, 36). The production of prostaglandins in response to vasopressin may represent a negative feedback mechanism, since the major effect of prostaglandins on fluid balance appears to be mediated by the binding of PGE2 to the EP3 receptor, subsequently inhibiting increased intracellular cAMP, thereby hindering vasopressin mediated AQP2 shuttling (17, 27). On the other hand, prostaglandins may also have an antidiuretic function under some circumstances (6, 20, 32, 36).
In the current study, we have treated rats with several different NSAIDs in conjunction with controlled hydration states: the rationale for this study was that it would inhibit prostaglandin synthesis and thus cast light on their role in AQP2 expression. The results suggest that NSAIDs inhibit the increase in AQP2 expression during periods of dehydration, but it is not clear that this effect is mediated by prostaglandins.
MATERIALS AND METHODS
Antibodies and reagents.
The polyclonal antibody against AQP2 used in this study (LL127) has been extensively characterized in earlier studies (5, 28) and was the kind gift of Dr. Mark Knepper (National Institutes of Health, Bethesda, MD). The secondary antibody was a commercially produced peroxidase-conjugated goat-anti rabbit antibody (P448, Dako). Drugs were obtained from Sigma or from the Leeds General Infirmary pharmacy. Other chemicals were obtained from Sigma or from BDH and were of analytic grade.
Experimental animals.
SPF-grade male Wistar rats, 200–250 g, were obtained from Biomedical Services (University of Leeds). Rats were kept in individual metabolic cages so that food and water intake, urine output, and body weight could be monitored. Rats were given 15 g of dry powdered rat chow each day. This ensured that after the first day all the food was eaten. Rats either had free access to water, or a known amount of water (20 or 50 ml/day) was mixed with their diet (gelled with 1% agar). Under these circumstances, the rats eat all their food to get adequate calories, and so their water intake can be accurately controlled. The normal water intake of 250-g rats in a metabolic cage is ∼25 ml/day, so with 20 ml/day the animals become mildly dehydrated, with a very concentrated urine, but continue to grow. With an intake of 50 ml/day, they are markedly polyuric, with dilute urine. All rats had free access to salt blocks. This was to ensure consistency of results with previous studies, and potential future studies, carried out in lithium-treated animals, which require salt blocks to avoid toxicity. It also ensured that animals were salt replete. All procedures were approved and licensed by the UK Home Office.
For most protocols, rats underwent a 2-day baseline period, followed by 2 days during which the experimental drug was mixed with their food. Water intake was the same over all 4 days. Controls were treated identically, but their food was drug free throughout. In the experiment on the effect of ibuprofen on dehydration, there were three groups. All had a 2-day baseline period with free access to water, followed by a 2-day experimental period during which controls had free access to water while experimental animals had no access to water, with or without ibuprofen. In the fluid-loaded/fluid-restricted meloxicam study, rats received 50 ml of water/day with their diet during the baseline period and then spent 4 days on a diet containing 20 ml water/day with or without meloxicam. These data are summarized in Table 1.
Table 1.
Summary of protocols for the different experiments showing duration of baseline and experimental periods, water intake, and drug dose for each experiment
| Baseline Period, days | Baseline Water Intake, ml/day | Drug Dose, mg·kg−1·day−1 | Treatment Period, days | Treatment Water Intake, ml/day | |
|---|---|---|---|---|---|
| Indomethacin | 2 | Free access | 8 | 2 | Free access |
| Ibu | 2 | Free access | 40 | 2 | Free access |
| Ibu/dehydration | 2 | Free access | 40 | 2 | 0 (control, free access) |
| Ibu/FR | 2 | 20 | 40 | 2 | 20 |
| Ibu/FL | 2 | 50 | 40 | 2 | 50 |
| Mel/FR | 2 | 20 | 1 | 2 | 20 |
| Mel/FL | 2 | 50 | 1 | 2 | 50 |
| Mel/FL/FR | 2 | 50 | 1 | 4 | 20 |
Ibu, ibuprofen; Mel, meloxicam; FL, fluid loaded; FR, fluid restricted.
Drug dosages.
Indomethacin was given at 8 mg·kg−1·day−1, ibuprofen at 40 mg·kg−1·day−1, and meloxicam at 1 mg·kg−1·day−1.
Preparation of tissue samples.
At the end of the experimental period, rats were anesthetized (0.9 ml of a 14% Hypnorm:14% Hypnovel mixture ip), the kidneys were removed, and the inner medulla was dissected out. Animals were euthanized by exsanguination. The tissue was homogenized (10-s burst with polytron at setting 4) in 1 ml of dissecting buffer (300 mM sucrose, 25 mM imidazole, 1 mM EDTA, pH 7.2, containing 8.5 μM leupeptin and 1 mM PMSF as protease inhibitors). The homogenate was centrifuged at 4,000 g for 15 min to pellet nuclei, mitochondria, and other large cell fragments. The supernatant was used for the preparation of gel samples, by dilution with 4× Laemmli sample buffer, with a final SDS concentration of 2.5%. An aliquot of the supernatant was also taken for spectrophotometric measurement of protein, with absorbance at 280 nm, to allow loading of equal amounts of protein onto the gels.
Electrophoresis and immunoblotting.
Gel samples prepared from the inner medulla of control and experimental animals were run at the same protein loading on duplicate SDS-PAGE minigels (Bio-Rad mini-protean II system), for parallel protein assessment using Coomassie staining and Western blotting, using standard protocols. After blocking [1 h in 5% dried skim milk in PBS-T (80 mM Na2HPO4, 20 mM NaH2PO4, 100 mM NaCl, pH 7.5, plus 0.1% Tween 20)], the blot was incubated overnight at 4°C in primary antibody against AQP2 (LL127, 1:5,000 dilution), followed by a 1-h incubation at room temperature with a peroxidase-conjugated secondary antibody (P448, 1:3,000 dilution). Labeling was visualized using chemiluminescence (Supersignal ECL, Pierce). Films were scanned on an HP6200C scanner, and labeling was quantitated using custom written software. Total labeling of the two AQP2 bands (corresponding to the glycosylated and nonglycosylated protein) for each lane was combined. The labeling for each lane was calculated as a fraction of the mean for the control lanes on that gel.
Real-time (quantitative) PCR.
Total RNA from the inner medulla of control and experimental animals was isolated (3a). Before running of qrt-PCR, 2 μg of total RNA were primed with oligo (dT)15 primer (Promega) and reverse transcribed to cDNA using SuperScript RNase H− reverse transcriptase (Invitrogen) according to standard protocols. AQP2 primers were designed according to published sequences in the European Molecular Biology Laboratory (GenBank, accession number D13906, supplied by Sigma-Genosys). The sequence for the forward primer was 5′-CCAGATCGCCGTGGCCTTTGG-3′ and for the reverse primer was 5′-GCCGTTTCTGGACGTCCTCG-3′. The housekeeper gene used during this study was rat GAPDH. The GAPDH primers were supplied by Sigma-Genosys and were designed according to published sequences in the European Molecular Biology Laboratory (GenBank, accession number NM_017008). The sense primer sequence was 5′-TGATTCTACCCACGGCAAGT-3′, and the antisense primer sequence was 5′-AGCATCACCCCATTTGATGT-3′. To be able to analyze the AQP2 mRNA product relative to the GAPDH housekeeper, the efficiency of the PCR for both was optimized to be approximately equal.
Approximately 30 ng of cDNA were amplified in each SYBR green reaction using a Roche LightCycler. Duplicate samples for both AQP2 and GAPDH underwent 45 cycles according to the following protocol: denaturation at 95°C for 20 s, annealing at 60°C for 5 s, and extension at 72°C for 23 s. After PCR, analysis of the melting curve of the amplification products was used to determine purity of reaction and product. Fit point analysis of the amplification product, relative to the housekeeper (GAPDH), in real time was performed.
Radioimmunoassay of urine samples.
Alterations in levels of excreted PGE (the assay does not distinguish between PGE1 and PGE2) were ascertained by liquid-phase scintillation counting of 3H-PGE2 (Sigma) following the manufacturer's displacement RIA, and using the analytic methods described in the kit. The final concentration of excreted PGE was determined in accordance with the total volume of excreted urine.
Additional analytic procedures.
Urine samples were analyzed for differences in osmolality by freezing point depression through the use of a cryometric osmometer; Na+ and K+ concentration by flame photometry; and Cl− concentration by electrometric titration.
Statistics.
Values in the text represent means ± SE, and comparisons were made using unpaired t-tests for all studies except the control vs. dehydration ± ibuprofen study, which was analyzed by ANOVA with Bonferroni post hoc corrections being applied.
RESULTS
Indomethacin and ibuprofen decrease AQP2 levels.
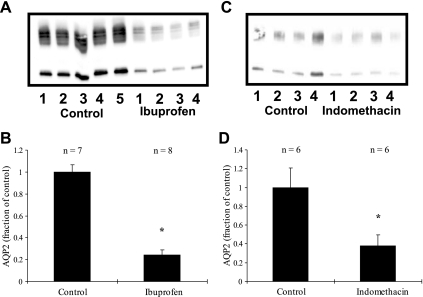
Treatment with indomethacin or ibuprofen had no effect on water drinking or urine output. However, as shown in Fig. 1, indomethacin treatment caused a decrease in AQP2 levels to 38 ± 12% of control levels (100 ± 21%, n = 6 in each group, P < 0.05). Ibuprofen caused a similar decrease, to 24 ± 5 (n = 8), vs. 100 ± 6% for the controls (n = 7, P < 0.01). Since both drugs had similar effects, but ibuprofen produced significantly less gastrointestinal inflammation, subsequent experiments were only done using ibuprofen.
Fig. 1.
Effects of ibuprofen (A and B) and indomethacin (C and D) on aquaporin-2 (AQP2) expression in rats with free access to water. A and C: representative immunoblots. B and D: summary of all the data. Both drugs cause a substantial and significant reduction in AQP2 expression. *P < 0.05 with respect to control.
Ibuprofen prevents the dehydration-induced increase in AQP2 expression.
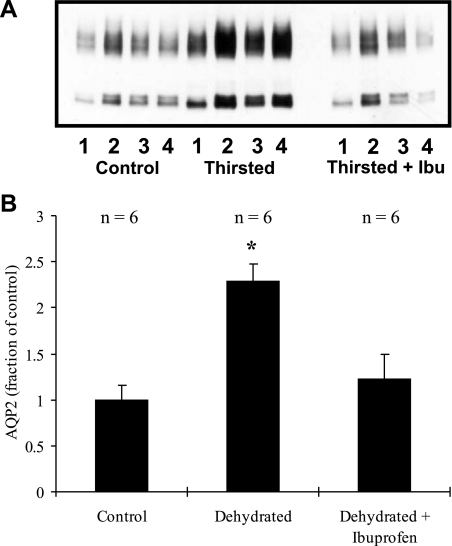
As shown in Fig. 2, if animals were water-deprived for 2 days, AQP2 expression increased to 230 ± 19% of control levels (100 ± 16%, n = 6 in each group, P < 0.01). In animals simultaneously treated with ibuprofen, no significant change was seen. AQP2 was 122 ± 27% [n = 6, not significant (NS)] of the level seen in the controls. Urine output fell from 11 ± 2 ml/day in the control animals to 3 ± 0.4 ml/day in the two water-deprived groups (there was no significant difference in urine output with ibuprofen treatment, although the average urine output was slightly higher).
Fig. 2.
Effect of 48-h dehydration on AQP2 expression, with or without concurrent ibuprofen treatment. A: representative immunoblot. B: summary of all data. Dehydration increases AQP2 expression more than 2-fold. This increase is prevented by ibuprofen treatment. *P < 0.05 with respect to control.
Ibuprofen decreases AQP2 expression in fluid-restricted animals.
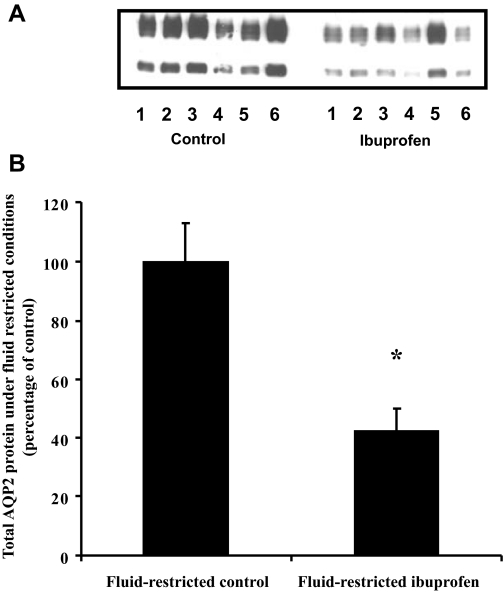
As summarized in Table 2, the urine output of the ibuprofen-treated animals was significantly above that of the controls after the first 24 h of treatment. Equally, treatment with ibuprofen resulted in a significant decrease in the urine osmolality relative to the control animals. However, no changes in salts or PGE excretion were observed. At the end of the study, the total AQP2 expression in the ibuprofen-treated animals was decreased by 58%, as shown in Fig. 3 (42 ± 7 vs. 100 ± 13%, P < 0.003, n = 6).
Table 2.
Effects of ibuprofen treatment and mild dehydration on diuresis, urine osmolality, and excretion of salt and PGE
| Number of Days of Treatment | Fluid-Restricted Control | Fluid-Restricted Ibuprofen | P Value | |
|---|---|---|---|---|
| Urine output, ml/day | 1 | 7.5 ± 0.6 | 9.8 ± 0.9 | <0.05 |
| 2 | 9.0 ± 0.7 | 10.8 ± 0.9 | 0.14 | |
| Urine osmolality, mosmol/kgH2O | 1 | 2,235 ± 119 | 1,763 ± 125 | <0.02 |
| 2 | 2,117 ± 98 | 1,637 ± 79 | <0.003 | |
| Sodium, mmol/day | 1 | 1.3 ± 0.1 | 1.8 ± 0.2 | 0.07 |
| 2 | 1.8 ± 0.2 | 1.8 ± 0.1 | 0.93 | |
| Potassium, mmol/day | 1 | 3.4 ± 0.3 | 4.2 ± 0.3 | 0.08 |
| 2 | 4.4 ± 0.5 | 3.9 ± 0.2 | 0.30 | |
| Chloride, mmol/day | 1 | 1.7 ± 0.1 | 1.8 ± 0.1 | 0.56 |
| 2 | 1.9 ± 0.2 | 1.9 ± 0.2 | 0.92 | |
| PGE, ng/day | 1 | 5.6 ± 0.5 | 5.4 ± 0.7 | 0.82 |
| 2 | 5.8 ± 1.3 | 5.4 ± 0.8 | 0.80 |
Values are means ± SE.
Fig. 3.
Effect of fluid restriction and ibuprofen treatment on total AQP2 protein expression. A: representative immunoblot. B: summary of all data. AQP2 expression was significantly decreased in ibuprofen-treated animals under fluid-restricted conditions. *P < 0.05 with respect to control.
Ibuprofen produces only a modest decrease in AQP2 levels in fluid-loaded animals.
Ibuprofen was given to animals receiving 50 ml/day of water in their diet, a modest fluid loading. As summarized in Table 3, under these fluid-loaded conditions ibuprofen had no obvious effect on urine output or osmolality. Additionally, there were no differences in sodium, potassium, chloride or PGE excretion.
Table 3.
Effects of fluid loading and ibuprofen treatment on diuresis, osmolality, and excretion of salt and PGE
| Number of Days of Treatment | Fluid-Loaded Control | Fluid-Loaded Ibuprofen | P Value | |
|---|---|---|---|---|
| Urine output, ml/day | 1 | 29.7 ± 2 | 29.3 ± 1.1 | 0.93 |
| 2 | 27.5 ± 1.8 | 26.7 ± 1.6 | 0.86 | |
| Urine osmolality, mosmol/kgH2O | 1 | 566 ± 25 | 556 ± 19 | 0.78 |
| 2 | 524 ± 16 | 517 ± 9 | 0.92 | |
| Sodium, mmol/day | 1 | 0.7 ± 0.2 | 0.7 ± 0.1 | 0.99 |
| 2 | 0.8 ± 0.2 | 0.8 ± 0.1 | 0.85 | |
| Potassium, mmol/day | 1 | 2.7 ± 0.3 | 2.2 ± 0.1 | 0.16 |
| 2 | 2.2 ± 0.2 | 2.2 ± 0.1 | 0.90 | |
| Chloride, mmol/day | 1 | 1.7 ± 0.2 | 1.6 ± 0.03 | 0.61 |
| 2 | 1.7 ± 0.2 | 1.5 ± 0.1 | 0.65 | |
| PGE, ng/day | 1 | 11.1 ± 2.2 | 9.4 ± 2.0 | 0.58 |
| 2 | 10.8 ± 2.0 | 9.5 ± 1.9 | 0.67 |
Values are means ± SE.
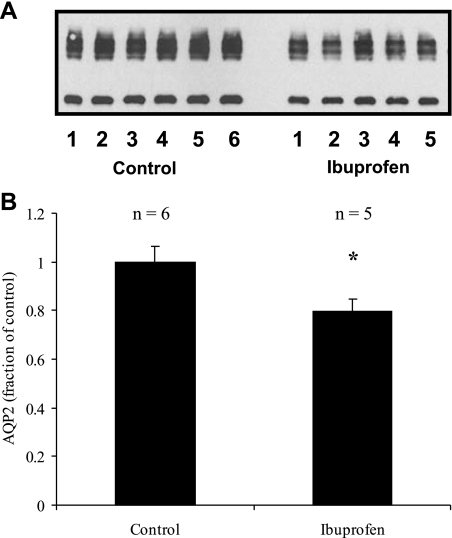
Figure 4 illustrates that at the end of the study there was still a modest, but statistically significant, 21% reduction (79 ± 5 vs. 100 ± 6%, P < 0.04, n = 6) in AQP2 expression in the ibuprofen-treated animals.
Fig. 4.
Effect of ibuprofen on AQP2 expression in fluid-loaded animals. A: representative immunoblot. B: summary of all data. Under these conditions, ibuprofen causes only a small (but statistically significant) decrease in AQP2 levels. *P < 0.05 with respect to control.
COX-2-selective NSAID meloxicam decreases AQP2 protein levels only in fluid-restricted animals, but has no effect on AQP2 mRNA levels.
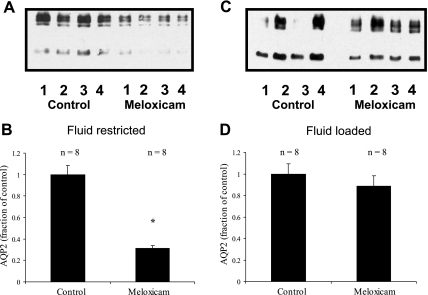
As summarized in Fig. 5, meloxicam treatment reduced AQP2 levels to 31 ± 3% of controls (100 ± 8%, n = 8 in each group, P < 0.01) in fluid-restricted animals, but had no significant effect (89 ± 9 vs. 100 ± 9%, n = 8 in each group, NS) in water-loaded animals.
Fig. 5.
Effect of meloxicam on AQP2 expression in fluid-restricted and fluid-loaded rats. A and C: representative immunoblots. B and D: summary of all data. In fluid-restricted animals, the cyclooxygenase (COX)-2-selective NSAID meloxicam caused a significant decrease in AQP2 expression closely comparable to the results with the nonselective ibuprofen and indomethacin. In contrast, meloxicam had no significant effect in fluid-loaded animals, suggesting that there is little COX-2 activity under these conditions. *P < 0.05 with respect to control.
As summarized in Tables 4 and 5, in neither the fluid-restricted nor the fluid-loaded state was urine output significantly different from equivalently treated controls. However, under fluid-loaded conditions, during the first 24 h of treatment with meloxicam, a significant decrease in the amount of PGE excreted was observed. In addition to this, there was a slight decrease in the urine osmolality of the meloxicam-treated animals on the final day of the study (533 ± 13 vs. 600 ± 22, P < 0.03, n = 8).
Table 4.
Effect of water restriction and meloxicam treatment on diuresis, urine osmolality, and excretion of salt and PGE
| Number of Days of Treatment | Fluid-Restricted Control | Fluid-Restricted Meloxicam | P Value | |
|---|---|---|---|---|
| Urine output, ml/day | 0 | 6.3 ± 0.5 | 6.5 ± 0.7 | 0.76 |
| 1 | 6.3 ± 0.8 | 6.0 ± 0.9 | 0.84 | |
| 2 | 5.6 ± 0.5 | 5.8 ± 0.5 | 0.86 | |
| Urine osmolality, mosmol/kgH2O | 0 | 2,470 ± 125 | 2,470 ± 276 | 1.00 |
| 1 | 2,604 ± 174 | 2,621 ± 384 | 0.97 | |
| 2 | 2,977 ± 137 | 2,611 ± 145 | 0.21 | |
| Sodium, mmol/day | 1 | 1.3 ± 0.1 | 1.3 ± 0.08 | 0.68 |
| 2 | 1.4 ± 0.1 | 1.4 ± 0.1 | 0.77 | |
| Potassium, mmol/day | 1 | 2.8 ± 0.1 | 2.5 ± 0.1 | 0.18 |
| 2 | 3.2 ± 0.3 | 2.7 ± 0.1 | 0.12 | |
| Chloride, mmol/day | 1 | 1.8 ± 0.1 | 1.6 ± 0.1 | 0.23 |
| 2 | 1.8 ± 0.2 | 1.8 ± 0.1 | 0.84 | |
| PGE, ng/day | 1 | 18.0 ± 4.8 | 20.1 ± 4.5 | 0.67 |
| 2 | 30.6 ± 6.4 | 25.8 ± 4.7 | 0.54 |
Values are means ± SE.
Table 5.
Effect of meloxicam and mild over-hydration on diuresis, osmolality, and excretion of salt and PGE
| Number of Days of Treatment | Fluid-Loaded Control | Fluid-Loaded Meloxicam | P Value | |
|---|---|---|---|---|
| Urine output, ml/day | 0 | 30 ± 1.2 | 29 ± 1.2 | 0.72 |
| 1 | 28 ± 1.8 | 25 ± 1.9 | 0.44 | |
| 2 | 29 ± 1.4 | 31 ± 1.8 | 0.27 | |
| Urine osmolality, mosmol/kgH2O | 0 | 578 ± 20 | 579 ± 24 | 0.97 |
| 1 | 631 ± 27 | 608 ± 29 | 0.57 | |
| 2 | 600 ± 22 | 533 ± 13 | 0.02 | |
| Sodium, mmol/day | 1 | 1.0 ± 0.1 | 1.0 ± 0.1 | 0.96 |
| 2 | 1.1 ± 0.1 | 1.3 ± 0.1 | 0.21 | |
| Potassium, mmol/day | 1 | 2.6 ± 0.1 | 2.2 ± 0.2 | 0.08 |
| 2 | 2.5 ± 0.1 | 2.6 ± 0.2 | 0.70 | |
| Chloride, mmol/day | 1 | 1.7 ± 0.1 | 1.4 ± 0.1 | <0.05 |
| 2 | 1.6 ± 0.1 | 1.6 ± 0.1 | 0.98 | |
| PGE, ng/day | 1 | 7.2 ± 0.5 | 4.8 ± 0.6 | <0.01 |
| 2 | 6.4 ± 1.0 | 5.7 ± 1.0 | 0.61 |
Values are means ± SE.
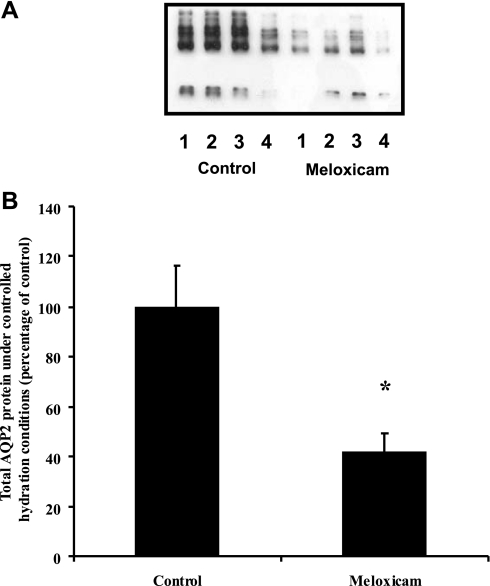
To test whether meloxicam could prevent the dehydration-induced increase in AQP2, rather than reversing an increase induced by prior water deprivation, animals were given 2 days of fluid loading (50 ml of water/day) and then treated with meloxicam while receiving 20 ml water/day for 4 days. Under these conditions, as summarized in Table 6, treatment with meloxicam did not alter urine output relative to the controls throughout the study. Additionally, no change in osmolality, or excretion of salt or PGE was observed. The decrease in AQP2 expression in the meloxicam-treated animals relative to control (41 ± 8 vs. 100 ± 17%, n = 8, P < 0.001), shown in Fig. 6, was not significantly different from the result obtained without the initial fluid-loading period (as shown in Fig. 5).
Table 6.
Effects of meloxicam under fluid-controlled conditions on diuresis, osmolality, and excretion of salt and PGE
| Number of Days of Treatment | Fluid-Loaded, Fluid-Restricted Control | Fluid-Loaded, Fluid-Restricted Meloxicam | P Value | |
|---|---|---|---|---|
| Urine output, ml/day | 1 | 9.5 ± 0.64 | 9.5 ± 1.04 | 1.0 |
| 2 | 7.25 ± 0.75 | 5.0 ± 1.0 | 0.12 | |
| 3 | 10 ± 0.91 | 8.25 ± 1.93 | 0.44 | |
| 4 | 11.25 ± 0.63 | 8.75 ± 1.6 | 0.20 | |
| Osmolality, mosmol/kgH2O | 1 | 1,963 ± 78.6 | 1,892 ± 69.5 | 0.51 |
| 2 | 2,309 ± 156.7 | 2,043 ± 142.2 | 0.23 | |
| 3 | 1,937.5 ± 100.7 | 1,910 ± 112.3 | 0.86 | |
| 4 | 1,909 ± 85.4 | 1,954.5 ± 134.7 | 0.78 | |
| Sodium, mmol/day | 1 | 1.3 ± 0.1 | 1.6 ± 0.2 | 0.32 |
| 2 | 1.2 ± 0.2 | 1.3 ± 0.1 | 0.73 | |
| 3 | 1.4 ± 0.3 | 1.5 ± 0.2 | 0.76 | |
| 4 | 1.4 ± 0.2 | 1.6 ± 0.1 | 0.32 | |
| Chloride, mmol/day | 1 | 1.5 ± 0.1 | 1.6 ± 0.1 | 0.90 |
| 2 | 1.3 ± 0.1 | 1.5 ± 0.1 | 0.19 | |
| 3 | 1.6 ± 0.2 | 1.6 ± 0.1 | 0.89 | |
| 4 | 1.6 ± 0.2 | 1.7 ± 0.1 | 0.55 | |
| Potassium, mmol/day | 1 | 2.7 ± 0.3 | 2.6 ± 0.3 | 0.71 |
| 2 | 2.7 ± 0.3 | 2.7 ± 0.1 | 0.85 | |
| 3 | 3.1 ± 0.5 | 3.3 ± 0.3 | 0.82 | |
| 4 | 3.0 ± 0.3 | 3.4 ± 0.3 | 0.32 | |
| PGE, ng/day | 1 | 20.0 ± 2.3 | 24.4 ± 1.7 | 0.14 |
| 2 | 25.5 ± 3.0 | 28.8 ± 2.4 | 0.41 | |
| 3 | 24.4 ± 2.7 | 27.9 ± 1.7 | 0.29 | |
| 4 | 26.5 ± 4.0 | 28.7 ± 3.2 | 0.69 |
Values are means ± SE.
Fig. 6.
Effect of meloxicam on total AQP2 protein expression under fluid-controlled conditions. A: representative immunoblot. B: summary of all data. Initial fluid loading followed by fluid restriction and meloxicam treatment resulted in a significant decrease in total AQP2 protein expression. *P < 0.05 with respect to control.
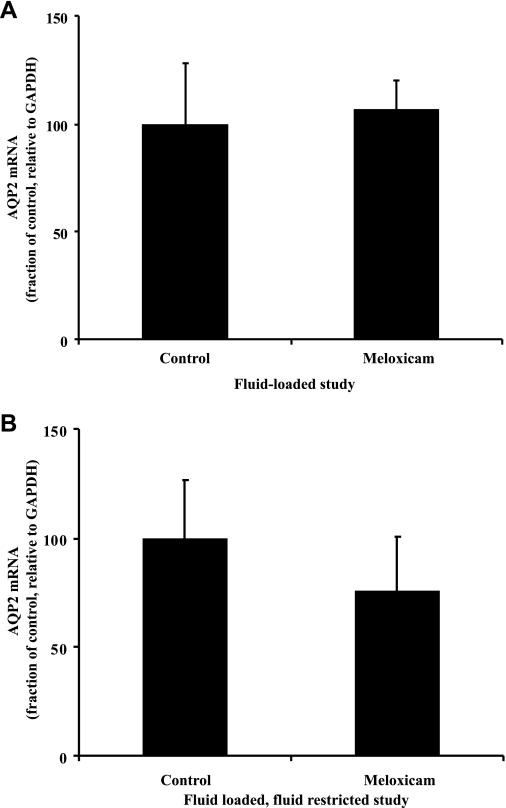
As shown in Fig. 7, there were no differences observed in AQP2 mRNA expression under fluid-loaded conditions between the meloxicam-treated and control animals (107 ± 13 vs. 100 ± 28%, n = 8, NS). Under fluid-restricted conditions, the AQP2 mRNA level was 75 ± 25% of control levels (100 ± 26%, n = 8). This was not significantly different from control; nor is it significantly different from the decrease seen in the protein levels, which could be considered a reasonable alternative null hypothesis. Thus it remains undecided whether the decrease in protein is reflected by a decrease in mRNA.
Fig. 7.
Effect of mild overhydration (A) or fluid restriction (B) and meloxicam treatment on AQP2 mRNA. Relative to GAPDH, AQP2 mRNA expression levels remained unchanged by meloxicam under either of these conditions.
DISCUSSION
The results of the present study demonstrate that treatment with NSAIDs causes a significant decrease in the protein abundance of AQP2 water channels in the renal medulla in normal and water-restricted rats. The effect is much less marked in water-loaded rats and is not seen with the COX-2-selective NSAID meloxicam. Furthermore, treatment with NSAIDs can prevent the increase in AQP2 protein abundance generally induced by water deprivation or water restriction (28). Since the COX-2-selective NSAID meloxicam also decreases AQP2 levels in fluid-restricted, but not well-hydrated, animals, the increase in prostaglandin synthesis during dehydration may be a consequence of the induction of COX-2 activity during dehydration. However, the lack of any significant decrease in urinary PGE after NSAID treatment raises the possibility that the effect is not mediated by a change in PG levels, or that a prostaglandin other than PGE is responsible. Since the AQP2 mRNA levels after treatment with meloxicam were not significantly different from either that seen in the control animals or the decrease seen in protein levels, it is difficult to draw any firm conclusions about whether the decrease in AQP2 protein reflects decreased transcription, decreased translation, increased degradation, or a combination of these elements.
As discussed above, there is strong evidence that alterations in AQP2 expression are important in both adaptive (4, 10, 21) and pathological (7, 12, 23, 25, 30, 39) situations. These studies indicate that vasopressin is one of the signals regulating AQP2 expression, via mRNA transcription, and presumably protein synthesis (40), but that it is not the only one. These results raise two questions: 1) what are the other signals that control AQP2 expression, and 2) how do these signals interact with vasopressin in the overall control of water balance? This study aimed to address the first of these questions. Because prostaglandins have been reported to be increased after vasopressin treatment (35), and in various acquired forms of NDI (14, 33, 36), and because NSAIDs are sometimes used in the management of NDI (18), our initial hypothesis was that increased prostaglandin synthesis might decrease AQP2 expression, and so we predicted that NSAID treatment might increase AQP2 levels. Our results are clearly not consistent with this hypothesis, since 1) we see a decrease in AQP2 levels after NSAID treatment, and 2) we do not see a significant decrease in PGE levels after NSAID treatment, suggesting that the effect on AQP2 levels may be mediated by some other effect of these drugs. Since several, structurally different, NSAIDs have been used, this latter possibility is perhaps less likely. In this context, it is interesting that we see different consequences with the COX-2-selective meloxicam, which has no effect in fluid-loaded animals, than with the nonselective ibuprofen, which does have a significant effect on AQP2 levels in such animals. The kidney is one of the few organs which express significant amounts of the inducible form of cyclooxygenase, COX-2 (15), and the observation that this induction can be brought about by dehydration (41) seems significant in our interpretation of the data presented here.
In summary, we have shown that treatment with NSAIDs, including the COX-2-selective meloxicam, decreases AQP2 levels in the renal inner medulla, especially during water deprivation. This may have important implications for clinical use of NSAIDs, particularly in patient groups, such as the elderly, who may have an impaired thirst mechanism or be otherwise susceptible to dehydration (22).
DISCLOSURES
No conflicts of interest are declared by the authors.
ACKNOWLEDGMENTS
The authors thank the UK Medical Research Council and Kidney Research UK for funding this work, Julie Higgins for outstanding technical assistance, and Mark Knepper for provision of his AQP2 antibody.
Present address for E. Baggaley: Faculty of Life Sciences, University of Manchester, Core Technology Facility, 46 Grafton St., Manchester M13 9NT, UK.
REFERENCES
- 1.Apostol E, Ecelbarger CA, Terris J, Bradford AD, Andrews P, Knepper MA. Reduced renal medullary water channel expression in puromycin aminonucleoside-induced nephrotic syndrome. J Am Soc Nephrol 8: 15–24, 1997 [DOI] [PubMed] [Google Scholar]
- 2.Asahina Y, Izumi N, Enomoto N, Sasaki S, Fushimi K, Marumo F, Sato C. Increased gene expression of water channel in cirrhotic rat kidneys. Hepatology 21: 169–173, 1995 [PubMed] [Google Scholar]
- 3.Christensen S, Kusano E, Yusufi AN, Murayama N, Dousa TP. Pathogenesis of nephrogenic diabetes insipidus due to chronic administration of lithium in rats. J Clin Invest 75: 1869–1879, 1985 [DOI] [PMC free article] [PubMed] [Google Scholar]
- 3a.Chomczynski P, Sacchi N. Single-step method of RNA isolation by acid guanidinium thiocyanate-phenol-chloroform extraction. Anal Biochem 162: 156–159, 1987 [DOI] [PubMed] [Google Scholar]
- 4.De Wardener HE, Herxheimer A. The effect of a high water intake on the kidney's ability to concentrate the urine in man. J Physiol 139: 42–52, 1957 [DOI] [PMC free article] [PubMed] [Google Scholar]
- 5.DiGiovanni SR, Nielsen S, Christensen EI, Knepper MA. Regulation of collecting duct water channel expression by vasopressin in Brattleboro rat. Proc Natl Acad Sci USA 91: 8984–8988, 1994 [DOI] [PMC free article] [PubMed] [Google Scholar]
- 6.Dusing R, Attallah AA, Prezyna AP, Lee JB. Renal biosynthesis of prostaglandin E2 and F2alpha: dependence on extracellular potassium. J Lab Clin Med 92: 669–677, 1978 [PubMed] [Google Scholar]
- 7.Earm JH, Christensen BM, Frokiaer J, Marples D, Han JS, Knepper MA, Nielsen S. Decreased aquaporin-2 expression and apical plasma membrane delivery in kidney collecting ducts of polyuric hypercalcemic rats. J Am Soc Nephrol 9: 2181–2193, 1998 [DOI] [PubMed] [Google Scholar]
- 8.Ecelbarger CA, Nielsen S, Olson BR, Murase T, Baker EA, Knepper MA, Verbalis JG. Role of renal aquaporins in escape from vasopressin-induced antidiuresis in rat. J Clin Invest 99: 1852–1863, 1997 [DOI] [PMC free article] [PubMed] [Google Scholar]
- 9.Ecelbarger CA, Chou CL, Lee AJ, DiGiovanni SR, Verbalis JG, Knepper MA. Escape from vasopressin-induced antidiuresis: role of vasopressin resistance of the collecting duct. Am J Physiol Renal Physiol 274: F1161–F1166, 1998 [DOI] [PubMed] [Google Scholar]
- 10.Epstein FH, Kleeman CR, Hendrikx A. The influence of bodily hydration on the renal concentrating process. J Clin Invest 36: 629–634, 1957 [DOI] [PMC free article] [PubMed] [Google Scholar]
- 11.Fernandez-Llama P, Andrews P, Nielsen S, Ecelbarger CA, Knepper MA. Impaired aquaporin and urea transporter expression in rats with adriamycin-induced nephrotic syndrome. Kidney Int 53: 1244–1253, 1998 [DOI] [PubMed] [Google Scholar]
- 12.Frokiaer J, Marples D, Knepper MA, Nielsen S. Bilateral ureteral obstruction downregulates expression of vasopressin-sensitive AQP-2 water channel in rat kidney. Am J Physiol Renal Fluid Electrolyte Physiol 270: F657–F668, 1996 [DOI] [PubMed] [Google Scholar]
- 13.Fushimi K, Uchida S, Hara Y, Hirata Y, Marumo F, Sasaki S. Cloning and expression of apical membrane water channel of rat kidney collecting tubule. Nature 361: 549–552, 1993 [DOI] [PubMed] [Google Scholar]
- 14.Gullner HG, Graf AK, Gill JR, Mitchell MD. Hypokalaemia stimulates prostacyclin synthesis in the rat. Clin Sci 65: 43–46, 1983 [DOI] [PubMed] [Google Scholar]
- 15.Harris RC, McKanna JA, Akai Y, Jacobson HR, Dubois RN, Breyer MD. Cyclooxygenase-2 is associated with the macula densa of rat kidney and increases with salt restriction. J Clin Invest 94: 2504–2510, 1994 [DOI] [PMC free article] [PubMed] [Google Scholar]
- 16.Hasler U, Vinciguerra M, Vandewalle A, Martin PY, Feraille E. Dual effects of hypertonicity on aquaporin-2 expression in cultured renal collecting duct principal cells. J Am Soc Nephrol 16: 1571–1582, 2005 [DOI] [PubMed] [Google Scholar]
- 17.Hebert RL, Jacobson HR, Fredin D, Breyer MD. Evidence that separate PGE2 receptors modulate water and sodium transport in rabbit cortical collecting duct. Am J Physiol Renal Fluid Electrolyte Physiol 265: F643–F650, 1993 [DOI] [PubMed] [Google Scholar]
- 18.Jia Z, Wang H, Yang T. Mice lacking mPGES-1 are resistant to lithium-induced polyuria. Am J Physiol Renal Physiol 297: F1689–F1696, 2009 [DOI] [PMC free article] [PubMed] [Google Scholar]
- 19.Kasono K, Saito T, Saito T, Tamemoto H, Yanagidate C, Uchida S, Kawakami M, Sasaki S, Ishikawa SE, Kasono K, Saito T, Saito T, Tamemoto H, Yanagidate C, Uchida S, Kawakami M, Sasaki S, Ishikawa S. Hypertonicity regulates the aquaporin-2 promoter independently of arginine vasopressin. Nephrol Dial Transplant 20: 509–515, 2005 [DOI] [PubMed] [Google Scholar]
- 20.Kenny GN. Potential renal, haematological and allergic adverse effects associated with nonsteroidal anti-inflammatory drugs. Drugs 44, Suppl 5: 31–36, 1992 [DOI] [PubMed] [Google Scholar]
- 21.Lankford SP, Chou CL, Terada Y, Wall SM, Wade JB, Knepper MA. Regulation of collecting duct water permeability independent of cAMP-mediated AVP response. Am J Physiol Renal Fluid Electrolyte Physiol 261: F554–F566, 1991 [DOI] [PubMed] [Google Scholar]
- 22.Luckey AE, Parsa CJ. Fluid and electrolytes in the aged. Arch Surg 138: 1055–1060, 2003 [DOI] [PubMed] [Google Scholar]
- 23.Marples D, Christensen S, Christensen EI, Ottosen PD, Nielsen S. Lithium induced downregulation of aquaporin-2 water channel expression in rat kidney medulla. J Clin Invest 95: 1838–1845, 1995 [DOI] [PMC free article] [PubMed] [Google Scholar]
- 24.Marples D, Knepper MA, Christensen EI, Nielsen S. Redistribution of aquaporin-2 water channels induced by vasopressin in rat kidney inner medullary collecting duct. Am J Physiol Cell Physiol 269: C655–C664, 1995 [DOI] [PubMed] [Google Scholar]
- 25.Marples D, Frokiaer J, Dorup J, Knepper MA, Nielsen S. Hypokalemia induced downregulation of aquaporin-2 water channel expression in rat kidney medulla and cortex. J Clin Invest 97: 1960–1968, 1996 [DOI] [PMC free article] [PubMed] [Google Scholar]
- 26.Murase T, Tian Y, Fang XY, Verbalis JG. Synergistic effects of nitric oxide and prostaglandins on renal escape from vasopressin-induced antidiuresis. Am J Physiol Regul Integr Comp Physiol 284: R354–R362, 2003 [DOI] [PubMed] [Google Scholar]
- 27.Nadler SP, Hebert SC, Brenner BM. PGE2, forskolin, and cholera toxin interactions in rabbit cortical collecting tubule. Am J Physiol Renal Fluid Electrolyte Physiol 250: F127–F135, 1986 [DOI] [PubMed] [Google Scholar]
- 28.Nielsen S, DiGiovanni SR, Christensen EI, Knepper MA, Harris HW. Cellular and subcellular immunolocalization of vasopressin-regulated water channel in rat kidney. Proc Natl Acad Sci USA 90: 11663–11667, 1993 [DOI] [PMC free article] [PubMed] [Google Scholar]
- 29.Nielsen S, Chou CL, Marples D, Christensen EI, Kishore BK, Knepper MA. Vasopressin increases water permeability of kidney collecting duct by inducing translocation of aquaporin-CD water channels to plasma membrane. Proc Natl Acad Sci USA 92: 1013–1017, 1995 [DOI] [PMC free article] [PubMed] [Google Scholar]
- 30.Nielsen S, Terris J, Andersen D, Ecelbarger C, Frokiaer J, Jonassen T, Marples D, Knepper MA, Petersen JS. Congestive heart failure in rats is associated with increased expression and targeting of aquaporin2 water channel in collecting duct. Proc Natl Acad Sci USA 94: 5450–5455, 1997 [DOI] [PMC free article] [PubMed] [Google Scholar]
- 31.Ohara M, Martin PY, Xu DL, St John J, Pattison TA, Kim JK, Schrier RW. Upregulation of aquaporin 2 water channel expression in pregnant rats. J Clin Invest 101: 1076–1083, 1998 [DOI] [PMC free article] [PubMed] [Google Scholar]
- 32.Olsen UB, Ahnfelt-Ronne I. Bumetanide induced increase of renal blood flow in conscious dogs and its relation to local renal hormones (PGE, kallikrein and renin). Acta Pharmacol Toxicol (Copenh) 38: 219–228, 1976 [DOI] [PubMed] [Google Scholar]
- 33.Olsen UB, Magnussen MP, Eilertsen E. Prostaglandins, a link between renal hydro- and hemodynamic in dogs. Acta Physiol Scand 97: 369–376, 1976 [DOI] [PubMed] [Google Scholar]
- 34.Sabolic I, Katsura T, Verbavatz JM, Brown D. The AQP2 water channel: effect of vasopressin treatment, microtubule disruption, and distribution in neonatal rats. J Membr Biol 143: 165–175, 1995 [DOI] [PubMed] [Google Scholar]
- 35.Smith WL. Prostanoid biosynthesis and mechanisms of action. Am J Physiol Renal Fluid Electrolyte Physiol 263: F181–F191, 1992 [DOI] [PubMed] [Google Scholar]
- 36.Sugawara M, Hashimoto K, Ota Z. Involvement of prostaglandin E2, cAMP, and vasopressin in lithium-induced polyuria. Am J Physiol Regul Integr Comp Physiol 254: R863–R869, 1988 [DOI] [PubMed] [Google Scholar]
- 37.Terris J, Ecelbarger CA, Nielsen S, Knepper MA. Long-term regulation of four renal aquaporins in rats. Am J Physiol Renal Fluid Electrolyte Physiol 271: F414–F422, 1996 [DOI] [PubMed] [Google Scholar]
- 38.Uchida S, Sasaki S, Fushimi K, Marumo F. Isolation of human aquaporin-CD gene. J Biol Chem 269: 23451–23455, 1994 [PubMed] [Google Scholar]
- 39.Xu DL, Martin PY, Ohara M, St. John J, Pattison T, Meng X, Morris K, Kim JK, Schrier RW. Upregulation of aquaporin-2 water channel expression in chronic heart failure rat. J Clin Invest 99: 1500–1505, 1997 [DOI] [PMC free article] [PubMed] [Google Scholar]
- 40.Yamamoto T, Sasaki S, Fushimi K, Kawasaki K, Yaoita E, Oota K, Hirata Y, Marumo F, Kihara I. Localization and expression of a collecting duct water channel, aquaporin, in hydrated and dehydrated rats. Exp Nephrol 3: 193–201, 1995 [PubMed] [Google Scholar]
- 41.Yang T, Schnermann JB, Briggs JP, Yang T, Schnermann JB, Briggs JP. Regulation of cyclooxygenase-2 expression in renal medulla by tonicity in vivo and in vitro. Am J Physiol Renal Physiol 277: F1–F9, 1999. [DOI] [PubMed] [Google Scholar]


