Abstract
We hypothesized that hypoxia would activate epidermal growth factor receptor (EGFR) tyrosine kinase, leading to increased arginase expression and resulting in proliferation of human pulmonary microvascular endothelial cell (hPMVEC). To test this hypothesis, hPMVEC were incubated in normoxia (20% O2, 5% CO2) or hypoxia (1% O2, 5% CO2). Immunoblotting for EGFR and proliferating cell nuclear antigen was done, and protein levels of both total EGFR and proliferating cell nuclear antigen were greater in hypoxic hPMVEC than in normoxic hPMVEC. Furthermore, hypoxic hPMVEC had greater levels of EGFR activity than did normoxic hPMVEC. Hypoxic hPMVEC had a twofold greater level of proliferation compared with normoxic controls, and this increase in proliferation was prevented by the addition of AG-1478 (a pharmacological inhibitor of EGFR). Immunoblotting for arginase I and arginase II demonstrated a threefold induction in arginase II protein levels in hypoxia, with little change in arginase I protein levels. The hypoxic induction of arginase II protein was prevented by treatment with AG-1478. Proliferation assays were performed in the presence of arginase inhibitors, and hypoxia-induced proliferation was also prevented by arginase inhibition. Finally, treatment with an EGFR small interfering RNA prevented hypoxia-induced proliferation and urea production. These findings demonstrate that hypoxia activates EGFR tyrosine kinase, leading to arginase expression and thereby promoting proliferation in hPMVEC.
Keywords: vascular remodeling, l-arginine, pulmonary hypertension
we have previously shown that epidermal growth factor (EGF) receptor (EGFR) activity is essential for cytokine-induced arginase expression in pulmonary arterial endothelial cells (20). Arginase (EC 3.5.3.1) is a hydrolytic enzyme that catalyzes the conversion of l-arginine to l-ornithine and urea (21). The l-ornithine produced by arginase can be further metabolized by ornithine decarboxylase and/or ornithine aminotransferase to produce polyamines and/or proline, respectively. Polyamines and proline are vital for cellular proliferation (23–25). Overexpression of arginase has been shown to enhance cellular proliferation (14, 16), while inhibiting arginase has been shown to decrease cellular proliferation (2, 27). Furthermore, arginase competes with nitric oxide synthase for their common substrate l-arginine (5, 8, 20, 26), such that, when arginase activity is increased, the production of the important vasodilator nitric oxide is decreased, contributing to vasoconstriction and pulmonary hypertension. Thus increased arginase activity in the pulmonary vasculature may enhance cellular proliferation and promote vasoconstriction. We hypothesized that hypoxia would lead to EGFR activation, resulting in greater arginase expression in human pulmonary microvascular endothelial cells (hPMVEC) and thereby greater cellular proliferation. To test our hypothesis, we studied hPMVEC incubated in either normoxia or hypoxia. The levels of EGFR, proliferating cell nuclear antigen (PCNA), arginase I, and arginase II were determined by immunoblotting. EGFR activity assays were performed. Proliferation assays were done to determine numbers of viable cells. Pharmacological inhibitors of EGFR or arginase were employed in the various experiments. We also studied the effect of EGFR inhibition using specific EGFR small interfering RNA (siRNA).
METHODS
hPMVEC culture.
The hPMVEC were obtained from Lonza (Allendale, NJ) and were cultured in endothelial growth media (EGM; Lonza), containing 10% fetal bovine serum, as previously described (19, 20). hPMVEC between passages 3 and 8 were used for these studies. On the day of study, hPMVEC were washed three times with 4 ml of HEPES balanced salt solution (Lonza). Then 5 ml of EGM were placed on the hPMVEC, and the hPMVEC were returned to the incubator at 37°C in either 5% CO2, balance air (normoxia), or 5% CO2, 1% O2, balance N2 (hypoxia) for 24 h. Depending on the experimental protocol, 50 ng/ml EGF (Sigma, St. Louis, MO), 30 nM AG-1478 (Calbiochem, San Diego, CA), 100 μM S-(2-boronoethyl)-l-cysteine (BEC; Cayman Chemical, Ann Arbor, MI), 100 mM α-difluoromethylornithine (DFMO; Cayman Chemical), 100 μM Nω-hydroxy-arginine (NOHA; Cayman Chemical), or vehicle were included in the EGM medium, such that all treatments were added at time 0, the start of the exposure to either normoxia or hypoxia, of the given experiment. At the end of the experimental period, the media was harvested and stored in 1-ml aliquots, frozen at −80°C.
hPMVEC protein isolation.
Protein was isolated from the hPMVEC, as previously described (6). Briefly, hPMVEC were washed twice with ice-cold HEPES buffer and 500 μl lysis buffer (0.2 M NaOH, 0.2% SDS with the following added to each milliliter 30 min before use: 1 μg aprotinin, 1 μg leupeptin, 1 μg pepstatin A, and 1 μg phenylmethylsulfonyl fluoride) were placed on the cells. The hPMVEC were scraped, and 100-μl aliquots were stored at −80°C for subsequent Western blot analysis. Total protein concentration was determined by the Bradford method (BioRad, Hercules, CA).
Immunoblotting.
The hPMVEC cell lysate was assayed for protein levels of EGFR, PCNA, arginase I, and arginase II using immunoblot analysis, as previously described (20, 26). Aliquots of cell lysate were diluted with 10-μl SDS sample buffer, 4-μl reducing agent, and appropriate amounts of deionized water. The samples were then heated to 80°C for 10 min, and then separated using SDS-PAGE gel electrophoresis. The proteins were transferred to polyvinylidene difluoride membranes, and blocked overnight in Tris-buffered saline with 0.1% Tween (TBS-T) containing 5% skim milk. The following day, the membranes were washed four times and then incubated with primary antibody against total EGFR (1:500; Santa Cruz Biotechnology, Santa Cruz, CA), PCNA (1:5,000; AbCam, Cambridge, MA), arginase I, or arginase II (both 1:500; Santa Cruz Biotechnology). The membranes were washed four times with TBS-T and incubated with goat anti-rabbit IgG horseradish peroxidase (HRP) conjugated secondary antibody (1:10,000; Bio-Rad) for 1 h and then washed four times with TBS-T. The bands for total EGFR, PCNA, arginase I, or arginase II were visualized using chemiluminescence (Amersham ECL, Piscataway, NJ) and quantified using densitometry (Total Lab gel analysis; Biosystematica). To control for protein loading, the blots were stripped and reprobed for β-actin using a monoclonal antibody (1:5,000; Abcam).
Tyrosine kinase activity.
A two-step peptide phosphorylation/colorimetric detection assay kit (Upstate Cell Signaling, Lake Placid, NY) was used. In the first stage, a biotinylated substrate peptide containing tandem repeats of poly (Glu4-Tyr) was incubated with lysates from cells that had been exposed to either hypoxia or normoxia for 24 h while treated with vehicle or AG-1478 in the presence of nonradioactive ATP and a Mn2+/Mg2+ cofactor cocktail. The second step involved detection of phosphorylated substrate by direct enzyme linked immunosorbent assay using a monoclonal anti-phosphotyrosine-HRP antibody conjugate. Tetramethylbenzidine was used as the HRP substrate. The absorbance in each well was measured using a spectrophotometric plate reader at 450 nm.
Proliferation assays.
Proliferation assays were done as previously described (26). The same number of cultured hPMVECs were plated into each well of six-well plates. The appropriate treatments were included in the media, and the cells were placed in either hypoxia or normoxia for a period of 24 or 48 h. At the end of the experimental protocol, the cells were removed from the incubator, and plates were washed three times with HBSS. After the final wash, 1 ml of trypsin was added to each well. The plates were incubated for ∼3 min, followed by the addition of 2 ml trypsin neutralizing solution. The cells from each well were placed in 15-ml conical tubes. The cells were centrifuged for 5 min at 1,220 g at 4°C. The supernatant was discarded, and the cells were resuspended in 1 ml of EGM. The cells were mixed 1:1 with Trypan blue, and viable cells were counted using a hemocytometer.
Real-time PCR.
RNA was isolated from hPMVEC using Trizol (Invitrogen, Carlsbad, CA). DNase treatment was performed on all samples using RNase-free DNase (Super Array, SA Biosciences, Frederick, MD), followed by reverse transcription (Promega, Madison, WI) and then analysis of cDNA by real-time PCR using SYBRgreen jumpstart Taq (Sigma). Primers were ordered from Integrated DNA Technologies (Coralville, IA) using the following sequences for human EGFR-forward primer: 5′ TTTGCTGATTCAGGCTTGG 3′; reverse primer: 5′ AGAAAACTGACCATGTTGCTTG 3′. 18S was amplified using the forward primer (5′ CCAGAGCGAAAGCATTTGCCAAGA 3′) and the reverse primer (5′ TCGGCATCGTTTATGGTCGGAACT 3′). For each reaction, negative controls containing reaction mixture and primers without cDNA were performed to verify that primers and reaction mixtures were free of template contamination. Relative EGFR amounts were normalized to 18S expression using the ΔΔCT method (17). All samples were analyzed in duplicate. Data are shown as fold-change relative to normoxia-exposed hPMVEC controls at each respective time point.
Urea assays.
The samples of medium were assayed in triplicate for urea concentration colorimeterically, as previously described (6, 20). Briefly, 100 μl of sample were added to 3 ml of chromogenic reagent [5 mg thiosemicarbazide, 250 mg diacetyl monoxime, 37.5 mg FeCl3 in 150 ml 25% (vol/vol) H2SO4, 20% (vol/vol) H3PO4]. After 1 h at 37°C, the mixtures were vortexed and then boiled at 100°C for 5 min. The mixtures were cooled to room temperature, and the absorbance (530 nm) was determined and compared with a urea standard curve.
Statistical analysis.
Values are expressed as the means ± SE. One-way ANOVA was used to compare groups, and differences between groups were identified using a Student-Neuman-Keuls post hoc test (SigmaStat 3.5, Jandel Scientific, Carlsbad, CA). The slopes of the regression lines shown in Fig. 1 were compared using covariance analysis and a t-test. Differences were considered significant when P < 0.05.
Fig. 1.
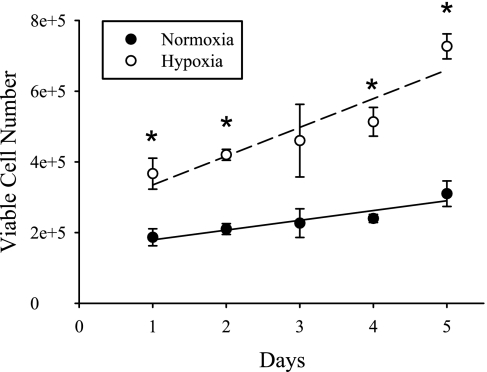
Time course of human pulmonary microvascular endothelial cell (hPMVEC) proliferation in normoxia and hypoxia. hPMVEC were seeded in six-well plates, with 85,000 cells in each well. After 1, 2, 3, 4, or 5 days, cells were harvested and counted for viable cell numbers using Trypan blue exclusion. The number of viable hPMVEC was greater in hypoxia (○) than in normoxia (●) on days 1, 2, 4, and 5. The growth rates of both the normoxic and hypoxic cells could be fit using linear regression. The equation for the fit of the normoxic hPMVEC was y = 27,667x + 151,667 (r = 0.94, P < 0.05), and the equation for the fit of the hypoxic hPMVEC was y = 81,333x + 253,333 (r = 0.94, P < 0.05). Both normoxic and hypoxic hPMVEC showed a positive correlation between viable cell number and day in culture. The slope for the hypoxic hPMVEC was greater (P < 0.05) than the slope for the normoxic hPMVEC by covariance analysis.
RESULTS
Time course of hPMVEC proliferation.
To determine the time course of cellular proliferation in the normoxic and hypoxic hPMVEC, the following experiment was performed. The cells were seeded into six-well plates, and, after 1, 2, 3, 4, or 5 days, the cells were harvested and counted using Trypan blue exclusion. Cell proliferation tended to be linear in both groups and was greater in the hypoxic cells (Fig. 1). These studies suggest that, under these experimental conditions, the hypoxia-induced greater cellular proliferation is evidenced after 24 h and is maintained during the full 5-day incubation period (Fig. 1).
EGF treatment increased cellular proliferation.
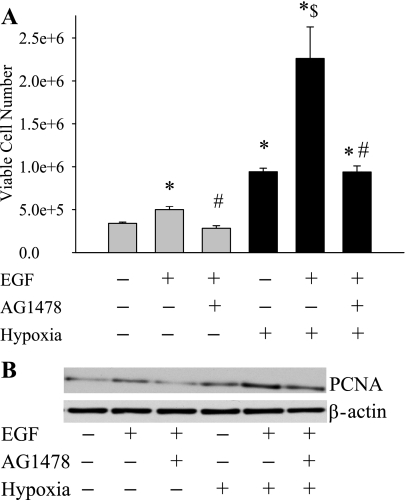
To determine the role of EGFR activation on hPMVEC proliferation, we first performed studies using one of its specific ligands, EGF. The hPMVEC were treated with either EGF (50 ng/ml), EGF + AG-1478 (30 nM), or vehicle and then placed immediately in either normoxia or hypoxia. After 48 h, the number of viable cells were counted using Trypan blue exclusion (n = 12 in each group). EGF treatment resulted in increased cell numbers in normoxia and, as expected, treatment with AG-1478 prevented the EGF-induced increase in cell number in normoxia (Fig. 2A). Hypoxia alone resulted in a doubling of cell number compared with normoxia alone (Fig. 2A). EGF treatment during hypoxic exposure resulted in a threefold increase in cell number compared with hypoxia alone, and the EGF-induced increase in hypoxic cell number was completely prevented by treatment with AG-1478 (Fig. 2A). We also performed immunoblotting with an antibody against PCNA, a marker of proliferating cells. Cells were treated with vehicle, EGF, or EGF + AG-1478 during a 24-h incubation in either normoxia or hypoxia, and then the protein was isolated. The PCNA protein levels were greater in hPMVEC treated with EGF than in vehicle-treated cells, and the EGFR-induced increase in PCNA was prevented by AG-1478 (Fig. 2B). The EGF-induced increase in PCNA was greater in cells incubated in hypoxia than in cells incubated in normoxia (Fig. 2B). Moreover, hypoxic exposure alone resulted in greater PCNA protein levels than in cells incubated in normoxia (Fig. 2B).
Fig. 2.
Treatment of hPMVEC with epidermal growth factor (EGF) increased cell proliferation, and this EGF-induced increase in proliferation was prevented by EGF receptor (EGFR) inhibition. A: each well in a six-well plate was seeded with 90,000 cells. The cells were treated with vehicle, EGF (50 ng/ml), or EGF + AG-1478 (30 nM) and incubated for 48 h in either normoxia (shaded bars) or hypoxia (solid bars). The number of viable cells was then counted using Trypan blue exclusion. *Different from vehicle-treated normoxia, P < 0.05. $Hypoxia EGF treated different from vehicle-treated hypoxia, P < 0.05. #EGF + AG-1478 different from EGF alone with the same condition, P < 0.05. B: proliferating cell nuclear antigen (PCNA) expression is increased in hypoxia. A representative immunoblot for PCNA expression in hPMVECs treated with either vehicle, EGF (50 ng/ml), or EGF + AG-1478 (30 nM) and then placed either in normoxia or hypoxia for 24 h is shown. The blot was stripped and reprobed with an antibody against β-actin. The experiment was repeated three times.
Hypoxia increased EGFR protein and mRNA expression.
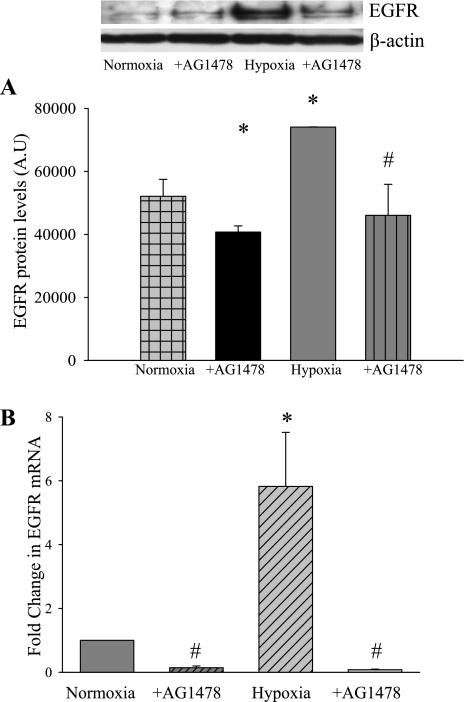
To determine the effect of hypoxia on EGFR expression, hPMVEC were treated with either AG-1478 or vehicle (n = 4 in each group) and then placed immediately in either normoxia or hypoxia for 24 h. The cell lysates were used in immunoblot analysis for total EGFR protein levels. Hypoxia resulted in greater total EGFR protein levels than in hPMVEC incubated in normoxia (Fig. 3A). Treatment with AG-1478 prevented the hypoxia-induced increase in total EGFR protein levels (Fig. 3A). In a second set of exposures, RNA was collected as described in methods. The RNA was utilized for real-time PCR using primers for human EGFR. EGFR expression was normalized to 18S rRNA using the ΔΔCT method and then expressed as fold change from normoxia. Hypoxia resulted in a significant increase in EGFR mRNA levels (Fig. 3B). Interestingly, addition of AG-1478 not only prevented the hypoxia-induced increase in EGFR mRNA levels, but also significantly reduced EGFR mRNA levels in normoxic cells (Fig. 3B).
Fig. 3.
Total EGFR protein levels increase in hypoxia. A: hPMVEC were treated with either AG-1478 (30 nM) or vehicle (n = 4 in each group) and incubated in either normoxia or hypoxia for 24 h. The cell lysates were used in immunoblot analysis for total EGFR protein levels. B: EGFR mRNA levels increase in hypoxia. In a second set of exposures, RNA was collected and utilized for real-time PCR using primers for human EGFR. EGFR expression was normalized to 18S rRNA using the ΔΔCT method and expressed as fold change from normoxia. AU, arbitrary units. *Vehicle-treated hypoxia is different from vehicle-treated normoxia, P < 0.05. #AG-1478 is different from vehicle treated for the same condition, P < 0.05.
Hypoxia increased EGFR activity.
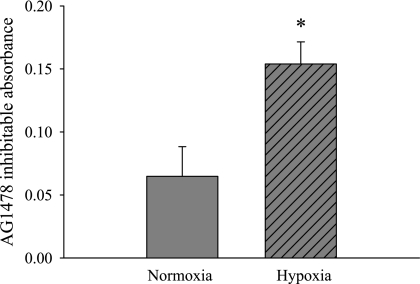
To determine the effect of hypoxia on EGFR tyrosine kinase activity, the following experiment was done. hPMVEC were incubated in either normoxia or hypoxia for 24 h. The cell lysates were then used in a tyrosine kinase activity assay. We took duplicate samples and added either vehicle or AG-1478 during the assay. In this way, the difference between duplicate wells, i.e., the absorbance of the vehicle-treated well minus the absorbance of the AG-1478-treated well, was a measure of EGFR tyrosine kinase activity. The lysates from hypoxic hPMVEC had significantly greater AG-1478-inhibitable tyrosine kinase activity than did the lysates from normoxic hPMVEC (Fig. 4).
Fig. 4.
Hypoxic hPMVEC lysates have greater AG-1478-inhibitable tyrosine kinase activity than lysates from normoxic hPMVEC. Cell lysates from hPMVEC incubated in either normoxia or hypoxia for 24 h were used in a tyrosine kinase activity assay. Duplicate samples were treated with either vehicle or AG-1478, and the difference between the absorbance of the vehicle-treated well and the AG-1478-treated well was referred to as the AG-1478-inhibitable absorbance and is a measure of EGFR tyrosine kinase activity. *Hypoxic hPMVEC lysates different from normoxic hPMVEC lysates, P < 0.05.
AG-1478 prevents the hypoxia-induced increase in cellular proliferation.
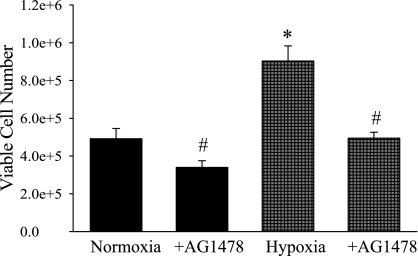
To study the effects of inhibition of EGFR on hypoxia-induced cellular proliferation, hPMVEC were treated with AG-1478 (30 nM) or vehicle and immediately placed in either hypoxia or normoxia for 24 h. Viable cell numbers were counted using Trypan blue exclusion. Incubating hPMVEC in hypoxia resulted in an approximate doubling of viable cell number compared with hPMVEC incubated in normoxia (Fig. 5). Furthermore, the hypoxia-induced increase in viable cell number was prevented by treatment with AG-1478 (Fig. 5).
Fig. 5.
hPMVEC have greater cellular proliferation in hypoxia, and this hypoxia-induced proliferation was prevented by the EGFR inhibitor AG-1478. Proliferation assay were performed, starting with ∼165,000 cells in each well of a six-well plate. The hPMVECs were treated with AG-1478 (30 nM) or vehicle and then incubated in either normoxia (solid bars) or hypoxia (shaded checked bars) for 48 h. The number of viable cells was then counted using Trypan blue exclusion. *Hypoxia vehicle treated different from vehicle-treated normoxia, P < 0.05. #AG-1478 different from vehicle treated for the same condition, P < 0.01.
Arginase II expression and urea production is increased in hypoxia.
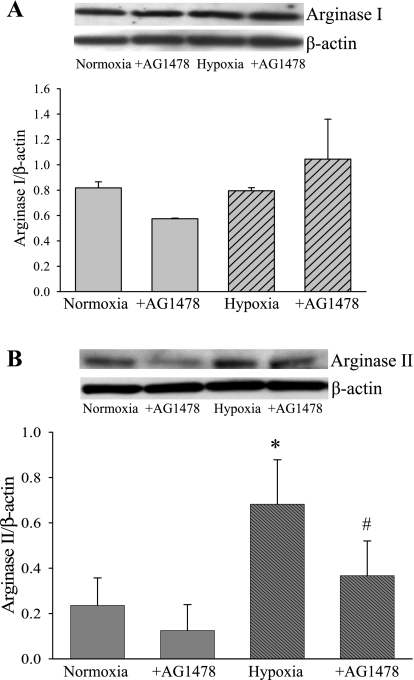
To test the hypothesis that hypoxia would increase arginase protein expression and that hypoxic induction of arginase would depend on EGFR, cell lysates from hPMVEC were treated with either vehicle or AG-1478 (30 nM) (n = 4 for each sample) and immediately placed in either normoxia or hypoxia for 24 h. The cell lysates were used in immunoblot analyses with antibodies specific for either arginase I or arginase II. Arginase I protein levels were not significantly different between the four experimental conditions (Fig. 6A). On the other hand, arginase II protein levels were approximately threefold greater in hPMVEC incubated in hypoxia than in the cells incubated in normoxia (Fig. 6B). Furthermore, in hPMVEC incubated in hypoxia and treated with AG-1478, the arginase II protein levels were significantly lower than in the hypoxic cells, and the arginase II protein levels were not different from those found in normoxic cells (Fig. 6B).
Fig. 6.
Arginase II is increased in hypoxia, and this hypoxia-induced increase in protein expression was attenuated by the EGFR inhibitor AG-1478. A: hypoxia has no effect on arginase I protein levels. Top: representative immunoblot from hPMVEC incubated with vehicle or 30 nM AG-1478 and placed in normoxia and hypoxia for 24 h. Bottom: graph of the mean densitometry data that were obtained from arginase I Western blotting analysis. B: hypoxia increased arginase II protein levels. Top: representative arginase II immunoblotting. Bottom: graph of the mean densitometry data obtained from arginase II immunoblot. *Vehicle-treated hypoxia different from vehicle-treated normoxia, P < 0.05. #AG-1478-treated cells significantly different from vehicle-treated cells in same condition, P < 0.05.
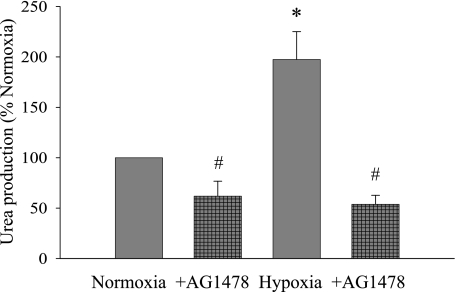
To determine the effect of hypoxia-induced arginase II protein levels on arginase activity, we analyzed urea production in the hPMVEC. Medium was collected from cells treated with AG-1478 (30 nM) or vehicle (n = 6 for each sample) and immediately placed in hypoxia or normoxia for 24 h. Corresponding to the pattern of changes observed in arginase II protein levels, urea production was greater in hypoxic cells than in cells incubated in normoxia, and the hypoxia-induced increase in urea production was prevented by the addition of AG-1478 (Fig. 7).
Fig. 7.
Urea production is increased in hypoxia, and this hypoxia-induced increase was prevented by the EGFR inhibitor AG-1478. Medium was collected from cells treated with AG-1478 (30 nM) or vehicle (n = 6 for each sample) and incubated in hypoxia or normoxia for 24 h. *Vehicle-treated cells in hypoxia different from normoxic vehicle-treated cells, P < 0.05. #AG-1478-treated cells different from vehicle-treated cells for the same condition, P < 0.05.
Arginase inhibition prevents hypoxia-induced proliferation.
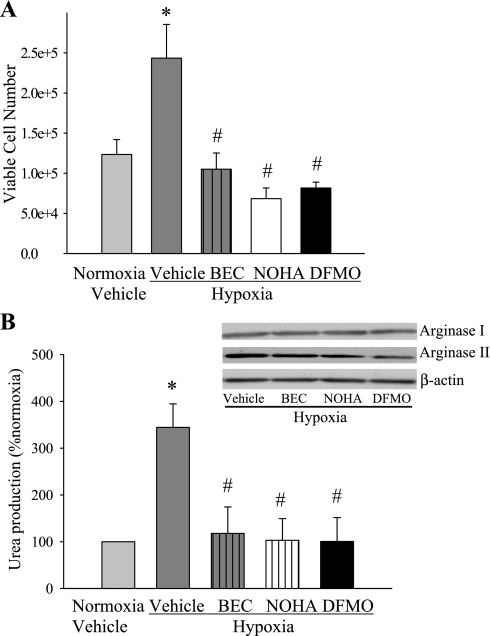
To determine the role of arginase in hypoxia-induced hPMVEC proliferation, we tested the hypothesis that arginase inhibition would prevent hypoxia-induced proliferation. hPMVEC were treated with three different arginase inhibitors (BEC, DFMO, and NOHA) or vehicle (n = 4 for each sample) and incubated in hypoxia; a set of vehicle-treated cells were also incubated in normoxia. The hypoxia-induced increase in cell proliferation was prevented by the addition of BEC, NOHA, or DFMO to the medium (Fig. 8A). Urea assays confirmed that BEC, NOHA, and DFMO inhibited hypoxia-induced urea production without altering arginase protein expression in hPMVEC in these studies (Fig. 8B).
Fig. 8.
Arginase inhibition prevented hypoxia-induced cellular proliferation. A: proliferation assays from hypoxic hPMVECs treated with the arginase inhibitors α-difluoromethylornithine (DFMO; 100 mM), S-(2-boronoethyl)-l-cysteine (BEC; 100 μM), Nω-hydroxy-arginine (NOHA; 100 μM), or vehicle for 48 h. The number of viable cells was counted using Trypan blue exclusion. B: inhibition of arginase prevents hypoxia-induced urea production. Culture media were collected from hypoxic hPMVECs that were treated with vehicle, DFMO, BEC, or NOHA for 48 h. Inset: representative immunoblots for arginase I, arginase II, and β-actin to confirm that the arginase inhibitors had no substantial effect on arginase protein levels. *Hypoxia vehicle treated different from vehicle-treated normoxia, P < 0.05. #Arginase inhibitor different from vehicle-treated hypoxia, P < 0.05.
Inhibition of EGFR using siRNA.
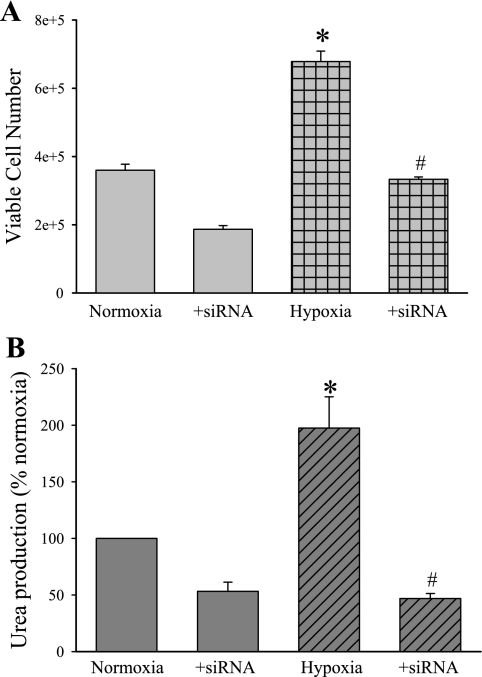
To further examine the role of EGFR signaling in the hypoxia-induced proliferative response, we repeated proliferation studies utilizing either vehicle, siRNA against EGFR, or a scramble siRNA (Dharmacon, Lafayette, CO). The hPMVEC were treated with vehicle, the scramble siRNA, or EGFR siRNA using Dharmafect (Dharmacon) tranfection reagent for 24 h. The hPMVEC were then washed and allowed to recover in normoxia for 24 h. Then proliferation assays were performed by seeding each well of a six-well plate with ∼200,000 hPMVEC and then placing the plates in either normoxia or hypoxia for 24 h. Viable cell numbers were determined using Trypan blue exclusion. Cellular proliferation in the scramble-treated hPMVEC was not different from vehicle-treated hPMVEC in either normoxia or hypoxia (data not shown). In the vehicle-treated and scramble-treated hPMVEC, there were significantly more viable cells after 24 h in hypoxia than after 24 h in normoxia (Fig. 9A). Treatment with an siRNA against EGFR completely prevented the hypoxia-induced increase in viable cell numbers (Fig. 9A).
Fig. 9.
EGFR small interfering RNA (siRNA) prevented hypoxia-induced proliferation and urea production. A: hPMVEC were transfected with either vehicle, a scramble siRNA, or EGFR siRNA (Dharmacon) for 24 h. The hPMVEC were then washed, EGM placed on them, and the hPMVEC were allowed to recover in normoxia for 24 h. The hPMVEC were washed again and seeded at 200,000 cells per well on a six-well plate and placed in either normoxia or hypoxia for 24 h. The number of viable cells was then counted using Trypan blue exclusion. The vehicle-treated and scramble siRNA-treated hPMVEC were not different in either normoxia or hypoxia. B: medium was collected from hPMVEC treated with EGFR siRNA or vehicle (n = 6 for each sample) as above and assayed for urea production. The urea production was normalized to protein content of each plate and expressed as a percentage of normoxia. *Hypoxia vehicle treated different from vehicle-treated normoxia, P < 0.05. #+siRNA different from vehicle treated for the same condition, P < 0.05.
To determine whether the siRNA against EGFR would also prevent the hypoxia-induced increase in urea production by hPMVEC, the media was harvested and assayed for urea concentration. Urea production in the scramble-treated hPMVEC was not different from that in the vehicle-treated hPMVEC in either normoxia or hypoxia (data not shown). Again, hypoxia resulted in a significantly greater urea production in vehicle- and scramble-treated hPMVEC than in normoxic vehicle- and scramble-treated hPMVEC (Fig. 9B). The hypoxic hPMVEC treated with EGFR siRNA had significantly less urea production than did the vehicle-treated hypoxic hPMVEC (Fig. 9B). Indeed, the hypoxic EGFR siRNA-treated hPMVEC had urea production that was less than that found in normoxic vehicle-treated hPMVEC.
DISCUSSION
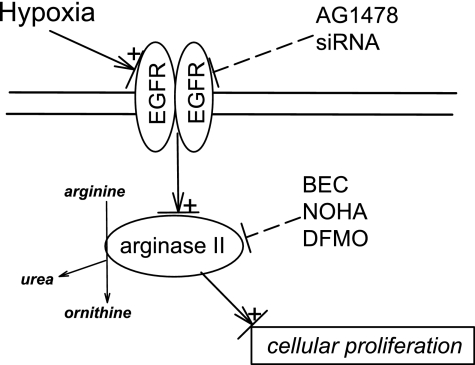
The main findings of this study in hPMVEC were that 1) hypoxia increased total EGFR protein and mRNA expression, as well as EGFR tyrosine kinase activity; 2) hypoxia increased hPMVEC proliferation, and EGFR inhibition prevented this hypoxia-induced increase in cellular proliferation; 3) arginase II protein expression and urea production were increased by hypoxia, and this hypoxia-induced increase was prevented by EGFR inhibition; and 4) inhibition of arginase activity prevented the hypoxia-induced increase in cellular proliferation. These findings support our hypothesis that hypoxia causes EGFR activation, which leads to increased arginase expression and thereby greater cellular proliferation in hPMVEC. As shown in Fig. 10, hypoxia both activates and increases EGFR expression in the hPMVEC; this leads to increased expression and activity of arginase II and increased cellular proliferation. Inhibiting EGFR with either pharmacological (AG-1478) or siRNA techniques prevents the hypoxia-induced arginase II expression and cellular proliferation. However, using pharmacological inhibition of arginase activity with either BEC, NOHA, or DFMO also prevented hypoxia-induced cellular proliferation. Thus we demonstrate that EGFR activation is necessary for hPMVEC proliferation, and for the first time show that EGFR activation leads to arginase II expression, which is necessary for hypoxia-induced cellular proliferation.
Fig. 10.
Proposed model for hypoxia-induced cellular proliferation via EGFR activation, with arginase as a necessary intermediate step. In our model, hypoxia results in EGFR activation, which leads to the induction of arginase II, which is required for EGFR-dependent, hypoxia-induced cellular proliferation. Pharmacological (AG-1478) or siRNA-mediated inhibition of EGFR expression and activation prevented both hypoxia-induced arginase II induction and cellular proliferation. Pharmacological inhibition of arginase activity (BEC, NOHA, and DFMO) prevented hypoxia-induced cellular proliferation.
Our data demonstrate a central role of EGFR in hypoxia-induced cellular proliferation, as evidenced by the findings that EGFR tyrosine kinase inhibition using either AG-1478 or EGFR siRNA prevents cellular proliferation. We also found that hypoxia led to an increase in EGFR protein and mRNA expression, as well as EGFR activity in hPMVEC. It is unclear what signaling pathways are involved in the upregulation of EGFR or the EGFR-mediated cellular proliferation. In terms of EGFR upregulation, hypoxia induces EGFR in tumor cell lines via a hypoxia-inducible factor-2α-dependent mechanism (11), while in pulmonary fibroblasts the early growth response-1 gene has been implicated in hypoxia-induced EGFR expression (4). It is of interest to note that we found that EGFR inhibition in hPMVEC prevented hypoxia-induced EGFR expression. Furthermore, it is not clear in hPMVEC which signaling pathways are activated by EGFR that result in cellular proliferation in hypoxia. In cancer cells, a variety of signaling pathways have been shown to be activated by EGFR, including the phosphatidylinositol 3-kinase/Akt, the mitogen-activated protein kinases, and the signal transducer and activator of transcription pathways (10). However, there is relatively little information on the function of EGFR in noncancerous endothelial cells or on the specific pathways in endothelial cells that act downstream of EGFR in eliciting cellular responses. In human umbilical vein endothelial cells, it has been shown that H2O2 or EGF treatment results in EGFR phosphorylation and subsequent c-Jun NH2-terminal kinase activation (7). Further studies will be necessary to elucidate the intracellular mechanisms downstream of EGFR that lead to EGFR expression and cellular proliferation following hypoxic exposure in hPMVEC. However, our data suggest that an important intermediate step in hypoxia-induced EGFR-mediated endothelial cell proliferation is the upregulation of arginase.
We found that hypoxia-induced arginase II protein expression and urea production was prevented by EGFR tyrosine inhibition with AG-1478. Furthermore, we found that treatment with siRNA against EGFR prevented the hypoxia-induced increase in urea production. These findings are consistent with a previous study from our laboratory (20) showing that cytokine-induced arginase expression and activity in bovine pulmonary arterial endothelial cells depended on EGFR tyrosine kinase activity. There are two described isoforms of arginase, arginase I and arginase II. The two isoforms arise from two distinct genes: ARG1 on chromosome 6, and ARG2 on chromosome 14 (21). Arginase I is a cytosolic enzyme, and arginase II is a mitochondrial enzyme. It has been suggested that the cytosolic location of arginase I results in colocalization with the polyamine synthetic enzymes, while the mitochondrial location of arginase II may favor production of proline in some circumstances, since ornithine aminotransferase is also located in the mitochondria (16). Arginase I is often referred to as the hepatic isoform and is key in urea cycle function. However, arginase I can be induced by lipopolysaccharide, IL-13, and hyperoxia in a wide variety of cells and tissues (15, 20, 23). The induction of arginase I due to inflammatory stimuli has been reported to be controlled by activation of an enhancer located 3 kb downstream of the basal promoter of the arginase I gene (12, 22). The transcription factor CCAAT/enhancer-binding protein-β (C/EBP-β) binds to the enhancer region (9), and recent studies in macrophages from C/EBP-β−/− mice (1) and in RAW264.7 macrophage cell lines (12) demonstrated that C/EBP-β is necessary for the regulation of macrophage arginase I transcription. Arginase II is inducible by a variety of factors, including lipopolysaccharide, tumor necrosis factor-α, interferon-γ, 8-bromo-cGMP, and hyperoxia (6, 16, 20, 24). Arginase II upregulation is dependent on activation of an enhancer region 942 bp from the transcription start site (18). The mechanisms underlying the induction of arginase II in response to inflammatory stimuli have not been well studied, and, therefore, the exact cellular mechanism leading to EGFR-dependent arginase II induction is unclear at this time. However, given that, in macrophages, hypoxia has been found to increase arginase expression and activity via activation of C/EBP-β (1), and recent data in cultured epithelial cells suggesting that EGFR activation can lead to activation of C/EBP-β (3, 13), it may be that C/EBP-β is involved. To the best of our knowledge, we are the first to show that hypoxia-induced cellular proliferation in hPMVEC depends on EGFR tyrosine kinase activation, leading to arginase II induction. Future studies will be needed to determine the exact cellular mechanism(s) leading from EGFR activation to arginase II induction.
GRANTS
This study was supported by National Heart, Lung, and Blood Institute Grant HL-075261 (L. D. Nelin) and Grant HL-091711 (I. T. Toby).
DISCLOSURES
No conflicts of interest are declared by the author(s).
REFERENCES
- 1.Albina J, Mahoney E, Daley J, Reichner JS. Macrophage arginase regulation by CCAAT/enhancer-binding protein β. Shock 23: 168–172, 2005 [DOI] [PubMed] [Google Scholar]
- 2.Bachetti T, Comini L, Francolini G, Bastianon D, Valetti B, Cadei M, Grigolato P, Ferrari R. Arginase pathway in human endothelial cells in pathophysiological conditions. J Mol Cell Cardiol 37: 515–523, 2004 [DOI] [PubMed] [Google Scholar]
- 3.Baldwin BR, Timchenko NA, Zahnow CA. Epidermal growth factor receptor stimulation activates the RNA binding protein CUG-BP1 and increases expression of C/EBPβ-LIP in mammary epithelial cells. Mol Cell Biol 24: 3682–3691, 2004 [DOI] [PMC free article] [PubMed] [Google Scholar]
- 4.Banks M, Gerasimovskaya E, Tucker D, Stenmark K. Egr-1 antisense oligonucleotides inhibit hypoxia-induced proliferation of pulmonary artery adventitial fibroblasts. J Appl Physiol 98: 732–738, 2005 [DOI] [PubMed] [Google Scholar]
- 5.Bivalacqua TJ, Burnett AL, Hellstrom WJ, Champion HC. Overexpression of arginase in the aged mouse penis impairs erectile function and decreases eNOS activity: influence of in vivo gene therapy of anti-arginase. Am J Physiol Heart Circ Physiol 292: H1340–H1351, 2007 [DOI] [PubMed] [Google Scholar]
- 6.Chang R, Chicoine LG, Cui H, Kanagy NL, Walker BR, Liu Y, English BK, Nelin LD. Cytokine-induced arginase activity in pulmonary endothelial cells is dependent on Src family tyrosine kinase activity. Am J Physiol Lung Cell Mol Physiol 295: L688–L697, 2008 [DOI] [PMC free article] [PubMed] [Google Scholar]
- 7.Chen K, Vita JA, Berk BC, Keaney JF. c-Jun N-terminal kinase activation by hydrogen peroxide in endothelial cells involves SRC-dependent epidermal growth factor receptor transactivation. J Biol Chem 276: 16045–16050, 2001 [DOI] [PubMed] [Google Scholar]
- 8.Chicoine LG, Paffett ML, Young TL, Nelin LD. Arginase inhibition increases nitric oxide production in bovine pulmonary arterial endothelial cells. Am J Physiol Lung Cell Mol Physiol 287: L60–L68, 2004 [DOI] [PubMed] [Google Scholar]
- 9.Chowdhury S, Gotoh T, Mori M, Takiguchi M. CCAAT/enhancer-binding protein β binds and activates while hepatocyte nuclear factor-4 does not bind but represses the liver-type arginase promoter. Eur J Biochem 236: 500–509, 1996 [DOI] [PubMed] [Google Scholar]
- 10.DeLuca A, Carotenuto A, Rachiglio A, Gallo M, Normanno N. The role of the EGFR signaling in tumor microenvironment. J Cell Physiol 214: 559–567, 2007 [DOI] [PubMed] [Google Scholar]
- 11.Franovic A, Gunaratnam L, Smith K, Patten D, Lee S. Translational up-regulation of the EGFR by tumor hypoxia provides a nonmutational explanation for its overexpression in human cancer. Proc Natl Acad Sci USA 104: 13092–13097, 2007 [DOI] [PMC free article] [PubMed] [Google Scholar]
- 12.Gray MJ, Poljakovic M, Kepka-Lenhart D, Morris SM., Jr Induction of arginase I transcription by IL-4 requires a composite DNA response element for STAT6 and C/EBPbeta. Gene 353: 98–106, 2005 [DOI] [PubMed] [Google Scholar]
- 13.He D, Natarajan V, Stern R, Gorshkova IA, Solway J, Spannhake EW, Zhao Y. Lysophosphatidic acid-induced transactivation of epidermal growth factor receptor regulates cyclo-oxygenase 2 expression and prostaglandin E2 release via C/EBPβ in human bronchial epithelial cells. Biochem J 412: 153–162, 2008 [DOI] [PMC free article] [PubMed] [Google Scholar]
- 14.Ignarro LJ, Buga GM, Wei LH, Bauer PM, Wu G, del Soldato P. Role of the arginine-nitric oxide pathway in the regulation of smooth muscle cell proliferation. Proc Natl Acad Sci USA 98: 4202–4208, 2001 [DOI] [PMC free article] [PubMed] [Google Scholar]
- 15.Koga T, Koshiyama Y, Gotoh T, Yonemura N, Hirata A, Tanihara H, Negi A, Mori M. Coinduction of nitric oxide synthase and arginine metabolic enzymes in endotoxin-induced uveitis rats. Exp Eye Res 75: 659–67, 2002 [DOI] [PubMed] [Google Scholar]
- 16.Li H, Meininger CJ, Kelly KA, Hawker JR, Morris SM, Wu G. Activities of arginase I and II are limiting for endothelial cell proliferation. Am J Physiol Regul Integr Comp Physiol 282: R64–R69, 2002 [DOI] [PubMed] [Google Scholar]
- 17.Livak KJ, Schmittgen TD. Analysis of relative gene expression data using real time quantitative PCR and the 2[-ΔΔC(t)] method. Methods 25: 402–408, 2001 [DOI] [PubMed] [Google Scholar]
- 18.Marathe C, Bradley MN, Hong C, Lopez F, Ruiz de Galarreta CM, Tontonoz P, Castrillo A. The arginase II gene is an anti-inflammatory target of liver X receptor in macrophages. J Biol Chem 281: 32197–32206, 2006 [DOI] [PubMed] [Google Scholar]
- 19.Nelin LD, Nash HE, Chicoine LG. Cytokine treatment increases arginine metabolism and uptake in bovine pulmonary arterial endothelial cells. Am J Physiol Lung Cell Mol Physiol 281: L1232–L1239, 2001 [DOI] [PubMed] [Google Scholar]
- 20.Nelin LD, Chicoine LG, Reber KM, English BK, Young TL, Liu Y. Cytokine-induced endothelial arginase expression is dependent on epidermal growth factor receptor. Am J Respir Cell Mol Biol 33: 394–401, 2005 [DOI] [PMC free article] [PubMed] [Google Scholar]
- 21.Nelin LD, Stenger MR, Malleske DT, Chicoine LG. Vascular arginase and hypertension. Curr Hypertens Rev 3: 242–249, 2007. [Google Scholar]
- 22.Pauleau AL, Rutschman R, Lang R, Pernis A, Watowich SS, Murray PJ. Enhancer-mediated control of macrophage-specific arginase I expression. J Immunol 172: 7565–7573, 2004 [DOI] [PubMed] [Google Scholar]
- 23.Que LG, Kantrow SP, Jenkinson CP, Piantadosi CA, Huang YT. Induction of arginase isoforms in the lung during hyperoxia. Am J Physiol Lung Cell Mol Physiol 275: L96–L102, 1998 [DOI] [PubMed] [Google Scholar]
- 24.Salimuddin Nagasaki A, Gotoh T, Isobe H, Mori M. Regulation of the genes for arginase isoforms and related enzymes in mouse macrophages by lipopolysaccharide. Am J Physiol Endocrinol Metab 277: E110–E117, 1999 [DOI] [PubMed] [Google Scholar]
- 25.Schearer JD, Richards JR, Mills JD, Caldwell MD. Differential regulation of macrophage arginine metabolism: a proposed role in wound healing. Am J Physiol Endocrinol Metab 272: E181–E190, 1997 [DOI] [PubMed] [Google Scholar]
- 26.Stanley KP, Chicoine LG, Young TL, Reber KM, Lyons CR, Liu Y, Nelin LD. Gene transfer with inducible nitric oxide synthase decreases production of urea by arginase in pulmonary arterial endothelial cells. Am J Physiol Lung Cell Mol Physiol 290: L298–L306, 2006 [DOI] [PubMed] [Google Scholar]
- 27.Wei LH, Wu G, Morris SM, Ignarro LJ. Elevated arginase I expression in rat aortic smooth muscle cells increases cell proliferation. Proc Natl Acad Sci USA 98: 9260–9264, 2001. [DOI] [PMC free article] [PubMed] [Google Scholar]


