Abstract
Phosphorylation and regeneration of rhodopsin, the prototypical G-Protein Coupled Receptor, each can influence light- and dark-adaptation. To evaluate their relative contributions we quantified rhodopsin, retinoids, phosphorylation and photosensitivity in mice during 90 minutes of illumination followed by dark-adaptation. During illumination, all-trans retinyl esters and, to a lesser extent, all-trans retinal, accumulate and reach steady state within an hour. Each major phosphorylation site on rhodopsin reaches a steady state level of phosphorylation at a different time during illumination. The dominant factor that limits dark adaptation is isomerisation of retinal. During dark adaptation dephosphorylation of rhodopsin occurs in two phases. The faster phase corresponds to rapid dephosphorylation of regenerated rhodopsin present at the end of the illumination period. The slower phase corresponds to dephosphorylation of rhodopsin as it forms by regeneration. We conclude that rhodopsin phosphorylation has three physiological functions, it quenches phototransduction, it reduces sensitivity during light-adaptation and it suppresses bleached rhodopsin activity during dark adaptation.
The temporal demands of vision require that photo-activated rhodopsin be inactivated quickly. Phosphorylation of the C-terminus of photo-activated rhodopsin by rhodopsin kinase (GRK1) serves this purpose. Together with arrestin binding, phosphorylation of rhodopsin provides a fast and effective mechanism to quench phototransduction (1, 2).
Vision also requires a mechanism to restore photosensitivity to rhodopsin. On a time scale slower than phosphorylation photoactivated rhodopsin decays spontaneously to form opsin and all-trans retinal. Opsin with all-trans retinal and even opsin alone weakly stimulate phototransduction (3), so it is essential to inactivate the opsin, eliminate the all-trans retinal and ultimately regenerate rhodopsin with 11-cis retinal. The all-trans retinal generated in response to light is reduced in the photoreceptor to retinol then transferred to the retinal pigment epithelium (RPE) where it is esterified to a fatty acid. The retinyl ester is isomerized and de-esterified by a single protein in the RPE, an isomerohydrolase known as RPE65. This reaction generates 11-cis retinol, which is then oxidized to the aldehyde. The 11-cis retinal then returns to the photoreceptor outer segment to regenerate rhodopsin (4–6).
Following an intense but brief flash of light several important biochemical changes occur in photorecepors of living rodents. The most distal serines on the C-terminal tail of rhodopsin are phosphorylated rapidly. Sites most proximal to the membrane are phosphorylated more slowly (7). Also following the flash all-trans-retinal and all-trans-retinyl ester accumulate and then decay slowly in darkness. None of the other visual cycle retinoids appreciably change in concentration (8–11) . This suggests that both reduction of all-trans-retinal to all-trans-retinol in the rod photoreceptor outer segment, and the isomerohydrolase reaction in RPE are slow steps in the visual cycle. Early studies of retinoid metabolism employed continuous illumination of the rat visual system (12–14). In those studies, all-trans-retinal and retinol (presumably all-trans) accumulated and decayed during illumination whereas retinyl esters steadily accumulated to become the dominant species after 10–20 min of illumination. A more recent study using mouse retinas (15) reported different results, neither all-trans-retinol nor 11-cis retinol accumulated to substantial levels during recovery from a10 min intense bleach.
In the study reported here we investigated the relationships between retinoid metabolism, phosphorylation of rhodopsin and recovery of phototransduction in live animals exposed to constant illumination for more than an hour followed by darkness. A unique feature of this study is that all of these measurements were made under identical conditions. This enabled us to show that phosphorylation persists until rhodopsin is regenerated and that isomerohydrolase activity determines the rate of recovery from constant bright illumination. We also found evidence that phosphorylation of rhodopsin can reduce sensitivity in the light-adapted state and it can suppress activity of bleached rhodopsin in the dark-adapted state.
Experimental Procedures
Animals
Albino Balb/c mice, homozygous for the Leu450 allele of RPE65, were used for all the experiments described in this report. Mice were maintained on a 12 hour on/12 hour off light-dark cycle. All procedures with animals were approved by the University of Washington Animal Care Committee and were in accord with recommendations of the American Veterinary Medical Association Panel on Euthanasia and the ARVO Statement for the Use of Animals in Ophthalmic and Vision Research.
Retinoid analysis
Retinoids were extracted from whole mouse eyes and analyzed as described previously (16, 17) except that ethyl all-trans-9-(4-methoxy-2,3,6-trimethylphenyl)-3,7-dimethyl-2,4,6,8-nonatetraenoate (Etretinate™) was used as the internal standard instead of retinyl acetate and separations were carried out with a Phenomenex Luna 3 Silica (2) normal phase column (4.6×150 mm, 3 µm particle size). The eluate from the HPLC column was monitored simultaneously at 325 nm (absorption maximum of retinyl esters and retinols) and at 350 nm (absorption maximum of retinyl oximes). Retinyl esters were determined in hexane extracts of mouse eyes with a Luna 3 µm silica column (Phenomenex). Retinyl esters were eluted from the column with isocratic application of 0.03% ethylacetate, 0.003% octanol in hexane at a flow rate of 1 ml/min. Spectra were obtained of components in peak fractions.
Rhodopsin analysis
Rhodopsin was solubilized from homogenized whole mouse eyes as described previously (17) and its concentration determined by the decrease in absorbance at 500 nm after bleaching, using an extinction coefficient of 42,000 l·mol/cm.
Electroretinography
Mice were dark adapted overnight for 12 hours or more. A single mouse was then placed in a standard mouse cage with wire rack cover without a water bottle or food. The cage was then exposed to illumination for 90 minutes. Pupils were not dilated during the 90 minute light adaptation period. The mouse was then transferred to complete darkness. At the dark adaptation time point to be measured the mouse was anaesthetized with Ketamine and Xylazine (140 mg/kg and 0.5 mg/kg body weight respectively) and tropicamide and phenylephrine drops were applied to the eyes. The mouse was transferred to a dark box and moved to the room with the ERG apparatus. All these manipulations were complete and ERG recordings were begun within 5 minutes after anesthetic injection. All subsequent manipulations were done under infrared illumination. Mice were held at 37°C during the ERG analysis. Flashes from a photographic flash unit were delivered through a fiber optic cable and lens. ERGs were recorded with a gold ring electrode on 2–3% methyl cellulose on the cornea with a copper reference electrode in the mouth. The unattenuated energy of the white light flash measured at the cornea was 2.9 mJ/cm2. Test flashes were attenuated using neutral density filters. Responses to test flashes from dim to moderate intensity caused approximately 1400, 5500, 13,000, 40,000, and 130,000 and 400,000 photoisomerizations per rod based on comparisons with mouse ERGs calibrated in a previous study (18).
Responses to 5–6 different test flash intensities were collected at each time point during dark adaptation following 90 minutes of illumination. Dark adaptation experiments were performed using 7 mice for dim and 15 mice for bright illumination. The analyses of the leading edge of the a-waves were based on a model (19) for activation of the phototransduction cascade:
where a is the a-wave amplitude at time t, amax is the maximum a-wave amplitude that would be produced in the absence of synaptic transmission to bipolar cells, A is a factor proportional to the gain of phototransduction, amax is a factor proportional to the dark current, Φ is the number of photoisomerizations per rod and td is an intrinsic delay time. The a-waves from all flash intensities were fit simultaneously using a variation of this equation (20) that takes into account the capacitative time constant (τ) of the photoreceptor. Fitting was performed using the Global Fit program of Igor Pro (Wavemetrics). a-waves were fitted as described previously (7). A correction factor for Φ was used based on the relative fraction of rhodopsin present at the time of the test flash compared to the dark-adapted level. These values were determined from the regeneration data in Fig. 1 and 2. Cone contributions to the a-wave responses were considered to be negligible.
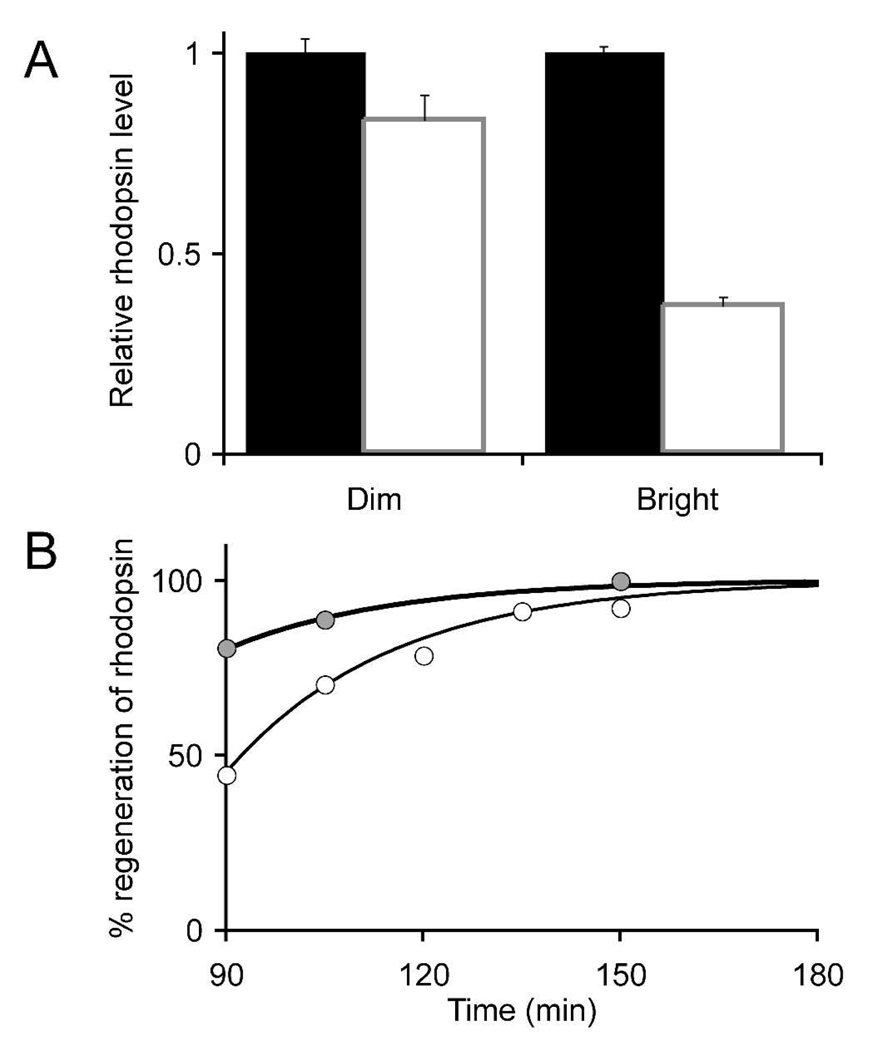
Fig. 1. Rhodopsin levels during light and dark adaptation.
A. Mice were dark adapted overnight and exposed to either dim or bright continuous illumination for 90 min. Total rhodopsin per eye was determined immediately at the end of the 90 minute light adaptation period. Standard errors of the means are shown. B. Following the 90 minutes of either dim or bright light adaptation mice were kept in darkness and rhodopsin per eye was determined at the intervals shown The data were fit with a single exponential with a rate constant = 0.035/min.
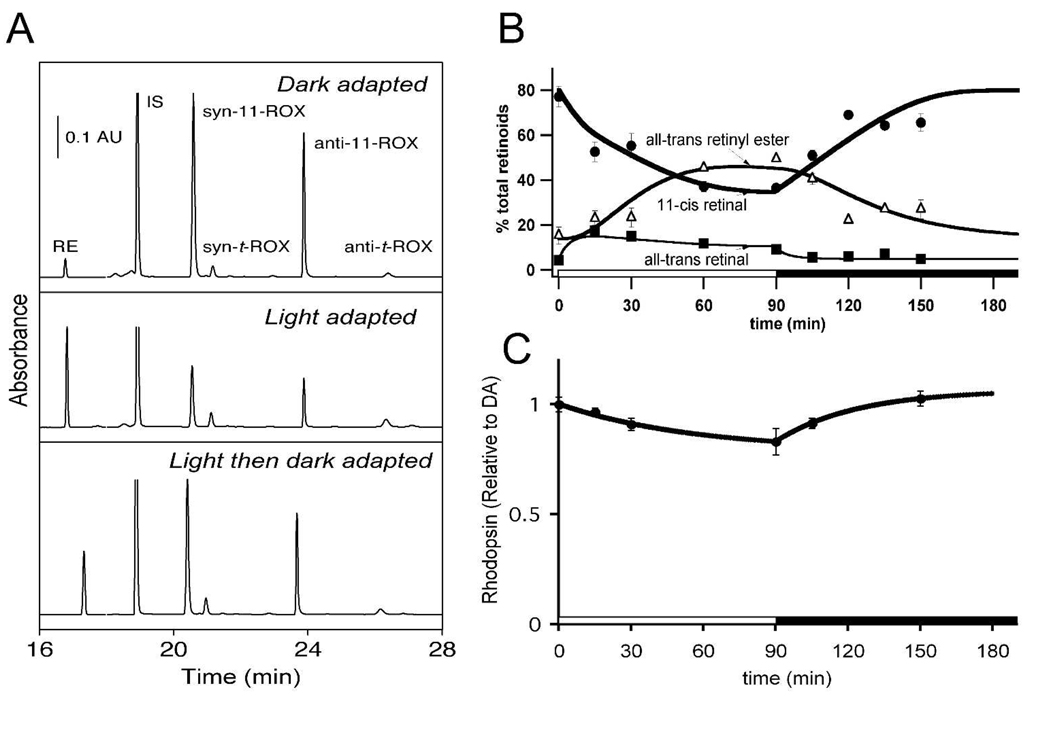
Fig. 2. Retinoid levels.
A. Representative HPLC traces from our retinoide analyses. The traces show absorbance at 325 nm (16 to 18 min) and at 350 nm (18 to 28 min). RE, retinyl esters; syn-11-ROX, syn 11-cis-retinal oxime; anti-11-ROX, anti-11-cis-retinal oxime; syn-t-ROX, syn all-trans-retinal oxime; anti-t-ROX, anti all-trans-retinal oxime; IS, internal standard; AU, absorbance unit. B. Retinoid levels during light and dark adaptation. Relative amounts of three visual cycle retinoids are shown during bright illumination and then during recovery in darkness. all-trans-Retinol and 11-cis-retinol levels are not shown because their abundance was low and did not change appreciably during the experimental period. Standard errors of the means are shown with n = 3 or more. C. Rhodopsin levels during and after 90 minute exposure to dim illumination.
Phosphorylation analysis
Rhodopsin phosphorylation was measured using a mass spectrometry method that we described in previous publications (7, 21). Mice were dark adapted overnight for all the experiments. All manipulations at light-sensitive steps in the analysis were done under infrared illumination. At the appropriate time point during light- or dark-adaptation a mouse was euthanized by cervical dislocation, the eyes were removed and homogenized for 1 sec in 750 µl of 7 M deionized urea, 5 mM EDTA, 20 mM Tris, pH 7.4 with the tip of a homogenizer (Ultra-Turrax) rotating at 20,000 RPM. Retinal membranes were harvested by centrifugation at 54,000 RPM in a Beckman TLA-55 rotor in a tabletop Beckman Optima ultracentrifuge. The membranes were washed twice with deionized water, resuspended in 25 µL of 20 µg/ml Asp-N protease (Roche, Indianapolis) in 10 mM Hepes pH 7.4 and incubated at room temperature for 15–20 hours. Solubilized peptides were recovered in the supernatant after centrifugation at 54,000 RPM. The supernatants were diluted to 90 µl, acidified with 10 µl of 5% acetic acid and stored at −20°C.
LCMS
Details of the mass spectrometry method and analysis procedure are described in earlier reports from our lab (7, 21). Ten-µl samples were injected with a Famos autosampler (LC Packings) onto a 75 µm by 5–15 cm capillary column. These columns were packed at 500–800 psi using Vydac C182TP reversed-phase resin in 90% methanol, 10% isopropanol. Picofrit column casings (New Objective, Inc.) with 15 µm tip diameter were used. The columns immediately were acidified with 0.5% acetic acid. Samples were loaded onto the column at 2–3 µL/min, and peptides were eluted at 1 µL/min with column pressure of 800–1200 psi at ambient temperature. Buffer A was 0.08% HFBA in water. Buffer B was 80% acetonitrile, 20 % water, 0.04% HFBA. Rhodopsin phosphopeptides typically eluted in ~12% B or with a very shallow gradient (<1% B change per 30 min).
Voltage was applied to the mobile phase using the New Objective Picoview microspray source. We used a ThermoFinnigan LCQ Deca ion trap mass spectrometer in positive ion mode for all analyses. Fragmentation by CID was performed using activation amplitude of 29%, activation Q of 0.250, activation time of 50 msec, and isolation width of 2.5 m/z.
Data analysis
Relative quantities of each phosphorylation state of the rhodopsin C-terminal peptide and the relative amounts of monophosphorylated peptide phosphorylated on Ser 334, Ser 338, and Ser 343 were determined as described previously (21).
To estimate the percentage of doubly phosphorylated rhodopsin C-terminal peptide that includes phosphorylation either on Ser 334 or on Ser 343, we identified three daughter ions produced from each species of parent ion. We tracked the y6 ions (572.3 m/z when Ser 334 is phosphorylated, 652.3 m/z when Ser 343 is phosphorylated), the y13 ions (1370.6 m/z when Ser 334 is phosphorylated, 1450.6 m/z when Ser 343 is phosphorylated), and the b13 ions (1453.5 m/z when Ser 334 is phosphorylated, 1373.5 m/z when Ser 343 is phosphorylated). These daughter ions were chosen because they appeared consistently in MS/MS spectra from doubly phosphorylated rhodopsin peptides. The signal from each of these ions was quantified. Then for each daughter ion pair, the signal intensities of the Ser 334 and Ser 343 forms were added to get the total signal from that daughter ion. The individual signal intensities from the Ser 334 and Ser 343 form were divided by this total intensity to calculate the percentage of the total signal due to that form. The three percentages generated for the three daughter ion pairs were averaged to calculate the percentage of doubly phosphorylated rhodopsin that is phosphorylated on each of the two sites. For purposes of our estimates, we assume that Ser 338 is phosphorylated in all doubly phosphorylated rhodopsin, since the species of doubly phosphorylated peptide phosphorylated on both Ser 334 and Ser 343 was found to be rare. (data not shown)
To calculate the total percent rhodopsin phosphorylated on Ser 334 or Ser 343, the percentage monophosphorylated on that site was added to the calculated percentage of doubly phosphorylated rhodopsin modified on that site. This total was added to the total amount of rhodopsin peptide with three or more phosphates. For purposes of these estimates, we assume the majority of rhodopsin peptides with three or more phosphates are phosphorylated on all serine residues, since threonine phosphorylation is much less abundant. To calculate the total percent rhodopsin phosphorylated on Ser 338, the percentage monophosphorylated on Ser 338 was added to the total percentage of rhodopsin peptide with two or more phosphates.
Immunocytochemistry
The methods we used for tissue fixation, immunocytochemistry, and laser scanning confocal microscopy have been described by Saari et al., 2001.
Illumination conditions
Dark-adapted mice were allowed to roam freely in a clear plastic mouse cage with a lid constructed of thin metal bars. For bright illumination the cage was placed on a laboratory bench 1.5 m under fluorescent ceiling lights. Illumination from the sides of the cage ranged from 150–200 lux. Illumination from the top was 500–600 lux. This light level bleached ~55% of the rhodopsin in the mouse eye after 90 minutes of exposure. Dim illumination conditions were achieved in a similar configuration in a dark room with only a bare 40W incandescent light bulb 1 m above the cage. Illumination from the sides of the cage ranged from 4–6 lux and from the top 60–80 lux. This illumination produced a steady state in which ~15% of the rhodopsin was bleached.
Results
Light and dark adaptation conditions
Light- and dark-adaptation are normal responses to changes in an animal’s environment. We used two protocols within the range of illumination encountered in a typical laboratory to induce light adaptation in mice (see Methods section for details) . A typical light-adaptation/dark-adaptation experiment proceeded according to the following protocol. A mouse was adapted to complete darkness overnight. During mid-morning the mouse was transferred to a standard mouse cage under one of the illumination conditions just described. After 90 minutes the mouse was transferred to another cage in a completely dark ventilated cabinet. For each time-point during light or dark adaptation the mouse was euthanized by cervical dislocation and its eyes were harvested for retinoid or phosphorylation measurements. For ERG analyses of dark adaptation the same protocol was followed except that the mouse was injected with xylazine/ketamine and its pupils were dilated 5 minutes before the time point of analysis. Aside from that brief five minute interval the light and dark adaptation of each mouse occurred in a non-anaesthetized state.
Bleaching and regeneration of rhodopsin
At the end of 90 minutes of steady illumination we found that rhodopsin levels, evaluated by 500 nm absorbance of solubilized retinal homogenates, were reduced by 15% for dim and 61% for bright illumination (Fig. 1A). In darkness following both illumination protocols rhodopsin levels recovered at similar rates. The data fit well to a rate of regeneration of 0.035/min (Fig. 1B), the rate reported earlier for mice homozygous for the Leu450 allele of the RPE65 gene (22).
Measurements of retinoids
We quantified visual cycle intermediates at several time points during light and dark adaptation. Retinoids were extracted from whole eye homogenates and quantified by normal phase HPLC. Representative HPLC traces for eyes that either were dark-adapted, light-adapted, or light- and then dark-adapted are shown in Fig 2A. With bright illumination each retinoid intermediate could be determined accurately. Fig. 2B shows that 11-cis retinal reached a steady-state at 45+/− 2% of its initial dark adapted level after about an hour of bright illumination. To confirm that 11-cis retinal measurements accurately reflect rhodopsin levels during exposure to bright illumination we compared 11-cis retinal (45% of dark-adapted at 90 min of bright illumination) to rhodopsin (39 +/− 5% of dark adapted at 90 min). The agreement confirmed that both 11-cis retinal and rhodopsin absorbance measurements report the amount of rhodopsin in the retina. With dim illumination some retinoids were too scarce to measure reliably, so we only measured rhodopsin levels (Fig. 2C).
Retinoid profile during light and dark adaptation
During constant illumination under the brighter illumination protocol, 11-cis-retinal decreased and reached a steady state level at 47% of its original value after about 45 min (Fig. 2B). All-trans-retinal increased initially then gradually declined. Retinyl esters gradually accumulated to become the major retinoid after 45 min. All-trans- and 11-cis-retinol levels were very low in dark-adapted mouse eyes (8, 10, 11) and changed little during the period of constant illumination and recovery in darkness. All retinoid levels returned nearly to their initial levels after 150 min in darkness (not shown), except for retinyl esters, which still represented a larger fraction of the total retinoids compared to the initial dark-adapted values.
Retinyl esters
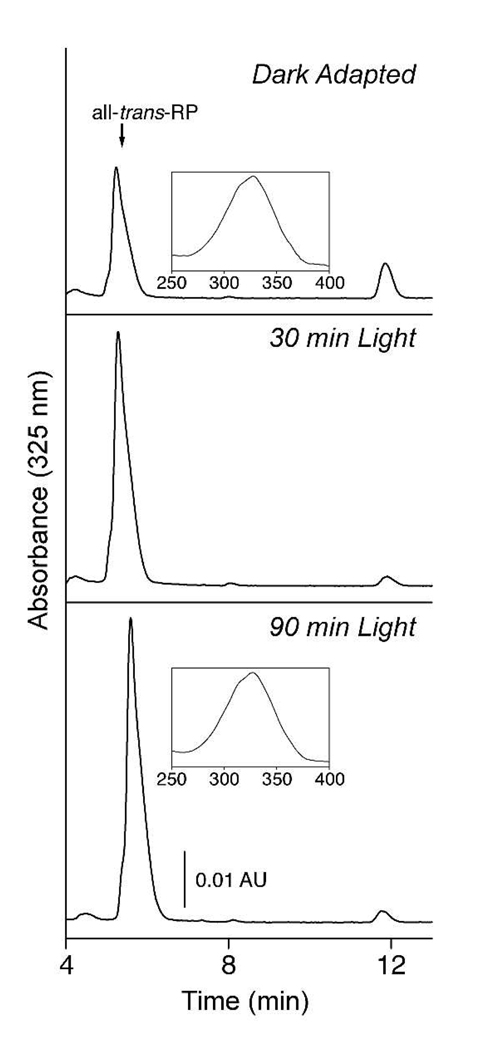
Retinyl ester, the substrate for an isomerohydrolase (23–25), accumulated during the period of onstant illumination (Fig. 2B). It was of interest to determine whether they were gradually converted to 11-cis-retinyl esters during this time. Accordingly, we examined the isomeric composition of the accumulated esters. The composition of retinyl esters remained constant during the period of steady illumination. This is evident from the HPLC traces of Fig. 3, in which the migration position of the major component matches that of authentic all-trans-retinyl ester. In addition, the absorbance spectra of the esters eluted from the column (inserts, Fig. 3), include a prominent shoulder on the short wavelength side of the peak, which is typical of all-trans-retinyl esters and not 11-cis-retinyl esters. Thus, the rate of isomerization of all-trans-retinyl ester to 11-cis-retinol must be closely matched to that of further metabolism of the retinoid (oxidation and utilization) such that no accumulation of 11-cis-retinol and its ester occurs.
Fig 3. Isomeric composition of retinyl esters during light adaptation.
Retinyl esters were extracted from mouse eyes following dark or light adaptation, as indicated, and analyzed by HPLC. The insets show the absorbance spectra of components in peak fractions. The shoulders on the absorption spectra are typical of all-trans-retinyl esters and not 11-cis-retinyl esters. Naturally occurring retinyl esters consist of retinol esterified with several fatty acids, hence the asymmetric shape of the peaks. All-trans-RP, all-trans-retinyl palmitate.
Rhodopsin Phosphorylation
We used a mass-spectrometry based method to evaluate phosphorylation and dephosphorylation of rhodopsin in mouse eyes during light and dark adaptation (21). For each phosphorylation measurement a mouse was euthanized, its eyes were enucleated and homogenized in 7 M urea buffer and the homogenate was stored on dry ice. Each homogenate was subsequently thawed, membranes were isolated and treated with endoproteinase Asp-N to release the rhodopsin C-terminal peptide from the membranes (26). The resulting peptides were quantified by HPLC/mass spectrometry using methods we described previously (7, 21).
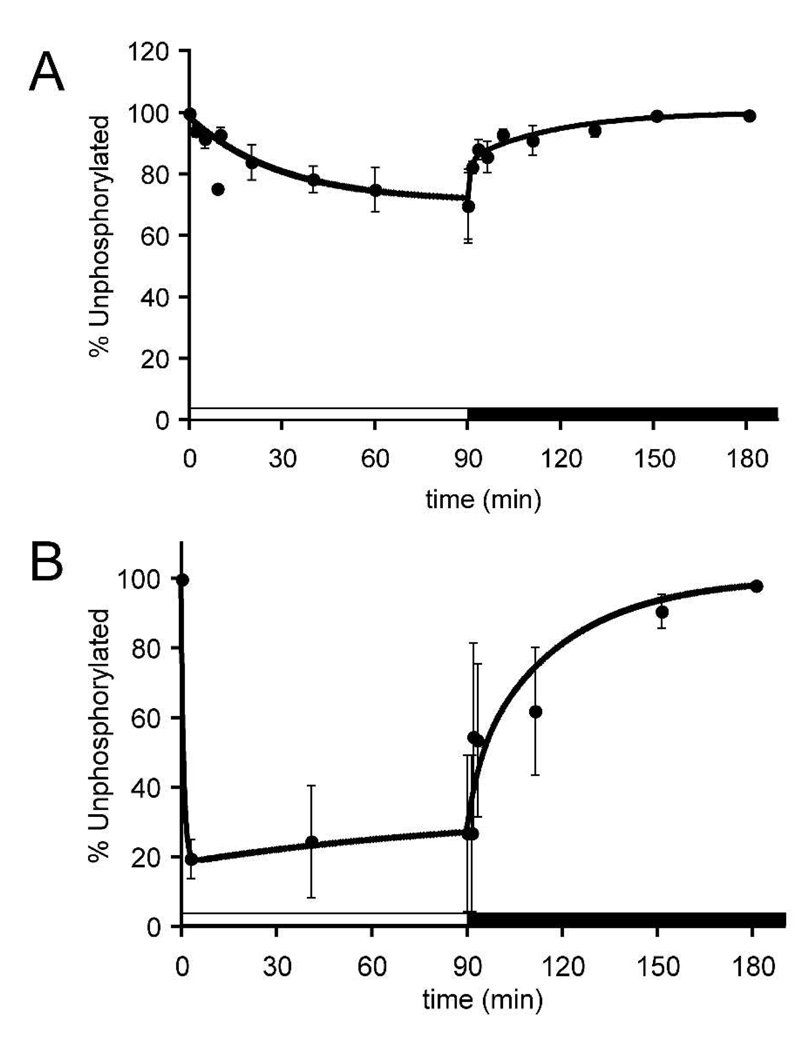
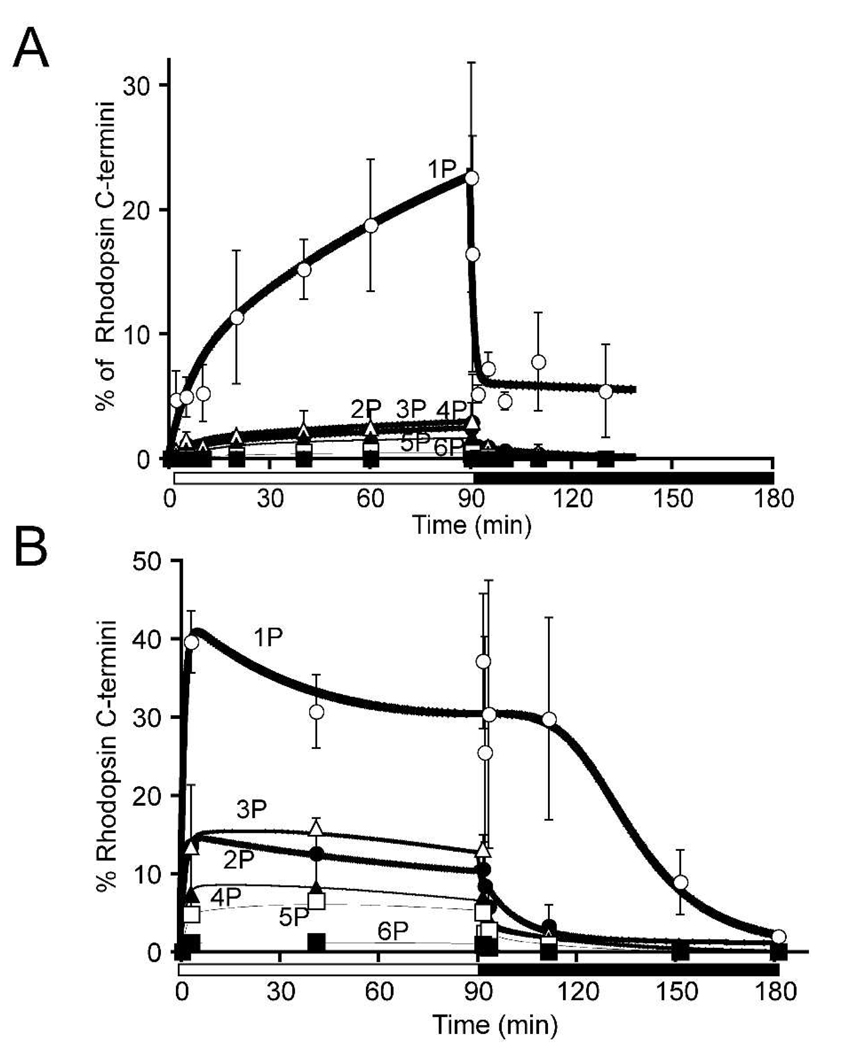
Fig. 4 shows the depletion of rhodopsin in the unphosphorylated state that occurs when mice are exposed to dim or bright illumination. In dim light (Fig. 4A), more than 90 minutes of illumination was required to reach a steady state in which ~30% of opsin had at least one phosphate. Approximately 15% of the rhodopsin was in the bleached state under these conditions. In bright light a steady state level was reached much faster at a significantly higher percentage (70–80%) of rhodopsin with at least one phosphate (Fig. 4B). About 55% of rhodopsin was in the bleached state under this condition. Rates of dephosphorylation in darkness following 90 minutes of illumination also were measured. Unexpectedly, the initial rate of dephosphorylation was extremely rapid, but then it slowed. Following dim illumination the percentage of rhodopsin that dehosphorylated rapidly was greater than following bright illumination. Dephosphorylation was nearly complete after 60–90 minutes in darkness.
Fig. 4. Quantification of rhodopsin phosphorylation during and after exposure to 90 minutes of dim (A) or bright (B) illumination.
The abscissa shows the percentage of rhodopsin in the mouse retina that was completely unphosphorylated at each time point. Error bars represent standard deviation.
The distributions of phosphorylation states during light-and dark adaptation are shown in Fig. 5. Opsin C-termini with up to six phosphates, the maximum possible, are present in retinas from both dim and bright illumination protocols. Monophosphorylation predominated in dim light (Fig. 5A) whereas multiply phosphorylated species accumulated in bright light (Fig. 5B). Following the onset of darkness higher order phosphorylated species disappeared most rapidly. The delay in the disappearance of species with fewer phosphates most likely represents production of these forms as intermediates in the stepwise dephosphorylation of higher order phosphorylated species.
Fig. 5. Quantification of rhodopsin phosphorylation during and after exposure to 90 minutes of dim (A) or bright (B) illumination.
The abscissa shows the percentage of rhodopsin in the mouse retina that was phosphorylated at 1, 2, 3, 4, 5 or 6 sites. Error bars represent standard deviation.
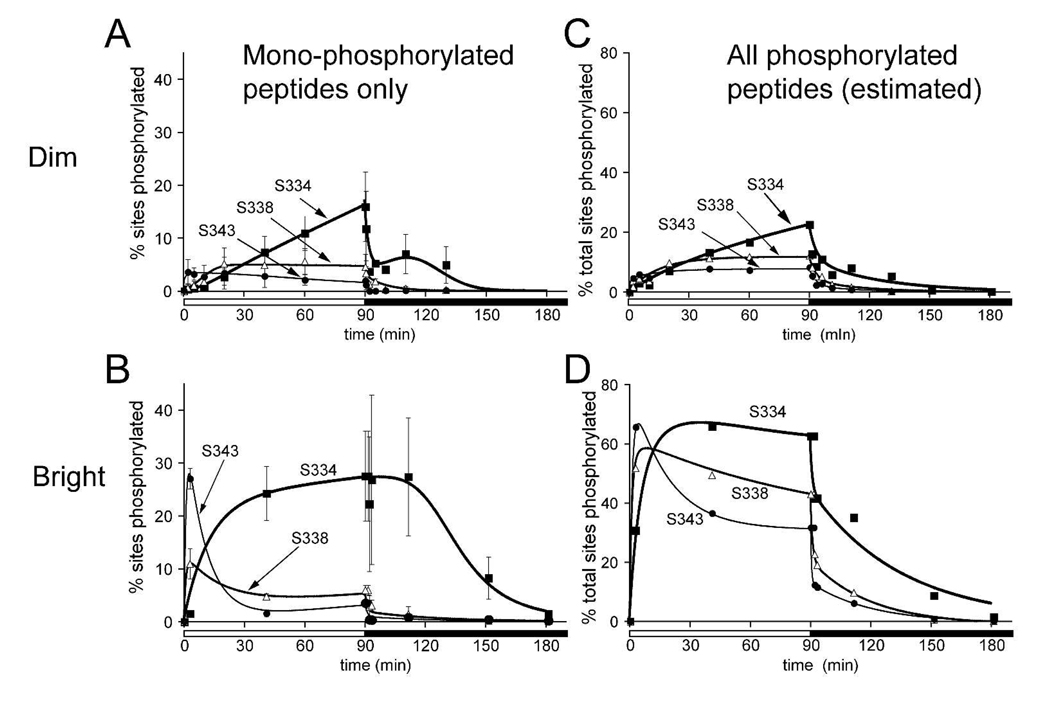
The most abundant species of phosphorylated peptides were monophosphorylated. We directly quantified the sites of phosphorylation on the monophosphrylated C-termini during dim (Fig. 6A) and bright illumination (Fig. 6B). Ser 343 was phosphorylated fastest, followed by Ser 338. Ser 334 was slowest to be phosphorylated. These data are consistent with the relative rates of phosphorylation at these sites following a flash stimulus (7). In the current study using prolonged illumination we found that these sites reached steady state levels of phosphorylation at different times. Ser 343 reached a steady state first, followed by Ser 338, and then Ser 334. After prolonged illumination Ser 334 accumulated the highest level of phosphorylation and Ser 343 had the lowest. Consistent with our previous study of phosphorylation in response to a flash of light (7), we detected only traces of threonine monophosphorylation.
Fig. 6. Quantification of rhodopsin phosphorylation during and after exposure to 90 minutes of dim (A,C) or bright (B,D) illumination.
The abscissa in A and B shows the percentage of sites, Ser334, Ser338 or Ser343, that are phosphorylted only in the monophosphorylated population of rhodopsin. Error bars represent standard deviations. The abscissa in C and D are estimates of the percentage of sites, Ser334, Ser338 or Ser343, that are phosphorylated in the total population of rhodopsin including multiply phosphorylated species. These values were determined as outlined in the text and described in detail by Lee et al., 2002.
Total phosphorylation at each site
We directly quantified sites phosphorylated on monophosphorylated peptides. However those data do not indicate the total phosphorylation at each site because they do not include phosphorylation of each site in multiply-phosphorylated peptides. Therefore, we estimated total phosphorylation at each site in the entire population of rhodopsin (Figs. 6C and 6D). We used MS/MS to estimate the dominant sites of phosphorylation in doubly- and triply-phosphorylated peptides throughout the course of light- and dark-adaptation. Peptides with two phosphates did not resolve into distinct peaks and only one peak of triply phosphorylated peptides was detected. This precluded a direct determination of the distribution of phosphates in the doubly and triply phosphorylated species. Instead we performed MS-MS on these peaks (21) to identify the predominant doubly- and triply-phosphorylated species. The most prominent phosphorylation state in triply-phosphorylated rhodopsin is all three serines phosphorylated. Rhodopsin peptides with two phosphates were dominantly phosphorylated on Ser 338 and Ser 343 early and on Ser 334 and Ser 338 later during light-adaptation. Peptides doubly phosphorylated on both Ser 334 and Ser 343 were not present at detectable levels.
Using this information we estimated total occupancy of the three phosphorylation sites at each time point. Two assumptions were made. First, since little Thr phosphorylation was detected we estimated that all rhodopsins with three or more phosphates have all three Ser phosphorylated. Second, since we did not detect peptides doubly phosphorylated at Ser 334/Ser 343, we assumed Ser 338 is phosphorylated in all doubly phosphorylated rhodopsin.
Initial rates of total phosphorylation were similar to the initial rates of accumulation of the monophosphorylated species, but there is a notable difference. During the steady state the abundance of peptides monophosphorylated either at Ser 343 or at Ser 338 decreased with time. This loss was not due to dephosphorylation. Instead it was caused by addition of phosphates to the monophosphorylated peptides so that they become multiply phosphorylated, i.e. no longer included in the pool of monophosphorylated peptides. When accumulation of multiply phosphorylated species were accounted for, the overall levels of phosphorylation at each of these sites stayed relatively constant once steady state was reached.
Rates of dephosphorylation at each site also were determined by quantifying the disappearance of monophosphorylated species in darkness. For each site there were two rates of dephosphorylation, a fast phase that lasted only for the first few minutes in darkness followed by a slower phase that continued until dark-adapted values were restored.
Evaluation of photoreceptor sensitivity
To establish relationships between the biochemical state of rods and their photosensitivity during light- and dark-adaptation we recorded electroretinograms (ERGs) from mice that had been adapted to the same set of illumination conditions used for the biochemical analyses. We recorded and analyzed a-wave responses elicited by a series of dim to moderate intensity flashes given at various times during dark adaptation. Responses were analyzed only during the dark adaptation period since rods were at or near saturation during light-adaptation under both sets of illumination conditions. Mice were not anaesthetized in these experiments until 5 minutes before the time at which ERGs were measured. Only a single set of ERG responses was recorded from each mouse at each time point to make certain that there were no effects of anesthesia on the biochemistry or physiology of dark adaptation and no effects of the brightest test flashes on the adaptation state.
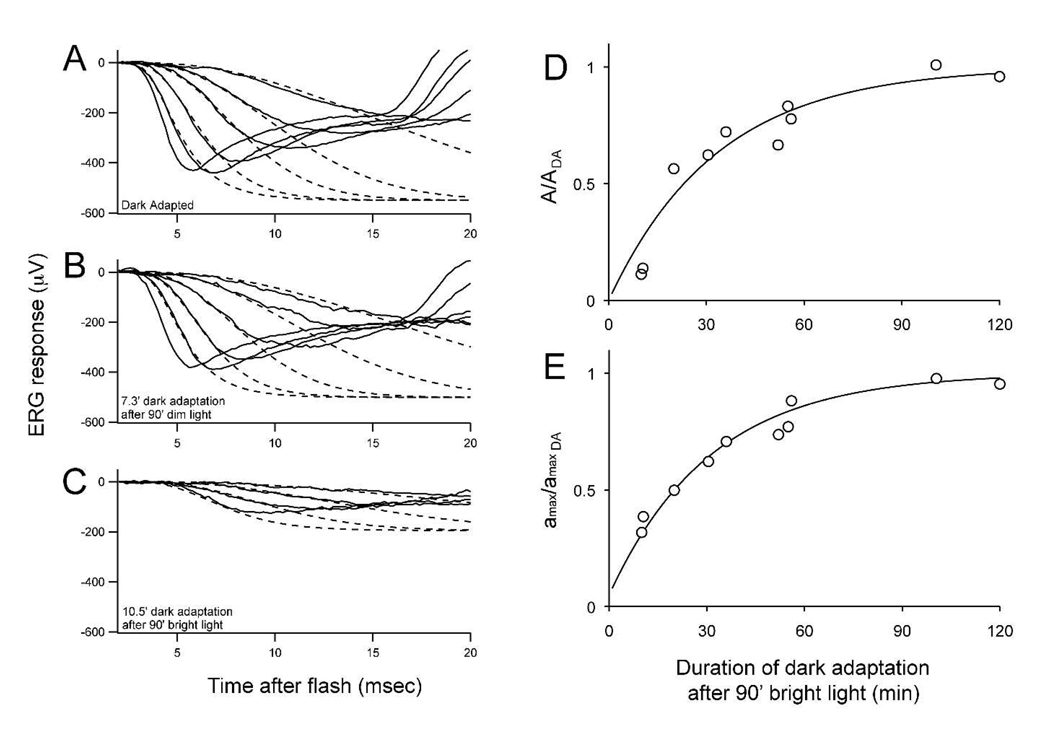
The leading edges of the a-waves were analyzed as an ensemble using a mathematical model of phototransduction (19) corrected for photoreceptor capacitance (20) as previously described (7). These calculations yield two parameters, A and amax. The amplification factor, A, represents the gain of phototransduction and the parameter amax represents the fraction of light-sensitive cGMP-gated channels open just before the flash stimulus used to stimulate the ERG response. The amplification factor was corrected for the changes in abundance of rhodopsin that occur during dark adaptation. Fig. 7 shows how these parameters recover during dark adaptation. Panel A shows a representative analysis from a fully dark-adapted mouse. Both A and amax were nearly unaffected by the dim illumination protocol when measured at the earliest time point (panel B). However, the brighter illumination protocol produced a significant reduction in A and amax (panel C). Dark adaptation restored both A and amax to their initial levels at a rate of ~0.03/min (panels D and E).
Fig. 7. Quantification by ERG of dark adaptation following 90 minutes of light adaptation.
A. a-wave responses from a dark adapted mouse to a series of dim to bright flashes (1400 to 400,000 photoisomerisations per flash). The dashed lines represent fits to a model of phototransduction (described in methods). Average and StDev for the six dark-adapted mice were A = 5.2 +/− 0.3 and amax = 515 +/− 106 µV. B. a-wave and fits for a mouse dark adapted for 7.3 min. following 90 minutes of dim illumination (A = 5.0; amax = 510 µV). C. a-wave and fits for a mouse dark adapted for 10.5 minutes following 90 min of bright illumination (A = 0.4;amax = 194 µV). Recovery of phototransduction parameters, A and amax are shown in the right two panels. D. Recovery of A (0.03/min) and E. recovery of amax (0.032/min) to their dark adapted (DA) values following 90 minutes of bright illumination.
Transducin translocation
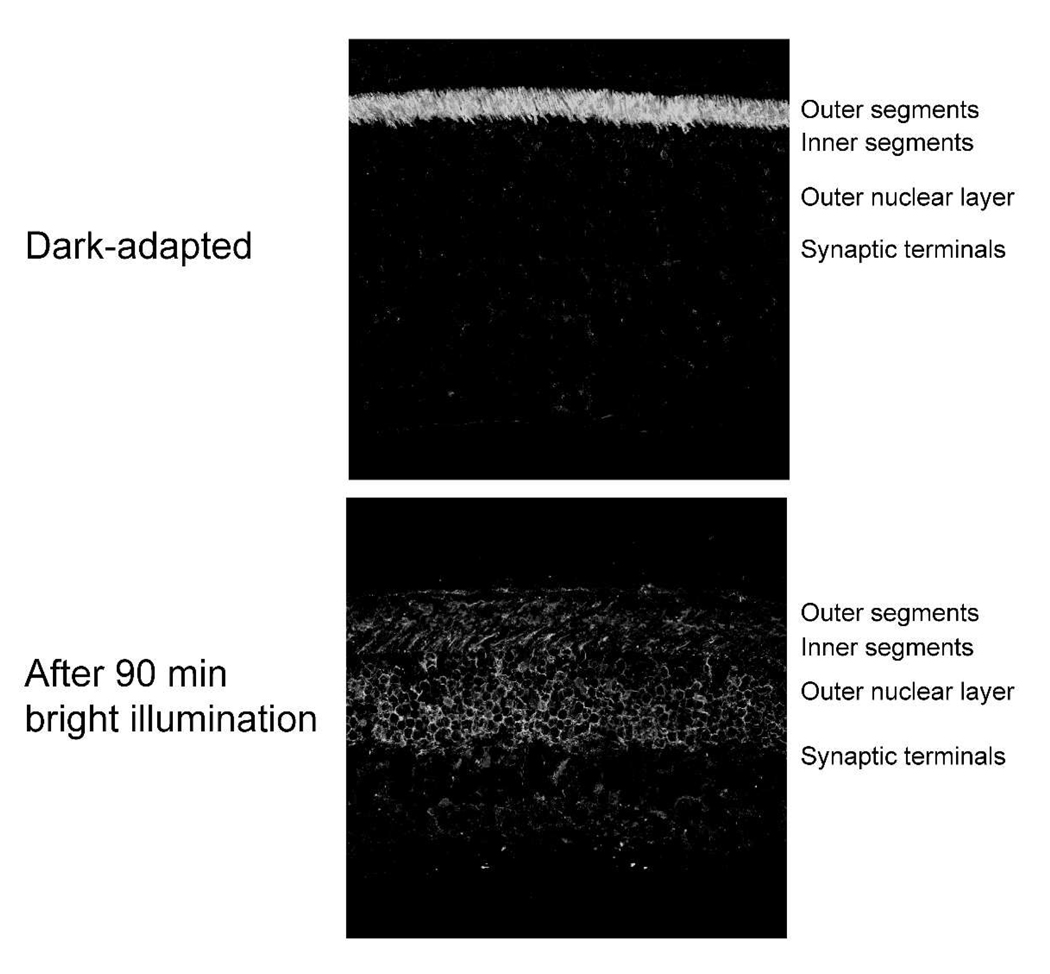
A factor that reduces the efficiency of phototransduction during light-adaptation of rodent retinas is a light-induced redistribution of transducin from confinement in the outer segment to dispersal throughout the entire cell (27–29). Re-sequestration of transducin in the outer segment occurs slowly in darkness with a rate constant of ~0.004/min (29, 30). This is significantly slower than the rates of recovery of dark current (0.035/min), rhodopsin dephosphorylation (0.035), isomerisation/hydrolysis of retinyl ester and rhodopsin regeneration (0.035/min). However, it was important to document whether some of the loss of gain in bright light could come from transducin redistribution. We used immunocytochemical analysis to localize transducin in dark-adapted retinas and in retinas from mice illuminated for 90 minutes with bright light. Fig. 8 shows that the bright protocol does stimulate significant dispersion of transducin from the outer segment. When the dimmer protocol was used there was no substantial dispersion of transducin (not shown). A complete analysis of the redistribution kinetics is beyond the scope of this study.
Fig. 8. The bright illumination condition is sufficient to induce redistribution of transducin α.
Fixed mouse retina sections were probed with an antibody that recognizes the α subunit of transducin. In the dark adapted mouse retina (top panel) transducin α is confined to the outer segment. Following 90 minutes illumination with bright light (bottom panel) transducin α redistributes throughout the entire photoreceptor cell layer. Similar analyses using the dim illumination conditions showed no substantial redistribution of transducin compared to dark adapted retinas (not shown).
Discussion
This study provides new information about the relationships between retinoid metabolism, phosphorylation and dephosphorylation of rhodopsin and visual sensitivity during light- and dark-adaptation.
Retinoid metabolism
Early studies of retinoid metabolism associated with the visual process employed constant illumination of rats followed by recovery in the dark (12–14). These pioneering studies were understandably limited by the methodology available at the time and by the lack of information about the chemistry and enzymology of the visual cycle and phototransduction. Nonetheless, they provided the framework for our modern understanding of the visual cycle. The accumulation of all-trans-retinal and all-trans-retinyl esters that we find during prolonged illumination mirrors the observations of the initial studies and is similar to the transient accumulation of these retinoids following a bright flash (8–11). An unexplained difference is a transient accumulation of retinol observed in the initial studies. Accumulation of retinol was not observed in the studies reported here nor in studies employing flash illumination (8–11). It is possible that the species, strains or the techniques used for retinoid analysis could account for this difference.
In darkness following 90 minutes of bright illumination all-trans-retinal quickly disappears (~0.2/min or faster). On a slower time scale (0.035/min) retinyl esters disappear as 11-cis-retinal forms and regenerates rhodopsin. Clearly, the dominant rate-limiting step for regeneration of rhodopsin under these conditions is isomerohydrolase activity because its substrate is the major form of retinoid that accumulates.
Rates of phosphorylation
Following light adaptation steady state levels of bleached rhodopsin were 15% for dim and 55% for bright illumination. The percentages of rhodopsin with at least one phosphate were 30% and 80% respectively. This shows that substantial amounts of unbleached rhodopsin are in a phosphorylated state under typical illumination conditions.
We also determined the sites and kinetics of phosphorylation and dephosphorylation of rhodopsin. A previous study reported that Ser 334 is the predominant phosphorylation site during constant illumination. (31). Consistent with this, we found monophosphorylated species modified at Ser 334 to be the most abundant after prolonged illumination.
Our analysis of phosphorylated sites during light and dark adaptation makes clear how this occurs. Since Ser 334, Ser 338 and Ser 343 are phosphorylated and dephosphorylated at different rates each takes a different time to reach steady state. During bright illumination some of the rhodopsin phosphorylated at Ser 334 absorbs a photon before that site can be dephosphorylated (right side of Fig. 9). This leads to a gradual accumulation of monophosphorylated rhodopsin and it produces a pattern among the monophosphorylated peptides that changes over time. After a short period of illumination, the predominant form of monophosphorylated rhodopsin is Ser 343. Later Ser 338 predominates and finally Ser 334.
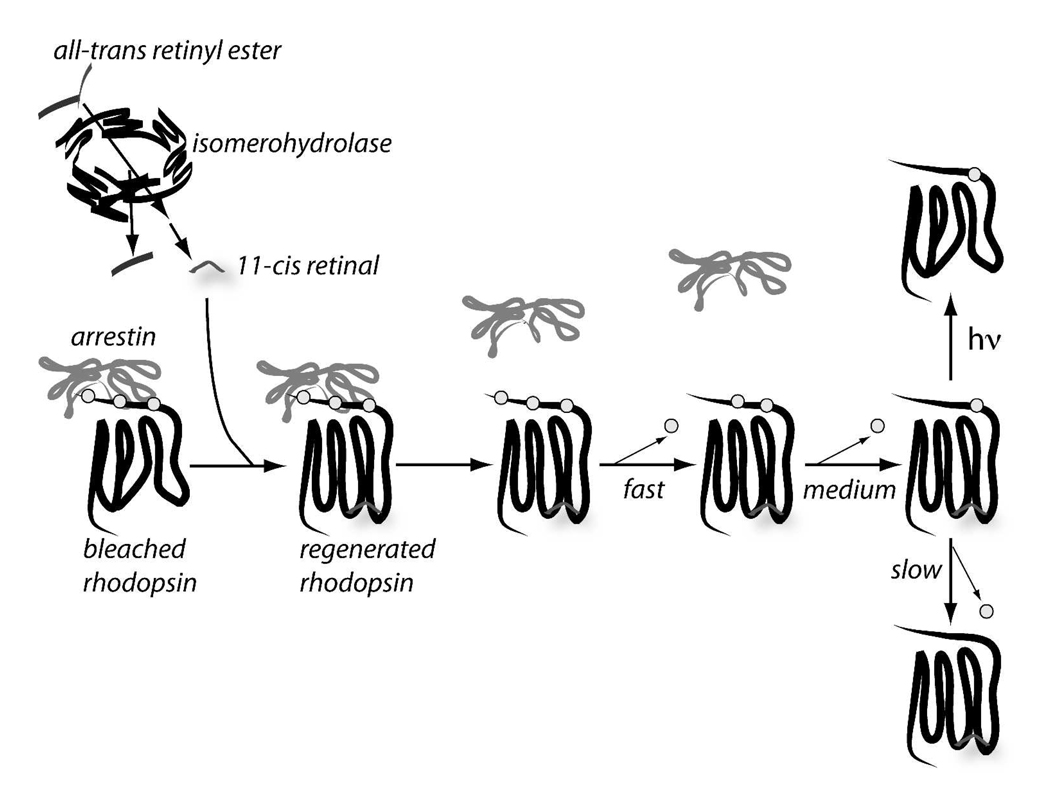
Fig. 9. Schematic model of the steps leading to dephosphorylation of rhodopsin.
Isomerohydrolase activity produces 11-cis retinal, which then regenerates rhodopsin that is phosphorylated and complexed with arrestin. Regeneration releases arrestin so that rhodopsin dephosphorylation can proceed. During bright illumination some regenerated rhodopsin can be bleached before it is completely dephosphorylated.
Gradual accumulation of phosphorylated rhodopsin can contribute to reduced sensitivity in the light-adapted state. Upon photoactivation, a pre-phosphorylated rhodopsin immediately has enhanced affinity for arrestin and reduced ability to activate transducin. It requires only one more phosphate on a rapidly phosphorylated site to quickly increase its affinity for arrestin (32). That shortens the lifetime of the active state and reduces the number of transducins activated per photon.
Dephosphorylation
Our findings are consistent with a model in which dephosphorylation of rhodopsin is limited by the rate of isomerohydrolase activity. The model is shown schematically in Fig. 9. Regeneration of rhodopsin with 11-cis-retinal releases arrestin so that rhodopsin dephosphorylation can proceed. The slow rate of dephosphorylation of Ser334 explains the accumulation of incompletely dephosphorylated regenerated rhodopsin at the last step of this pathway.
Our analyses of dephosphorylation show strikingly different rapid and slow phases. We considered a likely explanation for the origin of the two phases of rhodopsin dephosphorylation. Previous studies showed that arrestin can interfere with dephosphorylation of photoactivated rhodopsin (33) and that arrestin accumulates in the outer segment during sustained illumination (34, 35). Therefore, we propose that the fast phase of dephosphorylation detected in our experiments reflects dephosphorylation of freshly regenerated rhodopsin from which arrestin already has dissociated. The slow phase then represents the rate at which bleached rhodopsin is regenerated and subsequently dissociated from arrestin. We noted that the fraction of rhodopsin that became dephosphorylated at the faster rate was smaller following bright illumination than following dim illumination. This is consistent with less phosphorylated unbleached rhodopsin being present following bright illumination than following dim illumination.
After 90 minutes of dim illumination ~30% of all rhodopsins (including bleached and unbleached) had one or more phosphates while only ~15% of rhodopsin was in the bleached state. Most, if not all, of the 15% of rhodopsin in the bleached state would have had 1 or more phosphates. Therefore, 50% of the rhodopsins with one or more phosphate at the onset of darkness were unbleached. At the end of 90 minutes of bright illumination ~73% of rhodopsins had one or more phosphates and ~55% of rhodopsins were bleached. The 55% of rhodopsins in the bleached state would have had 1 or more phosphates. Therefore, ~28% of the rhodopsins with one or more phosphate at the onset of darkness were unbleached. These estimates are remarkably similar to the parameters used to fit the data shown in Fig. 4. The fits are based on two assumptions. First, the regenerated form of phosphorylated rhodopsin (i.e. the unbleached form) dephosphorylates rapidly (at least 30 times faster than the regeneration rate). Second, there is no net dephosphorylation of bleached rhodopsin until it has been regenerated with 11-cis retinal. The curves are fit assuming that 50% of phosphorylated rhodopsin is dephosphorylated rapidly following dim illumination and only 28% following bright illumination. Also consistent with this model, the rate of the slow phase of dephosphorylation (0.035/min) following both bright and dim illumination is the same as the rate of rhodopsin regeneration and the same as the rate of hydrolysis of retinyl ester. These findings suggest that under normal in vivo conditions photo-activated rhodopsin remains phosphorylated until it is regenerated. This may help to maintain bleached states of rhodopsin at their lowest possible activity levels during the time required to regenerate all the rhodopsin in the cell.
Photoresponse recovery
Amplification (A) and recovery of dark current (amax) recovered quickly following 90 minutes of dim illumination. Our data were not sufficient to determine absolute rates of recovery following dim illumination, but it is obvious that recovery of both A and amax occur faster following dim illumination than following bright illumination.
Following bright illumination recovery of dark current (amax) (0.032/min) correlated closely with dephosphorylation of rhodopsin (0.035/min) and with rhodopsin regeneration (0.035/min). This is consistent with the ability of bleaching states of rhodopsin to produce an “equivalent light” that partially suppresses the dark current (36). The gain of phototransduction, proportional to the ERG parameter, A, recovered at about the same rate (0.03/min), confirming (37) that sensitivity also is affected directly by the presence of bleached rhodopsin. Phosphorylation helps to lower the activity of the bleached rhodopsin (38), but it appears that it cannot completely suppress it. The step that ultimately allows dark current and sensitivity to recover appears to be isomerohydrolase activity, which catalyzes the all-trans to 11-cis isomerisation needed for regeneration of rhodopsin.
Conclusions
Our study confirms that rhodopsin regeneration is the dominant step that limits recovery of phototransduction following long-term exposure to steady bright light. Rhodopsin regeneration is limited primarily by the rate of isomerohydrolase activity. A significant fraction of regenerated rhodopsin is in a phosphorylated state during steady illumination . When illumination is terminated dephosphorylation of that rhodopsin occurs rapidly to restore maximal sensitivity. The fraction of rhodopsin in the bleached state at the time illumination is terminated does not dephosphorylate until it is regenerated. Our study highlights three physiological functions of rhodopsin phosphroylation. First, it inactivates phototransduction. Second, the slow rate of Ser 334 dephosphorylation can help to lower sensitivity during illumination. Third, phosphorylation can help to suppress the activity of bleached rhodopsin during dark adaptation.
Acknowledgements
We wish to thank Jing Huang and Dan Possin for the immunocytochemical analysis.
This work was supported by NIH grants EY06641 EY02317 and by the Core Grant for Vision Research P30EY01730
Abbreviations and Textual Footnotes
- ERG
Electroretinogram
- HPLC
High Performance Liquid Chromatography
- RPE
Retinal Pigment Epithelium
- RPE65
Retinal Pigment Epithelium Protein 65 (Isomerohydrolase)
References
- 1.Arshavsky VY. Rhodopsin phosphorylation: from terminating single photon responses to photoreceptor dark adaptation. Trends Neurosci. 2002;25:124–126. doi: 10.1016/s0166-2236(00)02094-4. [DOI] [PubMed] [Google Scholar]
- 2.Maeda T, Imanishi Y, Palczewski K. Rhodopsin phosphorylation: 30 years later. Prog Retin Eye Res. 2003;22:417–434. doi: 10.1016/s1350-9462(03)00017-x. [DOI] [PubMed] [Google Scholar]
- 3.Matthews HR, Cornwall MC, Fain GL. Persistent activation of transducin by bleached rhodopsin in salamander rods. J Gen Physiol. 1996;108:557–563. doi: 10.1085/jgp.108.6.557. [DOI] [PMC free article] [PubMed] [Google Scholar]
- 4.Lamb TD, Pugh EN., Jr Dark adaptation and the retinoid cycle of vision. Prog Retin Eye Res. 2004;23:307–380. doi: 10.1016/j.preteyeres.2004.03.001. [DOI] [PubMed] [Google Scholar]
- 5.Saari JC. Biochemistry of visual pigment regeneration: the Friedenwald lecture. Invest Ophthalmol Vis Sci. 2000;41:337–348. [PubMed] [Google Scholar]
- 6.Travis GH, Golczak M, Moise AR, Palczewski K. Diseases caused by defects in the visual cycle: retinoids as potential therapeutic agents. Annu Rev Pharmacol Toxicol. 2007;47:469–512. doi: 10.1146/annurev.pharmtox.47.120505.105225. [DOI] [PMC free article] [PubMed] [Google Scholar]
- 7.Kennedy MJ, Lee KA, Niemi GA, Craven KB, Garwin GG, Saari JC, Hurley JB. Multiple phosphorylation of rhodopsin and the in vivo chemistry underlying rod photoreceptor dark adaptation. Neuron. 2001;31:87–101. doi: 10.1016/s0896-6273(01)00340-3. [DOI] [PubMed] [Google Scholar]
- 8.Palczewski K, Van Hooser JP, Garwin GG, Chen J, Liou GI, Saari JC. Kinetics of visual pigment regeneration in excised mouse eyes and in mice with a targeted disruption of the gene encoding interphotoreceptor retinoid-binding protein or arrestin. Biochemistry. 1999;38:12012–12019. doi: 10.1021/bi990504d. [DOI] [PubMed] [Google Scholar]
- 9.Saari JC, Garwin GG, Van Hooser JP, Palczewski K. Reduction of all-trans-retinal limits regeneration of visual pigment in mice. Vision Res. 1998;38:1325–1333. doi: 10.1016/s0042-6989(97)00198-3. [DOI] [PubMed] [Google Scholar]
- 10.Saari JC, Nawrot M, Garwin GG, Kennedy MJ, Hurley JB, Ghyselinck NB, Chambon P. Analysis of the visual cycle in cellular retinol-binding protein type I (CRBPI) knockout mice. Invest Ophthalmol Vis Sci. 2002;43:1730–1735. [PubMed] [Google Scholar]
- 11.Saari JC, Nawrot M, Kennedy BN, Garwin GG, Hurley JB, Huang J, Possin DE, Crabb JW. Visual cycle impairment in cellular retinaldehyde binding protein (CRALBP) knockout mice results in delayed dark adaptation. Neuron. 2001;29:739–748. doi: 10.1016/s0896-6273(01)00248-3. [DOI] [PubMed] [Google Scholar]
- 12.Dowling JE. Chemistry of visual adaptation in the rat. Nature. 1960;188:114–118. doi: 10.1038/188114a0. [DOI] [PubMed] [Google Scholar]
- 13.Noell WK, Delmelle MC, Albrecht R. Vitamin A deficiency effect on retina: dependence on light. Science. 1971;172:72–75. doi: 10.1126/science.172.3978.72. [DOI] [PubMed] [Google Scholar]
- 14.Zimmerman WF, Yost MT, Daemen FJ. Dynamics and function of vitamin A compounds in rat retina after a small bleach of rhodopsin. Nature. 1974;250:66–67. doi: 10.1038/250066a0. [DOI] [PubMed] [Google Scholar]
- 15.Wenzel A, Oberhauser V, Pugh EN, Jr, Lamb TD, Grimm C, Samardzija M, Fahl E, Seeliger MW, Reme CE, von Lintig J. The retinal G protein-coupled receptor (RGR) enhances isomerohydrolase activity independent of light. J Biol Chem. 2005;280:29874–29884. doi: 10.1074/jbc.M503603200. [DOI] [PubMed] [Google Scholar]
- 16.Garwin GG, Saari JC. High-performance liquid chromatography analysis of visual cycle retinoids. Methods Enzymol. 2000;316:313–324. doi: 10.1016/s0076-6879(00)16731-x. [DOI] [PubMed] [Google Scholar]
- 17.Van Hooser JP, Garwin GG, Saari JC. Analysis of visual cycle in normal and transgenic mice. Methods Enzymol. 2000;316:565–575. doi: 10.1016/s0076-6879(00)16750-3. [DOI] [PubMed] [Google Scholar]
- 18.Lyubarsky AL, Pugh EN., Jr Recovery phase of the murine rod photoresponse reconstructed from electroretinographic recordings. J Neurosci. 1996;16:563–571. doi: 10.1523/JNEUROSCI.16-02-00563.1996. [DOI] [PMC free article] [PubMed] [Google Scholar]
- 19.Breton ME, Schueller AW, Lamb TD, Pugh EN., Jr Analysis of ERG a-wave amplification and kinetics in terms of the G-protein cascade of phototransduction. Invest Ophthalmol Vis Sci. 1994;35:295–309. [PubMed] [Google Scholar]
- 20.Smith NP, Lamb TD. The a-wave of the human electroretinogram recorded with a minimally invasive technique. Vision Res. 1997;37:2943–2952. doi: 10.1016/s0042-6989(97)00094-1. [DOI] [PubMed] [Google Scholar]
- 21.Lee KA, Craven KB, Niemi GA, Hurley JB. Mass spectrometric analysis of the kinetics of in vivo rhodopsin phosphorylation. Protein Sci. 2002;11:862–874. doi: 10.1110/ps.3870102. [DOI] [PMC free article] [PubMed] [Google Scholar]
- 22.Wenzel A, Reme CE, Williams TP, Hafezi F, Grimm C. The Rpe65 Leu450Met variation increases retinal resistance against light-induced degeneration by slowing rhodopsin regeneration. J Neurosci. 2001;21:53–58. doi: 10.1523/JNEUROSCI.21-01-00053.2001. [DOI] [PMC free article] [PubMed] [Google Scholar]
- 23.Deigner PS, Law WC, Canada FJ, Rando RR. Membranes as the energy source in the endergonic transformation of vitamin A to 11-cis-retinol. Science. 1989;244:968–971. doi: 10.1126/science.2727688. [DOI] [PubMed] [Google Scholar]
- 24.Gollapalli DR, Rando RR. All-trans-retinyl esters are the substrates for isomerization in the vertebrate visual cycle. Biochemistry. 2003;42:5809–5818. doi: 10.1021/bi0341004. [DOI] [PubMed] [Google Scholar]
- 25.Moiseyev G, Crouch RK, Goletz P, Oatis J, Jr, Redmond TM, Ma JX. Retinyl esters are the substrate for isomerohydrolase. Biochemistry. 2003;42:2229–2238. doi: 10.1021/bi026911y. [DOI] [PubMed] [Google Scholar]
- 26.Palczewski K, Buczylko J, Kaplan MW, Polans AS, Crabb JW. Mechanism of rhodopsin kinase activation. J Biol Chem. 1991;266:12949–12955. [PubMed] [Google Scholar]
- 27.Calvert PD, Strissel KJ, Schiesser WE, Pugh EN, Jr, Arshavsky VY. Light-driven translocation of signaling proteins in vertebrate photoreceptors. Trends Cell Biol. 2006;16:560–568. doi: 10.1016/j.tcb.2006.09.001. [DOI] [PubMed] [Google Scholar]
- 28.Slepak VZ, Hurley JB. Mechanism of light-induced translocation of arrestin and transducin in photoreceptors: interaction-restricted diffusion. IUBMB Life. 2008;60:2–9. doi: 10.1002/iub.7. [DOI] [PMC free article] [PubMed] [Google Scholar]
- 29.Sokolov M, Lyubarsky AL, Strissel KJ, Savchenko AB, Govardovskii VI, Pugh EN, Jr, Arshavsky VY. Massive light-driven translocation of transducin between the two major compartments of rod cells: a novel mechanism of light adaptation. Neuron. 2002;34:95–106. doi: 10.1016/s0896-6273(02)00636-0. [DOI] [PubMed] [Google Scholar]
- 30.Elias RV, Sezate SS, Cao W, McGinnis JF. Temporal kinetics of the light/dark translocation and compartmentation of arrestin and alpha-transducin in mouse photoreceptor cells. Mol Vis. 2004;10:672–681. [PubMed] [Google Scholar]
- 31.Ohguro H, Van Hooser JP, Milam AH, Palczewski K. Rhodopsin phosphorylation and dephosphorylation in vivo. J Biol Chem. 1995;270:14259–14262. doi: 10.1074/jbc.270.24.14259. [DOI] [PubMed] [Google Scholar]
- 32.Vishnivetskiy SA, Raman D, Wei J, Kennedy MJ, Hurley JB, Gurevich VV. Regulation of arrestin binding by rhodopsin phosphorylation level. J Biol Chem. 2007;282:32075–32083. doi: 10.1074/jbc.M706057200. [DOI] [PMC free article] [PubMed] [Google Scholar]
- 33.Palczewski K, McDowell JH, Jakes S, Ingebritsen TS, Hargrave PA. Regulation of rhodopsin dephosphorylation by arrestin. J Biol Chem. 1989;264:15770–15773. [PubMed] [Google Scholar]
- 34.Broekhuyse RM, Tolhuizen EF, Janssen AP, Winkens HJ. Light induced shift and binding of S-antigen in retinal rods. Curr Eye Res. 1985;4:613–618. doi: 10.3109/02713688508999993. [DOI] [PubMed] [Google Scholar]
- 35.Nair KS, Hanson SM, Mendez A, Gurevich EV, Kennedy MJ, Shestopalov VI, Vishnivetskiy SA, Chen J, Hurley JB, Gurevich VV, Slepak VZ. Light-dependent redistribution of arrestin in vertebrate rods is an energy-independent process governed by protein-protein interactions. Neuron. 2005;46:555–567. doi: 10.1016/j.neuron.2005.03.023. [DOI] [PMC free article] [PubMed] [Google Scholar]
- 36.Fain GL, Matthews HR, Cornwall MC. Dark adaptation in vertebrate photoreceptors. Trends Neurosci. 1996;19:502–507. doi: 10.1016/S0166-2236(96)10056-4. [DOI] [PubMed] [Google Scholar]
- 37.Jones GJ, Cornwall MC, Fain GL. Equivalence of background and bleaching desensitization in isolated rod photoreceptors of the larval tiger salamander. J Gen Physiol. 1996;108:333–340. doi: 10.1085/jgp.108.4.333. [DOI] [PMC free article] [PubMed] [Google Scholar]
- 38.Gibson SK, Parkes JH, Liebman PA. Phosphorylation modulates the affinity of light-activated rhodopsin for G protein and arrestin. Biochemistry. 2000;39:5738–5749. doi: 10.1021/bi991857f. [DOI] [PubMed] [Google Scholar]


