

Abstract
In this study, we demonstrate that the E3 ubiquitin ligase gene related to anergy in lymphocytes (GRAIL) is expressed in quiescent naive mouse and human CD4 T cells and has a functional role in inhibiting naive T cell proliferation. Following TCR engagement, CD28 costimulation results in the expression of IL-2 whose signaling through its receptor activates the Akt-mammalian target of rapamycin (mTOR) pathway. Activation of mTOR allows selective mRNA translation, including the epistatic regulator of GRAIL, Otubain-1 (Otub1), whose expression results in the degradation of GRAIL and allows T cell proliferation. The activation of mTOR appears to be the critical component of IL-2R signaling regulating GRAIL expression. CTLA4-Ig treatment blocks CD28 co-stimulation and resultant IL-2 expression, whereas rapamycin and anti-IL-2 treatment block mTOR activation downstream of IL-2R signaling. Thus, all three of these biotherapeutics inhibit mTOR-dependent translation of mRNA transcripts, resulting in blockade of Otub1 expression, maintenance of GRAIL, and inhibition of CD4 T cell proliferation. These observations provide a mechanistic pathway sequentially linking CD28 costimulation, IL-2R signaling, and mTOR activation as important requirements for naive CD4 T cell proliferation through the regulation of Otub1 and GRAIL expression. Our findings also extend the role of GRAIL beyond anergy induction and maintenance, suggesting that endogenous GRAIL regulates general cell cycle and proliferation of primary naive CD4 T cells.
Tolerance mechanisms play an important role in preventing unwanted immune responses including autoimmunity. T cells are rendered tolerant to self through a combined system involving central (1) and peripheral tolerance (2). Among several mechanisms to ensure peripheral tolerance is anergy, a state of unresponsiveness induced in CD4 T cells upon activation in the absence of costimulatory signals (3, 4). In addition to naive CD4 TCR binding to antigenic peptide in the context of MHC, CD28 binding to B7 provided on mature APC allows IL-2 production, a necessary component of naive CD4 T cell activation (5). The necessity for naive CD4 T cells to receive costimulation and signaling through the IL-2R in addition to TCR ligation serves to create a threshold within the peripheral immune system that both ensures the continued survival and sentry functions of the T cells while also maintaining an immune environment free from autoimmunity.
Members of the E3 ubiquitin ligase family have been demonstrated to be important molecular mediators of T cell anergy and peripheral tolerance. The ubiquitination process requires the E1 enzyme to activate ubiquitin, an E2 enzyme to act as a transferase, and an E3 ligase to direct substrate specificity for ubiquitination (6). The E3 ubiquitin ligases Cbl-b, Itch, and gene related to anergy in lymphocyte (GRAIL),3 have all been described as playing a functional role in T cell anergy (7–10). Additionally, Itch has been shown to prevent autoimmune activation of peripheral T cells toward a Th2 bias (11), and Cbl-b attenuates T cell hyperresponsive activation absent CD28 costimulation (12, 13).
GRAIL was first detected during the induction of anergy in CD4 T cell clones (14). These and subsequent experiments, where GRAIL was ectopically expressed in CD4 T cell clones (14), or in peripheral T cells following bone marrow reconstitution with transgenic GRAIL-expressing hemopoietic stem cells (15), demonstrated that GRAIL expression rendered the CD4 T cells anergic as measured by impaired proliferation and IL-2 production. Recently, Rho guanine dissociation inhibitor, involved in actin cytoskeleton rearrangement (16), CD40L, a receptor that drives B cell class switching and APC activation (17), and multiple members of the tetraspanin family (18) have been identified as GRAIL substrates. Otubain-1 (Otub1), a deubiquitinating enzyme (19, 20), was initially identified as a binding partner and subsequently as an epistatic regulator that destabilized GRAIL protein by allowing autoubiquitinated GRAIL to become degraded in the proteosome (21).
Although a role for GRAIL in regulating CD4 T cell proliferation has been demonstrated in clones and in transgenic expression systems, little is known about the expression, regulation, or function of endogenous GRAIL or Otub1 in naive CD4 T cells. In this study, we investigated how the expression of GRAIL and Otub1 is regulated during mouse and human naive CD4 T cell activation. Our findings demonstrate that Otub1 is expressed and GRAIL is degraded when naive CD4 T cells are productively activated to undergo proliferation. The loss of GRAIL is mechanistically controlled through a pathway involving CD28 costimulation, IL-2 production and IL-2R signaling, and ultimately, mTOR-dependent translation of select mRNA. Interference of this pathway using CTLA4-Ig, anti-IL-2, or rapamycin prevents Otub1 protein expression and maintains GRAIL expression, which inhibits T cell proliferation. These findings implicate Otub1 and GRAIL as important components governing T cell unresponsiveness and highlights them as potential therapeutic targets in regulating immune tolerance.
Materials and Methods
Mice
BALB/c, DO11, NOD, and NOD.B10 female mice were purchased from The Jackson Laboratory. DO11 CD28−/− female mice were a gift from Drs. A. Abbas and L. Barron (University of California, San Francisco, CA). All procedures involving mice were conducted in accordance with Institutional Animal Care and Use Committee policies as set forth by Stanford University's Administrative Panel on Laboratory Animal Care, as accredited by the Association for Assessment and Accreditation of Laboratory Animal Care International.
Isolation and stimulation of mouse CD4 T cells
Spleen and lymph nodes were harvested from naive mice and homogenized through a strainer. RBC were lysed from the suspension using red blood cell lysing buffer (Sigma-Aldrich). Lymphocytes were isolated by density centrifugation using Lympholyte-M (Cedarlane Laboratories). CD4+ T cells were sorted via negative selection using an AutoMACS sorter (Miltenyi Biotec). BALB/c CD4+ T cells (5 × 10³) were stimulated in 96-well U-bottom plates with equal numbers of polystyrene latex beads (Interfacial Dynamics) coated with 1.0 μg/ml anti-CD3 (145-2C11; eBioscience) and 0.5 μg/ml anti-CD28 (37.51; eBioscience). For DO11 T cells, 5 × 10³ DO11 CD4+ T cells were stimulated in 96-well U-bottom plates with 104 APC and 50 ng/ml peptide OVA323–339 (pOVA). Rapamycin (Sigma-Aldrich) was used at a concentration of 100 nM. CTLA4-Ig (Abatacept; Bristol-Myers Squibb) was used at a concentration of 10 μg/ml. Anti-IL-2 Ab (JES6-1A12; eBioscience) was used at a concentration of 10 μg/ml. Cells were cultured in RPMI 1640 medium (Invitrogen) supplemented with 10% heat-inactivated FCS (Mediatech), 100 nM sodium pyruvate (Invitrogen), 2 mM l-glutamine (Invitrogen), 100 nM nonessential amino acids (Invitrogen), 100 U/ml penicillin/streptomycin (Invitrogen), and 5 nM 2-ME (Sigma-Aldrich).
Isolation and stimulation of human naive CD4+ CD45RA+ T cells
Human peripheral blood mononucleated cells from buffy coats of different donors were obtained from the Stanford Blood Center under Stanford University Institutional Review Board approval. Buffy coats were separated into leukocytes using Ficoll-Paque Plus (GE Health Sciences). T cells were prepared using a RosetteSep human CD4+ T cell enrichment (Stem Cell Technologies) followed by a Naive CD4+ T cell isolation kit along using LS MACS columns (Miltenyi Biotec). Negatively selected CD4+CD45RA+ CD45RO−CD25− T cells were isolated at 95–99% purity as confirmed by flow cytometry using anti-CD4-FITC (OKT4; eBioscience) and anti-CD45RA-PE (HI100; eBioscience) Ab. CD4+CD45RA+ T cells (5 × 10³) were stimulated in 96-well U-bottom plates with equal numbers of Dynabeads CD3/28 T Cell Expander (Invitrogen) or plate-bound anti-CD3 at 1.0 μg/ml with mitomycin C (Sigma-Aldrich) inactivated APC (anti-CD3/APC). Rapamycin (Sigma-Aldrich) was used at a concentration of 100 nM, and CTLA4-Ig (Abatacept, Bristol-Myers Squibb) was used at a concentration of 10 μg/ml. Agonist anti-CD28 Ab was used at 1.0 μg/ml (CD28.2; eBioscience). Anti-IL-2 Ab (5334; eBioscience) was used at a concentration of 10 μg/ml. Recombinant human IL-2 (PeproTech) was used at a concentration of 10 ng/ml. Cells were cultured in X-Vivo 15 medium (Lonza) supplemented with 10% heat-inactivated FCS (Mediatech), 2 mM l-glutamine (Invitrogen), 100 U/ml penicillin/streptomycin (Invitrogen), and 5 nM 2-ME (Sigma-Aldrich).
Proliferation and cell division assays
Cells cultured in 96-well U-bottom plate wells were pulsed with 1 μCi of methyl-[3H]thymidine (Amersham Biosciences) for 6 h during the last 72 h of stimulation and harvested onto filters (Wallac). Filters were wetted with Betaplate scintillation fluid (PerkinElmer) and counts per minute read on a 1205 Betaplate liquid scintillation counter (Wallac). For CFSE experiments, cells were labeled with 1 μM CFDA-SE (Sigma-Aldrich) in serum-free RPMI 1640 medium for 10 min and washed twice before culturing. CFSE-labeled cells were assayed after 72 h of culture.
Immunoblots
Whole-cell lysates were made using lysis buffer consisting of 0.5% Nonidet P-40, 100 mM sodium chloride, 0.5 mM EDTA, 20 mM Tris (pH 7.6–8.0), with protease inhibitor mixture (Pierce) and phosphatase inhibitor mixture (Pierce). Protein samples were loaded on 4–15% Tris-HCl gels (Bio-Rad) and separated by SDS-PAGE. Protein was transferred from gel to Immobolin-P polyvinylidene difluoride membrane (Millipore) using Trans-Blot SD semidry transfer apparatus (Bio-Rad) following the manufacturer's instructions. StartingBlock (Tris-buffered saline with 0.05% Tween 20) (Pierce) was used to block membranes and was also used during primary and secondary Ab staining. Secondary Abs were all HRP conjugated (Zymed Laboratories). ECL Plus Western blotting reagents (GE Healthcare) were used for chemiluminescent detection of protein. Chemiluminescene signal was exposed onto Amersham Hyperfilm ECL (GE Healthcare). Membranes were stripped using Restore Western blot stripping buffer (Pierce). Densitometry was performed using ImageJ software (National Institutes of Health). Primary Abs used were anti-phospho-4E-BP1 (Thr37/46) (236B4; Cell Signaling Technology), anti-4E-BP1 (53H11; Cell Signaling Technology), anti-β-actin (ab8226; Abcam), anti-phospho-Akt (Ser473) (44-623G; Invitrogen), anti-Akt (9272; Cell Signaling Technology), anti-cyclin D3 (1/cyclin D3; BD Biosciences), anti-GAPDH (ab9485; Abcam), anti-GRAIL (affinity-purified rabbit polyclonal) or anti-GRAIL (H11-744; BD Biosciences), anti-Kip1/p27 (57; BD Biosciences), anti-Otub1 (mouse monoclonal, a gift from Berlex Biosciences), anti-phospho-S6K1 (Thr421/Ser424) (9204; Cell Signaling Technology), anti-S6K1 (9202; Cell Signaling Technology), anti-phospho-STAT5 (Tyr694/699) (8-5-2; Upstate Biotechnology), and anti-STAT5 (9363; Cell Signaling Technology).
Flow cytometry
Samples were stained and washed in PBS with 0.5% BSA and 0.02% sodium azide. Anti-CD25-PE (PC61; BD Biosciences) staining was used at (1/100) dilution on ice, in the dark, for 15 min. Samples were acquired using an LSR flow cytometer (BD Biosciences).
ELISA
Supernatant was collected 24 h after stimulation. Anti-IL-2 capture Ab (JES6-1A12; BD Biosciences) and biotinylated detection Ab (JES6-5H4; BD Biosciences) were used according to the manufacturer's instructions. Detection using ExtrAvidin peroxidase conjugate (Sigma-Aldrich) and 3,3′,5,5′-tetramethylbenzidine liquid substrate system (Sigma-Aldrich) were used according to the manufacturer's instructions.
Microarray analysis
Microarray data of NOD vs NOD.B10 pancreatic lymph node mRNA expression (22) is publicly available at Gene Expression Omnibus (http://www.ncbi.nim.nih.gov/geo), accession number GSE15150, and was analyzed using Matrix2png software (23).
Real-time quantitative PCR
RNA was collected from samples using RNeasy kit (Qiagen). RNA was reverse transcribed into cDNA using Omniscript RT kit (Qiagen), with DNase set (Qiagen). Real-time quantitative PCR was conducted using Brilliant qPCR SYBR Green Mastermix (Stratagene) according to the manufacturer's instructions, and cDNA samples were run on an Mx4000 thermocycler (Stratagene). Primers used for mouse GRAIL: (F) 5′-GCGCAGTCAGCAAATGAA-3′, (R) 5′-TGTCAACATGGGGAACAACA-3′; mouse IL-2: (F) 5′-CCTGAGCAGGATGGAGAATTACA-3′, (R) 5′-TCCAGAACATGCCGCAGAG-3′; mouse Otub1: (F) 5′-CGACTCCGAAGGTGTTAACTGT-3′, (R) 5′-GAGGTCCTTGATCTTCTGTTGG-3′; and mouse β-actin: (F) 5′-CAGGCATTGCTGACAGGATGCA-3′, (R) 5′-GGCCAGGATGGAGCCACCGATC-3′.
Retroviral transduction
Retroviral transduction was performed as described previously (24). Murine GRAIL (Rnf128) cDNA was cloned into the MSCV-IRES-GFP vector, denoted as MSCV-GRAIL-IRES-GFP (GRAIL-expressing). MSCV-GRAIL-IRES-GFP and MSCV-IRES-GFP (vector control) retroviral vectors were used to generate retrovirus for CD4 T cell transduction experiments. The MSCV-IRES-GFP retroviral vector was a gift from Drs. K. Murphy and T. Murphy (Washington University, St. Louis, MO).
Results
GRAIL is expressed in naive CD4 T cells and down-regulated during activation
To ask when and where GRAIL is initially expressed, we examined T cells from the thymus of BALB/c mice. We found that GRAIL was expressed abundantly in Qa-2+ late-stage, and less so in Qa-2− early-stage, single-positive CD4 T cells (Fig. 1A) but not in earlier-stage thymocytes (data not shown). Qa-2 is a nonpolymorphic MHC class I Ag that is expressed on the cell surface of all peripheral CD4 T cells and on the subset of mature single-positive CD4 T cells in the thymus primed for exit to the periphery (25). GRAIL protein is also present in peripheral naive mouse CD4 T cells isolated ex vivo but is lost within 18 h and absent for up to 48 h following anti-CD3/anti-CD28 (anti-CD3/28) activation of these cells (Fig. 1B). These data show that late-stage, single-positive CD4 thymocytes and peripheral, naive CD4 T cells express GRAIL and that GRAIL expression is lost upon activation.
FIGURE 1.
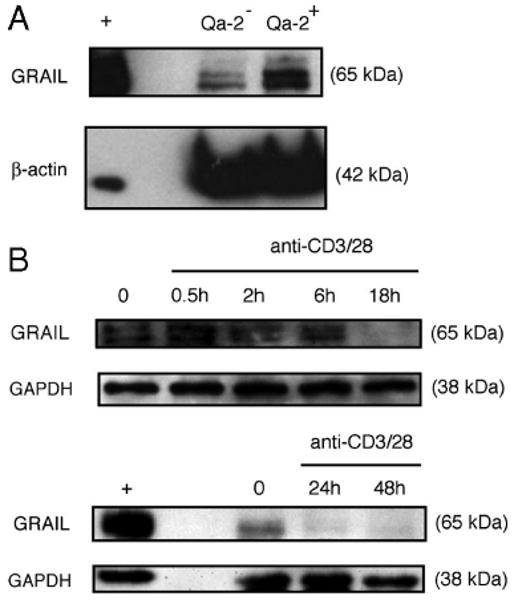
GRAIL expression in naive CD4 T cells. A, GRAIL and β-actin immunoblots of Qa-2+ or Qa-2− CD4 single-positive thymocytes from naive BALB/c mice. B, GRAIL and GAPDH immunoblots of CD4 T cells from naive BALB/c mice at indicated hours of bead stimulation (anti-CD3/28). GRAIL-transfected Jurkat cells were used as a positive control (+). Data are representative of more than three experiments with similar results.
Down-regulation of GRAIL following stimulation of CD4 T cells is required for optimal proliferation
To demonstrate that the loss of GRAIL expression in naive CD4 T cells has a functional consequence, we used retroviral transduction of naive mouse CD4 T cells with GRAIL-expressing or control vector, both expressing GFP as a reporter, and sorted GFP+ cells for analysis (supplemental Fig. 1).4 Twenty-four hours following activation, when endogenous GRAIL is absent, immunoblots of cell lysates verified ectopic GRAIL expression in the CD4 T cells transduced with the GRAIL-expressing vector when compared with vector control transduced cells (Fig. 2A). As a consequence of maintaining transgenic GRAIL expression during anti-CD3/28 activation, proliferation of CD4 T cells transduced to express GRAIL was markedly inhibited compared with vector control-transduced CD4 T cells (Fig. 2B). Thus, GRAIL expressed in peripheral naive CD4 T cells maintains unresponsiveness, and its down-regulation is functionally required during T cell activation to allow proliferation.
FIGURE 2.
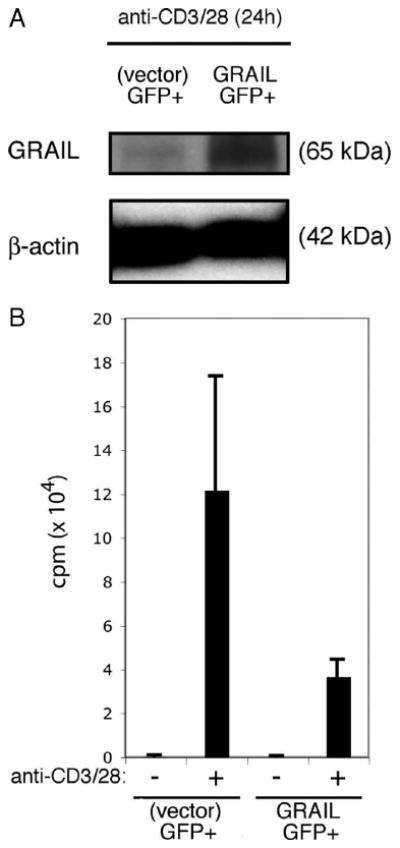
Sustained GRAIL expression following CD4 T cell stimulation diminishes proliferation. A, GRAIL and β-actin immunoblots of CD4 T cells from naive BALB/c mice following retroviral transduction in vitro with GRAIL-GFP or control (vector)-GFP. Protein lysates were made from sorted GFP+ cells from both transduced populations after 24 h of stimulation (anti-CD3/28). B, Proliferation assay of bead stimulated (anti-CD3/28) CD4 T cells retrovirally transduced as in A and sorted for GFP+ cells, without (−) or with (+) stimulation (anti-CD3/28). Error bars indicate SD of triplicates. Measured as counts per minute. Data are representative of two experiments with similar results.
CD28 costimulation is required for GRAIL down-regulation, IL-2 production, and CD4 T cell proliferation
Successful activation of naive CD4 T cells requires both productive TCR/CD3 engagement and CD28 costimulation (26, 27). We confirmed this using naive CD4 T cells from DO11 CD28+/+ or DO11 CD28−/− transgenic BALB/c mice. As expected, in response to Ag-pulsed APC, proliferation of DO11 CD28−/− CD4 T cells was diminished when compared with that of DO11 CD28+/+ CD4 T cells (Fig. 3A). In the absence of CD28 costimulation, IL-2 production was diminished (Fig. 3B), and this diminished production of IL-2 resulted in decreased IL-2R signaling as demonstrated by reduced STAT5 phosphorylation (Fig. 3C). When GRAIL was examined following activation of naive DO11 CD28+/+ or DO11 CD28−/− CD4 T cells, GRAIL expression was markedly diminished in the activated DO11 CD28+/+ cells, while, in comparison, GRAIL expression was maintained in CD4 T cells from the DO11 CD28−/− mice (Fig. 3D). This follows other reports implicating CD28 costimulation during T cell activation as a necessary component in triggering the loss of inhibitory E3 ubiquitin ligases (12, 13), in this case leading to GRAIL degradation.
FIGURE 3.
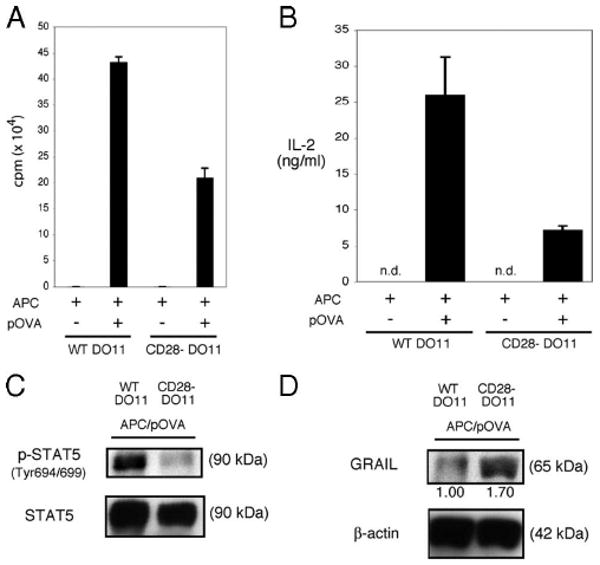
CD28 costimulation is necessary for GRAIL down-regulation. A, Proliferation assay of APC and peptide OVA (pOVA) stimulated DO11 CD4 T cells isolated from naive DO11 CD28+/+ (WT DO11) or DO11 CD28−/− (CD28- DO11) mice. Error bars indicate SD of triplicates. Measured as counts per minute. Data are representative of three experiments with similar results. B, IL-2 ELISA of supernatants collected from DO11 CD4 T cells as in A after 24 h of stimulation (APC/pOVA), measured as ng/ml (n.d., not detected). Error bars indicate SD of triplicates. C, Phospho-STAT5 (Tyr694/699) and total STAT5 immunoblots of re-sorted DO11 CD4 T cells as in A after 48 h of stimulation (APC/pOVA). Data are representative of two experiments with similar results. D, GRAIL and β-actin immunoblots of re-sorted DO11 CD4 T cells as in A after 48 h of stimulation (APC/pOVA). Numbers below blots indicate relative densitometry levels for GRAIL. Data are representative of two experiments with similar results.
IL-2R signaling down-regulates GRAIL, allowing CD4 T cell proliferation
An important function of TCR/CD3 engagement is up-regulation of the IL-2Rα-chain (CD25) to form the high-affinity heterotrimeric IL-2R (28). CD28 costimulation triggers CD4 T cell production of the growth-promoting cytokine IL-2 (29, 30). Thus, following full activation of CD4 T cells, in an autocrine or paracrine fashion, IL-2 engages the high-affinity IL-2R and uses STAT5 and Akt signaling to drive CD4 T cell proliferation and differentiation (31–33). As the absence of CD28 costimulation led to diminished IL-2 production and IL-2R signaling, we investigated the role of IL-2 in modulating GRAIL expression. Blocking IL-2R engagement during mouse naive CD4 T cell activation, using a neutralizing anti-IL-2 Ab, inhibited CD4 T cell proliferation (Fig. 4A) and blocked phosphorylation of STAT5 and Akt (Fig. 4B). As Akt phosphorylation was deficient in the absence of IL-2R signaling, we also observed diminished mTOR activity assessed by decreased phosphorylation of S6K1 and 4E-BP1 (Fig. 4C). This suggested as one possibility that inhibition of IL-2R signaling might result in maintenance of GRAIL expression that would inhibit CD4 T cell proliferation. In support of this possibility, GRAIL expression was maintained following naive CD4 T cell activation in the presence of anti-IL-2 (Fig. 4D). These data suggest that during naive CD4 T cell activation, IL-2 production and IL-2R engagement are necessary for GRAIL degradation.
FIGURE 4.
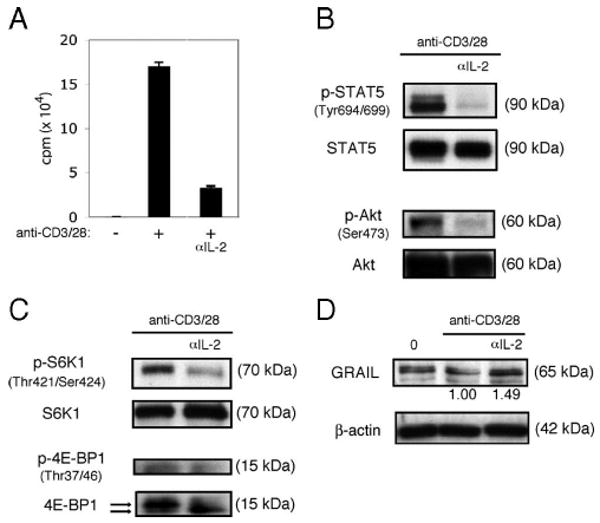
IL-2R signaling down-regulates GRAIL. A, Proliferation assay of CD4 T cells isolated from naive BALB/c mice with (+) or without (−) bead stimulation (anti-CD3/28), including anti-IL-2 Ab (αIL-2) condition. Error bars indicate SD of triplicates. Measured as counts per minute. B, Phospho-STAT5 (Tyr694/699), total STAT5, phospho-Akt (Ser473), and total Akt immunoblots of CD4 T cells as in A after 48 h of bead stimulation. Data are representative of three experiments with similar results. C, Phospho-S6K1 (Thr421/Ser424), total S6K1, phospho-4E-BP1 (Thr37/46), and total 4E-BP1 immunoblots of CD4 T cells as in A after 48 h of bead stimulation. On total 4E-BP1 immunoblot, top arrow indicates hyperphosphorylated form and bottom arrow indicates hypophosphorylated form. Data are representative of three experiments with similar results. D, GRAIL and β-actin immunoblots of CD4 T cells as in A, ex vivo (0) or after 48 h of bead stimulation. Numbers below blots indicate relative densitometry levels for GRAIL. Data are representative of three experiments with similar results.
mTOR inhibition prevents Otub1 protein expression and maintains GRAIL, resulting in diminished cell proliferation
mTOR is a signal transduction kinase whose phosphorylation and subsequent kinase activity promote both overall protein translation and augment specific protein translation of a subset of mRNA (34). mTOR phosphorylation depends on the input of growth factor signals received by the cell, and mTOR kinase activity can be monitored by phosphorylation of S6K1 and 4E-BP1 (35). When T cells are productively stimulated, mTOR is activated through phosphorylation via a pathway involving phosphorylated Akt (36). Activated mTOR phosphorylates its targets S6K1 and 4E-BP1 (35). mTOR activated through phosphorylation is involved in T cell activation (37–40) and trafficking (41). Because CD28 costimulation drives production of IL-2, and IL-2R engagement and signaling are both important growth signals for CD4 T cells and activate Akt and mTOR, we directly assessed the involvement of mTOR by using the small molecule mTOR inhibitor, rapamycin. As expected, treatment with rapamycin during activation of mouse naive CD4 T cells resulted in the inhibition of mTOR activity as demonstrated by lack of phosphorylation of S6K1 and 4E-BP1 (Fig. 5A). As inhibition of IL-2R signaling during activation coincided with diminished mTOR activity and maintenance of GRAIL expression, we reasoned that rapamycin blockade of mTOR activity might lead to a decrease in Otub1 expression, accounting for the continued presence of GRAIL. When assessing Otub1 mRNA levels during mouse naive CD4 T cell activation in the presence or absence of mTOR inhibition, however, there was no demonstrable correlation between Otub1 mRNA levels and GRAIL expression. Activation of the T cells increased the level of Otub1 mRNA with or without the addition of rapamycin (Fig. 5B, left panel), whereas GRAIL mRNA levels were decreased regardless of the absence or presence of rapamycin (Fig. 5B, right panel). However, GRAIL protein was shown to be absent when mTOR was active and present when mTOR was inactive, and direct inhibition of mTOR activity by rapamycin inhibited proliferation (Fig. 5C) and cell division (supplemental Fig. 2).4 Expression of cyclin D3, a pro-cell cycle molecule (42), and p27/Kip1, an anti-cell cycle molecule (43), were diminished and increased, respectively, with rapamycin treatment (Fig. 5D). These discordant results were resolved by investigating Otub1 protein expression levels following rapamycin treatment. We had previously demonstrated that human Otub1 protein leads to degradation of human GRAIL protein (21), and in a similar manner, murine Otub1 protein leads to murine GRAIL protein degradation (supplemental Fig. 3).4 Ex vivo-isolated naive CD4 T cells express no Otub1 protein, thus allowing GRAIL expression (Fig. 5E, first lane), despite the presence of detectable Otub1 mRNA as mTOR-mediated protein translation is inactive in these cells. Upon stimulation, mTOR is activated and Otub1 protein is expressed, leading to the degradation of GRAIL (Fig. 5E, second lane). When mTOR is inhibited by rapamycin treatment during stimulation, although Otub1 mRNA is up-regulated, Otub1 protein is not expressed, allowing GRAIL to be maintained (Fig. 5E, third lane). Although regulation of GRAIL mRNA levels may be involved in GRAIL protein down-regulation upon stimulation, protein expression is dominantly influenced by regulatory factors at the protein level. These findings show that mTOR activation is required for naive CD4 T cell proliferation by permitting Otub1 protein expression and GRAIL degradation. Consistent with the mTOR function of promoting mRNA translation through activation of its downstream targets S6K1 and 4E-BP1, these results support our hypothesis that regulation of GRAIL expression by mTOR is at the Otub1 protein expression level.
FIGURE 5.
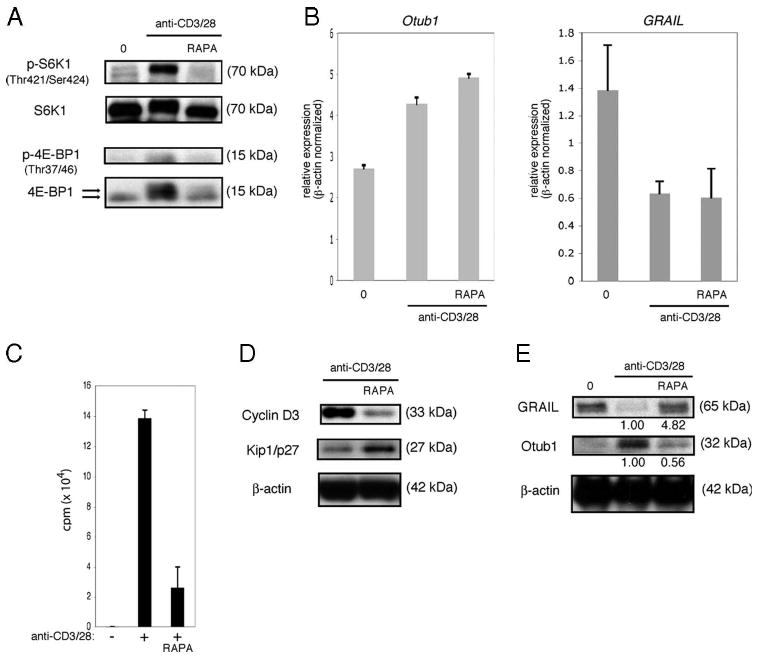
mTOR inhibition maintains GRAIL expression. A, Phospho-S6K1 (Thr421/Ser424), total S6K1, phospho-4E-BP1 (Thr37/46), and total 4E-BP1 immunoblots of CD4 T cells isolated from naive BALB/c mice ex vivo (0), or after 48 h of bead stimulation (anti-CD3/28), including rapamycin (RAPA). On total 4E-BP1 immunoblot, top arrow indicates hyperphosphorylated form and bottom arrow indicates hypophosphorylated form. Data are representative of more than three experiments with similar results. B, Otub-1 (left panel) or GRAIL (right panel) expression levels of CD4 T cells as in A, ex vivo (0) or after 24 h bead stimulation (anti-CD3/28), including RAPA. Otub-1 or GRAIL expression levels were normalized to β-actin expression levels. Error bars indicate SD of triplicates. Data are representative of two experiments with similar results. C, Proliferation assay of CD4 T cells as in A, without (−) or with (+) bead stimulation (anti-CD3/28), including RAPA. Error bars indicate SD of triplicates. Measured as counts per minute. Data are representative of three experiments with similar results. D, Cyclin D3, Kip1/p27, and β-actin immunoblots of CD4 T cells as in A after 48 h of bead stimulation (anti-CD3/28), including RAPA. Data are representative of three experiments with similar results. E, GRAIL, Otub1, and β-actin immunoblots of CD4 T cells as in A, ex vivo (0), or after 48 h of bead stimulation (anti-CD3/28), with RAPA. Numbers below blots indicate relative densitometry levels for GRAIL or Otub1. Data are representative of three experiments with similar results.
mTOR is the downstream critical component of IL-2R signaling regulating Otub1 and GRAIL
Inhibition of mTOR activity is sufficient to block Otub1 protein expression and maintain GRAIL, resulting in diminished cell proliferation. However, direct inhibition of mTOR activity by rapamycin may have been indirectly due to diminished IL-2 production and IL-2R signaling. As evidence of this possibility, we observed decreased IL-2 mRNA levels (Fig. 6A) and IL-2 production (Fig. 6B) by naive CD4 T cells stimulated in the presence of rapamycin. This diminution of IL-2 may have had a quantitative effect on IL-2R signaling or may have arisen through a delay in IL-2 production during an early critical phase, subsequently affecting GRAIL expression and proliferation. The activation-induced component of the high-affinity IL-2R, CD25 (IL-2Rα), was increased to similar levels when stimulated in the presence or absence of rapamycin (Fig. 6C). This indiscriminate up-regulation of CD25 enables potentially equivalent IL-2R signaling; however, diminished IL-2 production in the presence of rapamycin may still have accounted for the observed differences. We reasoned that addition of exogenous IL-2 at the start of activation could compensate for either diminished or delayed IL-2 production in the presence of rapamycin; however, addition of exogenous IL-2 did not overcome the rapamycin induced inhibition of cell proliferation (Fig. 6D). Following exogenous IL-2 addition, rapamycin did not inhibit phosphorylation of STAT5 or Akt but specifically inhibited mTOR activity as demonstrated by decreased phosphorylation of S6K1 and 4E-BP1, reduced Otub1 protein, and maintenance of GRAIL (Fig. 6E). The intact phosphorylation of Akt was seen at both Ser473 and Thr308 (data not shown), suggesting the absence of any secondary effects by rapamycin inhibition of mTOR on the ability of the T cells to activate Akt. Thus, the critical component of IL-2R signaling regulating Otub1 and GRAIL, and their subsequent effects on proliferation, appears to be mTOR. Inhibition of mTOR, even in the presence of phosphorylated STAT5 and Akt, blocked Otub1 protein expression and maintained GRAIL expression, resulting in the inhibition of cell proliferation.
FIGURE 6.
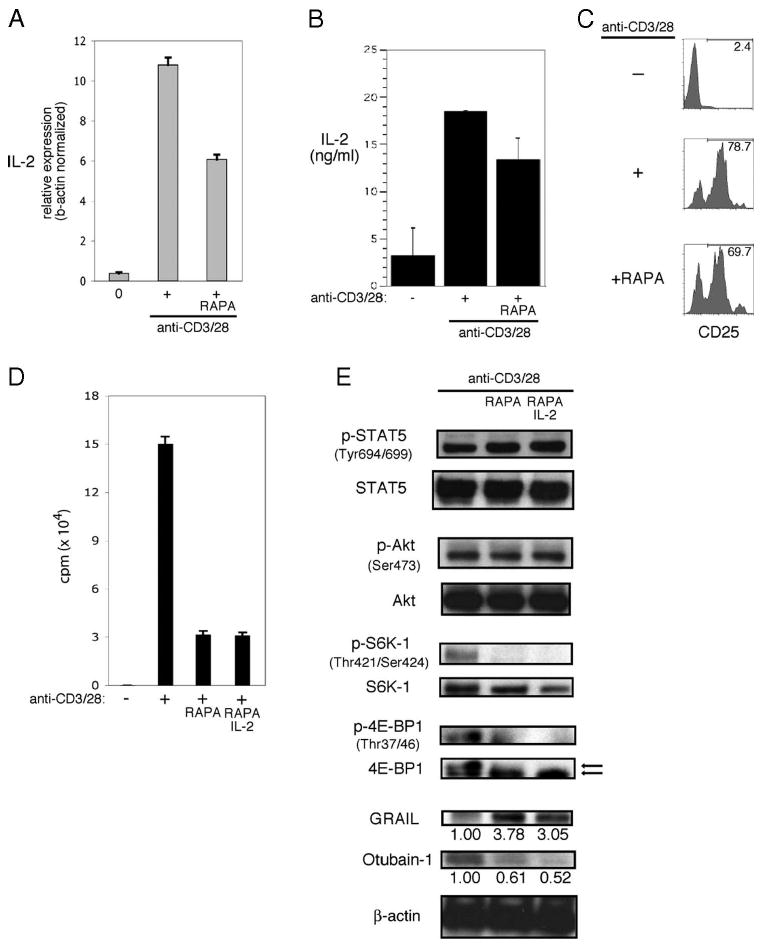
IL-2R signaling requires mTOR activation to regulate GRAIL. A, IL-2 expression levels of CD4 T cells isolated from naive BALB/c mice and RNA harvested from ex vivo (0), or after 24 h bead stimulation (anti-CD3/28), including Rapamycin (RAPA). IL-2 expression levels were normalized to β-actin expression levels. Error bars indicate SD of triplicates. Data are representative of two experiments with similar results. B, IL-2 ELISA of supernatants collected from CD4 T cells as in A, unstimulated (−) or after 24 h of bead stimulation, including RAPA, measured as ng/ml. Error bars indicate SD of triplicates. C, CD25 cell surface staining by flow cytometry of CD4 T cells as in A, unstimulated (−), or after 24 h of bead stimulation, including RAPA and IL-2. Numbers indicate percent CD25 positive. D, Proliferation assay of CD4 T cells as in A, without (−) or with (+) bead stimulation (anti-CD3/28), including RAPA. Error bars indicate SD of triplicates. Measured as counts per minute. Data are representative of three experiments with similar results. E, Phospho-STAT5 (Tyr694/699), total STAT5, phospho-Akt (Ser473), total Akt, phospho-S6K1 (Thr421/Ser424), total S6K1, phospho-4E-BP1 (Thr37/46), total 4E-BP1, GRAIL, Otub1, and β-actin immunoblots of CD4 T cells as in A, after 48 of bead stimulation (anti-CD3/28), including RAPA and IL-2. On total 4E-BP1 immunoblot, top arrow indicates hyperphosphorylated form and bottom arrow indicates hypophosphorylated form. Numbers below blots indicate relative densitometry levels for GRAIL or Otub1.
Human naive CD4 T cells require CD28 co-stimulation and IL-2R signaling during stimulation to down-regulate GRAIL
GRAIL and Otub1 interactions were originally identified in a yeast two-hybrid screen using a human genomic library (21). Recent studies have demonstrated that GRAIL expression is associated with anergy and inhibition of proliferation during human CD4 T cell activation (44). Thus, we asked whether human GRAIL and Otub1 regulation used the same pathway as that described in mouse naive CD4 T cells by examining activation of human naive CD4+CD45RA+ T cells (supplemental Fig. 4).4 We initially demonstrated that GRAIL was expressed in human naive CD4+ CD45RA+ T cells isolated ex vivo and, following stimulation using plate-bound anti-CD3 and APC (added to supply B7 for CD28 costimulation; supplemental Fig. 5i),4 GRAIL expression was lost, and Otub1 protein expression was observed (Fig. 7A). The proliferation of human naive CD4+ CD45RA+ T cells, activated in this manner, was inhibited when CTLA4-Ig was included in the culture, but proliferation was restored if agonist anti-CD28 Ab was added to the CTLA4-Ig containing cultures (Fig. 7B and supplemental Fig. 5ii).4 CTLA4-Ig inhibition of CD28 costimulation resulted in diminished cyclin D3 and increased Kip1/p27, which was also reversed by the addition of agonist anti-CD28 Ab (Fig. 7C). When CD28 costimulation was blocked by CTLA4-Ig treatment, IL-2R signaling was impaired as seen by a decrease in phosphorylation of STAT5 and reversed by the addition of agonist anti-CD28 Ab (Fig. 7D). Addition of exogenous IL-2 to CTLA4-Ig treatment reversed the inhibition of proliferation (supplemental Fig. 6),4 suggesting that the lack of CD28 costimulation did not inhibit IL-2R up-regulation but that IL-2 production was impaired.
FIGURE 7.
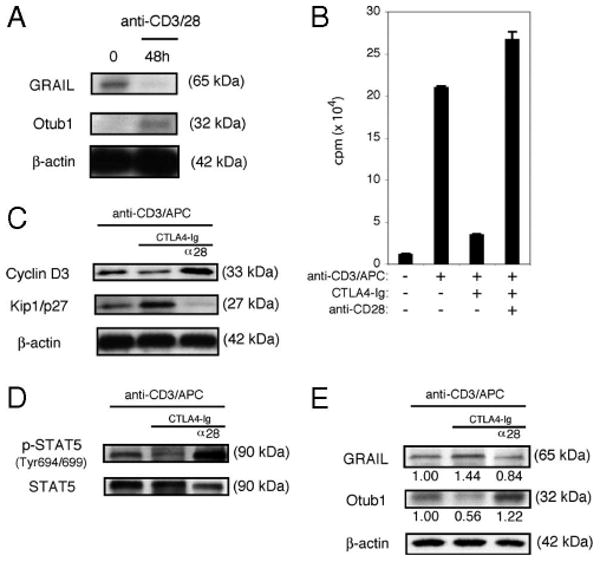
Human naive CD4 T cells down-regulate GRAIL through CD28 costimulation. A, GRAIL, Otub1, and β-actin immunoblots of human naive CD4+CD45RA+ ex vivo (0), or after 48 h of bead stimulation (anti-CD3/28). Data are representative of three experiments from different donors with similar results. B, Proliferation assay of CD4 T cells as in A, without (−) or with (+) stimulation (anti-CD3/APC), including CTLA4-Ig and anti-CD28. Error bars indicate SD of triplicates. Measured as counts per minute. Data are representative of two experiments from different donors with similar results. C, Cyclin D3, Kip1/p27, and β-actin immunoblots of CD4 T cells as in A, after 48 h of stimulation (anti-CD3/APC), including CTLA4-Ig and anti-CD28 (α28). Data are representative of two experiments from different donors with similar results. D, Phospho-STAT5 (Tyr694/699) and total STAT5 immunoblots of CD4 T cells as in A, after 48 h of stimulation (anti-CD3/APC), including CTLA4-Ig and anti-CD28 (α28). Data are representative of two experiments from different donors with similar results. E, GRAIL, Otub1, and β-actin immunoblots of CD4 T cells as in A, after 48 h of stimulation (anti-CD3/APC), including CTLA4-Ig and anti-CD28 (α28). Data are representative of two experiments from different donors with similar results.
The inhibition of CD28 costimulation by CTLA4-Ig treatment blocked Otub1 expression and sustained GRAIL expression, and this effect could be reversed by the addition of agonist anti-CD28 Ab (Fig. 7E). These findings in human naive CD4 T cells mirror our findings in mouse naive CD4 T cells. We conclude that CD28 costimulation, and resultant IL-2 production and IL-2R signaling, are important events regulating Otub1 and GRAIL expression and proliferation in human as well as mouse naive CD4 T cells.
Human naive CD4 T cells require mTOR activation to allow Otub1 protein expression and GRAIL degradation
Since human naive CD4 T cells require CD28 costimulation and IL-2R signaling to modulate GRAIL expression, we reasoned that the mTOR pathway might also control human Otub1 and GRAIL expression. CD28 costimulation blockade of human naive CD4 T cell activation resulted in decreased phosphorylation of Akt, an upstream component within the mTOR activation pathway (Fig. 8A). In examining mTOR activity, phosphorylation of S6K1 and 4E-BP1 were both down-regulated in the presence of CTLA4-Ig and restored with direct agonist anti-CD28 Ab costimulation (Fig. 8B). Treatment of human naive CD4 T cells with rapamycin did not affect the phosphorylation of STAT5 or Akt but resulted in the inhibition of mTOR activity as measured by decreased phosphorylation of S6K1 and 4E-BP1 (Fig. 8C), similar to results seen in mouse CD4 T cells. Rapamycin treatment inhibited human naive CD4 T cell proliferation (Fig. 8D) and resulted in decreased Cyclin D3 and increased Kip1/p27 levels (Fig. 8E). Human naive CD4 T cells activated in the presence of rapamycin failed to up-regulate Otub1 protein and maintained GRAIL expression (Fig. 8F). These results are identical to the effects seen in mouse naive CD4 T cells.
FIGURE 8.
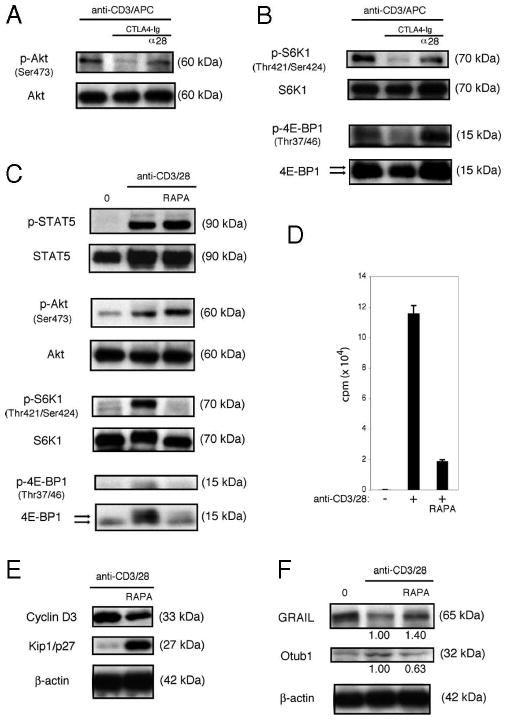
Activation of mTOR is required for human naive CD4 T cells to down-regulate GRAIL. A, Phospho-Akt (Ser473) and total Akt immunoblots of human naive CD4+CD45RA+ T cells after 48 h of stimulation (anti-CD3/APC), including CTLA4-Ig and anti-CD28 (α28). Data are representative of two experiments from different donors with similar results. B, Phospho-S6K1 (Thr421/Ser424), total S6K1, phospho-4E-BP1 (Thr37/46), total 4E-BP1 immunoblots of CD4 T cells as in A, after 48 h of stimulation (anti-CD3/APC), including CTLA4-Ig and anti-CD28 (α28). On total 4E-BP1 immunoblot, top arrow indicates hyperphosphorylated form and bottom arrow indicates hypophosphorylated form. Data are representative of two experiments from different donors with similar results. C, Phospho-STAT5 (Tyr694/699), total STAT5, phospho-Akt (Ser473), total Akt, phospho-S6K1 (Thr421/Ser424), total S6K1, phospho-4E-BP1 (Thr37/46), and total 4E-BP1 immunoblots of CD4 T cells as in A, after 48 h of bead stimulation (anti-CD3/28), including rapamycin (RAPA). On total 4E-BP1 immunoblot, top arrow indicates hyperphosphorylated form and bottom arrow indicates hypophosphorylated form. Data are representative of three experiments from different donors with similar results. D, Proliferation assay of CD4 T cells as in A, without (−) or with (+) bead stimulation (anti-CD3/28), RAPA. Error bars indicate SD of triplicates. Measured as counts per minute. Data are representative of three experiments from different donors with similar results. E, Cyclin D3, Kip1/p27, and β-actin immunoblots of CD4 T cells as in A, after 48 h of stimulation (anti-CD3/28), including RAPA. Data are representative of three experiments from different donors with similar results. F, GRAIL, Otu1, and β-actin immunoblots of CD4 T cells as in A, after 48 h of stimulation (anti-CD3/28), including RAPA. Data are representative of three experiments from different donors with similar results.
Discussion
GRAIL is expressed in human and mouse naive CD4 T cells, and its degradation following TCR/CD3 engagement and costimulation is required for proliferation. These data demonstrate a role for GRAIL in controlling naive CD4 T cell activation and proliferation in addition to GRAIL's role in the induction and maintenance of anergy. As demonstrated in these studies, not only TCR/CD3 engagement and CD28 costimulation are required for full activation, IL-2 production and IL-2R signaling are also necessary to allow proliferation. Phosphorylation of Akt following IL-2R engagement drives mTOR activation leading to Otub1 protein expression, degradation of GRAIL, and T cell proliferation. These data demonstrate a pathway of GRAIL regulation that links critical components of CD4 T cell stimulation to CD4 T cell proliferation. Interference in this pathway highlights the potential importance of this pathway in peripheral T cell tolerance and may suggest new targets for immunotherapeutics (Fig. 9).
FIGURE 9.
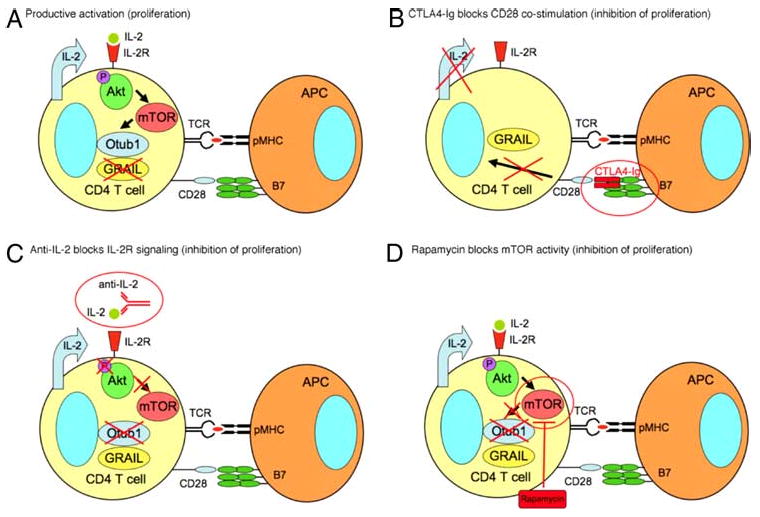
The CD28 costimulation, IL-2 signaling, and mTOR pathway regulate Otub1 and GRAIL expression, controlling proliferation in primary naive CD4 T cells. CTLA4-Ig, anti-IL-2, and Rapamycin regulation of Otub1 and GRAIL expression controls naive CD4 T cell proliferation. A, Productive activation of naive CD4 T cells leading to proliferation comes about through TCR engagement and CD28 costimulation, IL-2 production, signaling through the IL-2R leading to phosphorylation of Akt and activation of mTOR, expression of Otub1 protein, and subsequent GRAIL degradation, allowing proliferation to occur. B, CTLA4-Ig blocks CD28 costimulation, does not allow IL-2 production, thus prevents Akt phosphorylation, mTOR is inactive, and Otub1 protein is absent, leading to the maintenance of GRAIL, inhibiting proliferation. C, Anti-IL-2 blocks IL-2R engagement, thus preventing Akt phosphorylation, mTOR is inactive, and Otub1 protein is absent, leading to the maintenance of GRAIL, inhibiting proliferation. D, Rapamycin blocks the activity of mTOR, prevents protein expression of Otubain-1, leading to the maintenance of GRAIL, inhibiting proliferation.
Our results link TCR/CD3 engagement and CD28 costimulation with IL-2 production and IL-2R signaling to activation of mTOR kinase that is required for activation induced proliferation of human and mouse naive CD4 T cells. Our studies highlight the importance of IL-2R signaling in sustaining mTOR activation during naive CD4 T cell activation. However, we also found that at early times (10 min to 1 h) following activation by CD3 and CD28 signaling, Akt is phosphorylated even in the presence of anti-IL-2 Abs, resulting in mTOR activation independent of IL-2R signaling (our unpublished observations) in agreement with previous reports (36, 40). This discrepancy is resolved by differentiating the IL-2R signaling requirement at different time points following naive CD4 T cell activation. At later times (24–72 h) following activation, IL-2R signaling was required for sustained mTOR activity as anti-IL-2 Abs blocked phosphorylation of Akt and mTOR activation at these later time points (Fig. 4, B and C), resulting in the sustained presence of GRAIL (Fig. 4D) and decreased proliferation (Fig. 4A).
Previous studies have implicated S6K1 regulation by mTOR in CD4 T cell activation (39, 45), identifying a role for this pathway in directing mTOR-dependent protein translation. In this study, we demonstrate that naive CD4 T cells also regulate 4E-BP1 through the mTOR-dependent pathway via phosphorylation on Thr37/46. Phosphorylation of 4E-BP1 leads to its dissociation from eIF4E, allowing active eIF4E to bind eIF4G during translation initiation complex formation (46). A functional consequence attributed to active eIF4E is preferential translation of specific mRNAs normally translated into protein at low or absent rates (47, 48). The phosphorylation of 4E-BP1, and subsequent activation of eIF4E, may allow protein translation of a subset of mRNAs important for T cell activation. We propose that Otub1 mRNA is under such regulation as its protein expression does not appear to be mediated through changes in mRNA transcript levels yet is sensitive to mTOR inhibition. The therapeutic effects of rapamycin in the inhibition of CD4 T cell activation and proliferation may be due not only to decreased overall protein translation but also to prevention of translation of a subset of mRNAs critical for successful activation.
This study is the first demonstration that endogenous GRAIL protein regulation in primary human and mouse naive CD4 T cells plays an important role in controlling T cell activation and proliferation. In mice, GRAIL expression can be traced to Qa-2+ CD4 single-positive thymocytes poised for export to the periphery; thus, GRAIL expression may be an important component of peripheral tolerance in naive CD4 T cells, in addition to its role in CD4 T cell anergy. Qa-2+ CD4 single-positive thymocytes, but not earlier stage thymocytes, respond to TCR ligation in a manner similar to peripheral CD4 T cells (49). The observations of GRAIL expression in Qa-2+ CD4 single-positive thymocytes and expression in peripheral naive CD4 T cells suggest a possible role for GRAIL in CD4 T cell tolerance to TCR self-peptide/MHC encountered during the transition from the thymus to the peripheral environment. TCR engagement of self selecting-peptide/MHC needs to remain a nonresponsive event for the naive CD4 T cell, and yet TCR engagement is necessary for maintaining their survival and keeping them poised for potential activation by non-self (50–55). When foreign Ag is presented as non-self-peptide in the context of MHC class II, the increased affinity/avidity of the TCR engagement, as well as the presence of danger-induced APC costimulatory signals following B7-CD28 ligation, breaks the quiescent state of the naive CD4 T cell that these data suggest is maintained by GRAIL. IL-2 signals through the IL-2R on CD4 T cells via mTOR to ensure GRAIL degradation to allow proliferation. Thus, maintenance of GRAIL serves to preserve quiescence of naive CD4 T cells and its down-regulation is required to allow proliferation.
Anergic CD4 T cells express multiple E3 ubiquitin ligases, suggesting possible unique roles in maintaining cellular nonresponsiveness (7, 9). The differential expression of these E3 ubiquitin ligases in primary CD4 T cells during quiescence and activation may provide insights into further elucidation of their functions in periperhal T cell tolerance. We found that while GRAIL was present in naive quiescent CD4 T cells and down-regulated upon activation, by contrast, Cbl-b was expressed at low levels in naive quiescent CD4 T cells and up-regulated upon activation (data not shown). Another group has recently also reported on the observed Cbl-b up-regulation upon activation in primary CD4 T cells (56). Their findings suggest that Cbl-b acts to limit CD4 T cell proliferation following TCR and CD28 activation through Cbl-b ubiquitination and degradation of phospholipase Cγ (57) and PI3K (58, 59). Cbl-b decrease of PI3K expression diminishes downstream phosphorylation of ERK and Akt (56). We proposed that GRAIL and Cbl-b both serve to counteract CD4 T cell activation, however, at different stages. GRAIL, by maintaining quiescence in the absence of CD28 costimulation, and Cbl-b, by dampening proliferation of activated cells. GRAIL and Cbl-b may be mechanistically linked through Cbl-b down-regulation of Akt phosphorylation. A decrease in Akt phosphorylation would decrease mTOR activation, abrogating Otub1 protein expression and thus resulting in the re-expression of GRAIL and inhibition of cell proliferation. In this regard, we found that human and mouse naive CD4 T cells activated and subsequently rested eventually diminished their levels of phosphorylated Akt, S6K1, and 4E-BP1 (data not shown). The return of these cells to a nonproliferating quiescent state was correlated with the re-expression of GRAIL. Reactivation by TCR/CD3 and CD28 stimulation again led to Otub1 protein expression and down-regulation of GRAIL before cell proliferation (data not shown). An investigation into this proposed interrelationship between GRAIL and Cbl-b control of CD4 T cell proliferation would help characterize their overlapping and distinct roles.
NOD mice serve as a murine model of human type 1 diabetes with increasing incidence of hyperglycemia with age (60). The disease process is thought to occur initially through autoimmune T cell activation, possibly in the pancreatic lymph node, followed by inflammation of the islets of langerhans (insulitis) that, at ∼12 wk of age, leads to islet β-cell destruction and resultant hyperglycemia (61). In search of genes differentially expressed during disease initiation and progression, we examined pancreatic lymph nodes from NOD and disease-resistant NOD.B10 (H-2b) congenic mice. We conducted genome-wide analyses of gene expression using microarrays comparing NOD vs NOD.B10 pancreatic lymph node RNA (22). At certain ages, including 12 wk, GRAIL expression was decreased in pancreatic lymph nodes of NOD mice compared with NOD.B10 mice (supplemental Fig. 7A).4 This differential GRAIL expression was verified by quantitative PCR of pancreatic lymph node RNA samples from multiple 12-wk-old NOD and NOD.B10 mice (supplemental Fig. 7B).4 Our findings suggest a potential peripheral tolerance role for GRAIL on naive CD4 T cells in vivo, which might be lost during NOD disease pathogenesis. In a study of primate HIV infection, GRAIL was up-regulated in anergic CD4 T cells isolated from disease-susceptible SIV-infected rhesus macaques, whereas SIV-resistant sooty mangabey primates showed no increase in GRAIL (62). A role for GRAIL in human disease was recently demonstrated in patients successfully treated for ulcerative colitis: patients in remission expressed higher levels of GRAIL in CD4 T cells vs patients with ongoing disease or normal controls (63) These studies and the findings reported above suggest that regulation of GRAIL and Otub1 may play an important role in peripheral tolerance.
Acknowledgments
We are grateful to Cariel Taylor for animal husbandry and laboratory management. Carol Figueroa provided administrative assistance.
Footnotes
This work was supported by grants from the National Institutes of Health Grants CA065237 (to C.G.F.) and AI07290 (to J.T.L.).
Abbreviations used in this paper: GRAIL, gene related to anergy in lymphocyte; mTOR, mammalian target of rapamycin; Otub1, Otubain-1; pOVA, peptide OVA323–339.
The online version of this article contains supplemental material.
Disclosures: The authors have no financial conflict of interest.
References
- 1.Hogquist KA, Baldwin TA, Jameson SC. Central tolerance: learning self-control in the thymus. Nat Rev. 2005;5:772–782. doi: 10.1038/nri1707. [DOI] [PubMed] [Google Scholar]
- 2.Walker LS, Abbas AK. The enemy within: keeping self-reactive T cells at bay in the periphery. Nat Rev. 2002;2:11–19. doi: 10.1038/nri701. [DOI] [PubMed] [Google Scholar]
- 3.Powell JD. The induction and maintenance of T cell anergy. Clin Immunol. 2006;120:239–246. doi: 10.1016/j.clim.2006.02.004. [DOI] [PubMed] [Google Scholar]
- 4.Schwartz RH. T cell anergy. Annu Rev Immunol. 2003;21:305–334. doi: 10.1146/annurev.immunol.21.120601.141110. [DOI] [PubMed] [Google Scholar]
- 5.Abbas AK. The control of T cell activation vs tolerance. Autoimmun Rev. 2003;2:115–118. doi: 10.1016/s1568-9972(03)00028-4. [DOI] [PubMed] [Google Scholar]
- 6.Pickart CM. Mechanisms underlying ubiquitination. Annu Rev Biochem. 2001;70:503–533. doi: 10.1146/annurev.biochem.70.1.503. [DOI] [PubMed] [Google Scholar]
- 7.Fathman CG, Lineberry NB. Molecular mechanisms of CD4+ T cell anergy. Nat Rev. 2007;7:599–609. doi: 10.1038/nri2131. [DOI] [PubMed] [Google Scholar]
- 8.Mueller DL. E3 ubiquitin ligases as T cell anergy factors. Nat Immunol. 2004;5:883–890. doi: 10.1038/ni1106. [DOI] [PubMed] [Google Scholar]
- 9.Schartner JM, Fathman CG, Seroogy CM. Preservation of self: an overview of E3 ubiquitin ligases and T cell tolerance. Semin Immunol. 2007;19:188–196. doi: 10.1016/j.smim.2007.02.010. [DOI] [PubMed] [Google Scholar]
- 10.Lin AE, Mak TW. The role of E3 ligases in autoimmunity and the regulation of autoreactive T cells. Curr Opin Immunol. 2007;19:665–673. doi: 10.1016/j.coi.2007.10.002. [DOI] [PubMed] [Google Scholar]
- 11.Fang D, Elly C, Gao B, Fang N, Altman Y, Joazeiro C, Hunter T, Copeland N, Jenkins N, Liu YC. Dysregulation of T lymphocyte function in itchy mice: a role for Itch in TH2 differentiation. Nat Immunol. 2002;3:281–287. doi: 10.1038/ni763. [DOI] [PubMed] [Google Scholar]
- 12.Bachmaier K, Krawczyk C, Kozieradzki I, Kong YY, Sasaki T, Oliveira-dos-Santos A, Mariathasan S, Bouchard D, Wakeham A, Itie A, et al. Negative regulation of lymphocyte activation and autoimmunity by the molecular adaptor Cbl-b. Nature. 2000;403:211–216. doi: 10.1038/35003228. [DOI] [PubMed] [Google Scholar]
- 13.Zhang J, Bardos T, Li D, Gal I, Vermes C, Xu J, Mikecz K, Finnegan A, Lipkowitz S, Glant TT. Cutting edge: regulation of T cell activation threshold by CD28 costimulation through targeting Cbl-b for ubiquitination. J Immunol. 2002;169:2236–2240. doi: 10.4049/jimmunol.169.5.2236. [DOI] [PubMed] [Google Scholar]
- 14.Anandasabapathy N, Ford GS, Bloom D, Holness C, Paragas V, Seroogy C, Skrenta H, Hollenhorst M, Fathman CG, Soares L. GRAIL: an E3 ubiquitin ligase that inhibits cytokine gene transcription is expressed in anergic CD4+ T cells. Immunity. 2003;18:535–547. doi: 10.1016/s1074-7613(03)00084-0. [DOI] [PubMed] [Google Scholar]
- 15.Seroogy CM, Soares L, Ranheim EA, Su L, Holness C, Bloom D, Fathman CG. The gene related to anergy in lymphocytes, an E3 ubiquitin ligase, is necessary for anergy induction in CD4 T cells. J Immunol. 2004;173:79–85. doi: 10.4049/jimmunol.173.1.79. [DOI] [PubMed] [Google Scholar]
- 16.Su L, Lineberry N, Huh Y, Soares L, Fathman CG. A novel E3 ubiquitin ligase substrate screen identifies Rho guanine dissociation inhibitor as a substrate of gene related to anergy in lymphocytes. J Immunol. 2006;177:7559–7566. doi: 10.4049/jimmunol.177.11.7559. [DOI] [PubMed] [Google Scholar]
- 17.Lineberry NB, Su LL, Lin JT, Coffey GP, Seroogy CM, Fathman CG. Cutting edge: the transmembrane E3 ligase GRAIL ubiquitinates the costimulatory molecule CD40 ligand during the induction of T cell anergy. J Immunol. 2008;181:1622–1626. doi: 10.4049/jimmunol.181.3.1622. [DOI] [PMC free article] [PubMed] [Google Scholar]
- 18.Lineberry N, Su L, Soares L, Fathman CG. The single-subunit transmembrane E3 ligase GRAIL captures and then ubiquitinates transmembrane proteins across the cell membrane. J Biol Chem. 2008;283:28497–28505. doi: 10.1074/jbc.M805092200. [DOI] [PMC free article] [PubMed] [Google Scholar]
- 19.Balakirev MY, Tcherniuk SO, Jaquinod M, Chroboczek J. Otubains: a new family of cysteine proteases in the ubiquitin pathway. EMBO Rep. 2003;4:517–522. doi: 10.1038/sj.embor.embor824. [DOI] [PMC free article] [PubMed] [Google Scholar]
- 20.Sun SC. Deubiquitylation and regulation of the immune response. Nat Rev. 2008;8:501–511. doi: 10.1038/nri2337. [DOI] [PMC free article] [PubMed] [Google Scholar]
- 21.Soares L, Seroogy C, Skrenta H, Anandasabapathy N, Lovelace P, Chung CD, Engleman E, Fathman CG. Two isoforms of otubain 1 regulate T cell anergy via GRAIL. Nat Immunol. 2004;5:45–54. doi: 10.1038/ni1017. [DOI] [PubMed] [Google Scholar]
- 22.Kodama K, Butte AJ, Creusot RJ, Su L, Sheng D, Hartnett M, Iwai H, Soares LR, Fathman CG. Tissue- and age-specific changes in gene expression during disease induction and progression in NOD mice. Clin Immunol. 2008;129:195–201. doi: 10.1016/j.clim.2008.07.028. [DOI] [PMC free article] [PubMed] [Google Scholar]
- 23.Pavlidis P, Noble WS. Matrix2png: a utility for visualizing matrix data. Bioinformatics. 2003;19:295–296. doi: 10.1093/bioinformatics/19.2.295. [DOI] [PubMed] [Google Scholar]
- 24.Lin JT, Martin SL, Xia L, Gorham JD. TGF-β1 uses distinct mechanisms to inhibit IFN-γ expression in CD4+ T cells at priming and at recall: differential involvement of Stat4 and T-bet. J Immunol. 2005;174:5950–5958. doi: 10.4049/jimmunol.174.10.5950. [DOI] [PubMed] [Google Scholar]
- 25.Vernachio J, Li M, Donnenberg AD, Soloski MJ. Qa-2 expression in the adult murine thymus: a unique marker for a mature thymic subset. J Immunol. 1989;142:48–56. [PubMed] [Google Scholar]
- 26.Gimmi CD, Freeman GJ, Gribben JG, Gray G, Nadler LM. Human T cell clonal anergy is induced by antigen presentation in the absence of B7 costimulation. Proc Natl Acad Sci USA. 1993;90:6586–6590. doi: 10.1073/pnas.90.14.6586. [DOI] [PMC free article] [PubMed] [Google Scholar]
- 27.Jenkins MK, Chen CA, Jung G, Mueller DL, Schwartz RH. Inhibition of antigen-specific proliferation of type 1 murine T cell clones after stimulation with immobilized anti-CD3 monoclonal antibody. J Immunol. 1990;144:16–22. [PubMed] [Google Scholar]
- 28.Bonnevier JL, Yarke CA, Mueller DL. Sustained B7/CD28 interactions and resultant phosphatidylinositol 3-kinase activity maintain G1→S phase transitions at an optimal rate. Eur J Immunol. 2006;36:1583–1597. doi: 10.1002/eji.200535626. [DOI] [PubMed] [Google Scholar]
- 29.Lucas PJ, Negishi I, Nakayama K, Fields LE, Loh DY. Naive CD28-deficient T cells can initiate but not sustain an in vitro antigen-specific immune response. J Immunol. 1995;154:5757–5768. [PubMed] [Google Scholar]
- 30.Powell JD, Ragheb JA, Kitagawa-Sakakida S, Schwartz RH. Molecular regulation of interleukin-2 expression by CD28 costimulation and anergy. Immunol Rev. 1998;165:287–300. doi: 10.1111/j.1600-065x.1998.tb01246.x. [DOI] [PubMed] [Google Scholar]
- 31.Ahmed NN, Grimes HL, Bellacosa A, Chan TO, Tsichlis PN. Transduction of interleukin-2 antiapoptotic and proliferative signals via Akt protein kinase. Proc Natl Acad Sci USA. 1997;94:3627–3632. doi: 10.1073/pnas.94.8.3627. [DOI] [PMC free article] [PubMed] [Google Scholar]
- 32.Lin JX, Leonard WJ. The role of Stat5a and Stat5b in signaling by IL-2 family cytokines. Oncogene. 2000;19:2566–2576. doi: 10.1038/sj.onc.1203523. [DOI] [PubMed] [Google Scholar]
- 33.Schwartz RH. Costimulation of T lymphocytes: the role of CD28, CTLA-4, and B7/BB1 in interleukin-2 production and immunotherapy. Cell. 1992;71:1065–1068. doi: 10.1016/s0092-8674(05)80055-8. [DOI] [PubMed] [Google Scholar]
- 34.Proud CG. Signalling to translation: how signal transduction pathways control the protein synthetic machinery. Biochem J. 2007;403:217–234. doi: 10.1042/BJ20070024. [DOI] [PubMed] [Google Scholar]
- 35.Jones RG, Thompson CB. Revving the engine: signal transduction fuels T cell activation. Immunity. 2007;27:173–178. doi: 10.1016/j.immuni.2007.07.008. [DOI] [PubMed] [Google Scholar]
- 36.Mondino A, Mueller DL. mTOR at the crossroads of T cell proliferation and tolerance. Semin Immunol. 2007;19:162–172. doi: 10.1016/j.smim.2007.02.008. [DOI] [PMC free article] [PubMed] [Google Scholar]
- 37.Colombetti S, Benigni F, Basso V, Mondino A. Clonal anergy is maintained independently of T cell proliferation. J Immunol. 2002;169:6178–6186. doi: 10.4049/jimmunol.169.11.6178. [DOI] [PubMed] [Google Scholar]
- 38.Powell JD, Lerner CG, Schwartz RH. Inhibition of cell cycle progression by rapamycin induces T cell clonal anergy even in the presence of costimulation. J Immunol. 1999;162:2775–2784. [PubMed] [Google Scholar]
- 39.Zheng Y, Collins SL, Lutz MA, Allen AN, Kole TP, Zarek PE, Powell JD. A role for mammalian target of rapamycin in regulating T cell activation versus anergy. J Immunol. 2007;178:2163–2170. doi: 10.4049/jimmunol.178.4.2163. [DOI] [PubMed] [Google Scholar]
- 40.Colombetti S, Basso V, Mueller DL, Mondino A. Prolonged TCR/CD28 engagement drives IL-2-independent T cell clonal expansion through signaling mediated by the mammalian target of rapamycin. J Immunol. 2006;176:2730–2738. doi: 10.4049/jimmunol.176.5.2730. [DOI] [PubMed] [Google Scholar]
- 41.Sinclair LV, Finlay D, Feijoo C, Cornish GH, Gray A, Ager A, Okkenhaug K, Hagenbeek TJ, Spits H, Cantrell DA. Phosphatidylinositol-3-OH kinase and nutrient-sensing mTOR pathways control T lymphocyte trafficking. Nat Immunol. 2008;9:513–521. doi: 10.1038/ni.1603. [DOI] [PMC free article] [PubMed] [Google Scholar]
- 42.Sicinska E, Aifantis I, Le Cam L, Swat W, Borowski C, Yu Q, Ferrando AA, Levin SD, Geng Y, von Boehmer H, Sicinski P. Requirement for cyclin D3 in lymphocyte development and T cell leukemias. Cancer Cell. 2003;4:451–461. doi: 10.1016/s1535-6108(03)00301-5. [DOI] [PubMed] [Google Scholar]
- 43.Mohapatra S, Agrawal D, Pledger WJ. p27Kip1 regulates T cell proliferation. J Biol Chem. 2001;276:21976–21983. doi: 10.1074/jbc.M009788200. [DOI] [PubMed] [Google Scholar]
- 44.Kostianovsky AM, Maier LM, Baecher-Allan C, Anderson AC, Anderson DE. Up-regulation of gene related to anergy in lymphocytes is associated with Notch-mediated human T cell suppression. J Immunol. 2007;178:6158–6163. doi: 10.4049/jimmunol.178.10.6158. [DOI] [PubMed] [Google Scholar]
- 45.Brennan P, Babbage JW, Thomas G, Cantrell D. p70s6k integrates phosphatidylinositol 3-kinase and rapamycin-regulated signals for E2F regulation in T lymphocytes. Mol Cell Biol. 1999;19:4729–4738. doi: 10.1128/mcb.19.7.4729. [DOI] [PMC free article] [PubMed] [Google Scholar]
- 46.Mader S, Lee H, Pause A, Sonenberg N. The translation initiation factor eIF-4E binds to a common motif shared by the translation factor eIF-4γ and the translational repressors 4E-binding proteins. Mol Cell Biol. 1995;15:4990–4997. doi: 10.1128/mcb.15.9.4990. [DOI] [PMC free article] [PubMed] [Google Scholar]
- 47.De Benedetti A, Graff JR. eIF-4E expression and its role in malignancies and metastases. Oncogene. 2004;23:3189–3199. doi: 10.1038/sj.onc.1207545. [DOI] [PubMed] [Google Scholar]
- 48.Graff JR, Zimmer SG. Translational control and metastatic progression: enhanced activity of the mRNA cap-binding protein eIF-4E selectively enhances translation of metastasis-related mRNAs. Clin Exp Metastasis. 2003;20:265–273. doi: 10.1023/a:1022943419011. [DOI] [PubMed] [Google Scholar]
- 49.Ramsdell F, Jenkins M, Dinh Q, Fowlkes BJ. The majority of CD4+8− thymocytes are functionally immature. J Immunol. 1991;147:1779–1785. [PubMed] [Google Scholar]
- 50.Bhandoola A, Tai X, Eckhaus M, Auchincloss H, Mason K, Rubin SA, Carbone KM, Grossman Z, Rosenberg AS, Singer A. Peripheral expression of self-MHC-II influences the reactivity and self-tolerance of mature CD4+ T cells: evidence from a lymphopenic T cell model. Immunity. 2002;17:425–436. doi: 10.1016/s1074-7613(02)00417-x. [DOI] [PubMed] [Google Scholar]
- 51.Brocker T. Survival of mature CD4 T lymphocytes is dependent on major histocompatibility complex class II-expressing dendritic cells. J Exp Med. 1997;186:1223–1232. doi: 10.1084/jem.186.8.1223. [DOI] [PMC free article] [PubMed] [Google Scholar]
- 52.Ge Q, Bai A, Shen CH, Eisen HN, Chen J. CD4+ T cell responses to self-peptide–MHC. Trends Immunol. 2003;24:186–189. doi: 10.1016/s1471-4906(03)00060-7. [DOI] [PubMed] [Google Scholar]
- 53.Goldrath AW, Bevan MJ. Selecting and maintaining a diverse T cell repertoire. Nature. 1999;402:255–262. doi: 10.1038/46218. [DOI] [PubMed] [Google Scholar]
- 54.Stefanova I, Dorfman JR, Germain RN. Self-recognition promotes the foreign antigen sensitivity of naive T lymphocytes. Nature. 2002;420:429–434. doi: 10.1038/nature01146. [DOI] [PubMed] [Google Scholar]
- 55.Viret C, Wong FS, Janeway CA., Jr Designing and maintaining the mature TCR repertoire: the continuum of self-peptide:self-MHC complex recognition. Immunity. 1999;10:559–568. doi: 10.1016/s1074-7613(00)80055-2. [DOI] [PubMed] [Google Scholar]
- 56.Zhang R, Zhang N, Mueller DL. Casitas B-lineage lymphoma b inhibits antigen recognition and slows cell cycle progression at late times during CD4+ T cell clonal expansion. J Immunol. 2008;181:5331–5339. doi: 10.4049/jimmunol.181.8.5331. [DOI] [PMC free article] [PubMed] [Google Scholar]
- 57.Jeon MS, Atfield A, Venuprasad K, Krawczyk C, Sarao R, Elly C, Yang C, Arya S, Bachmaier K, Su L, et al. Essential role of the E3 ubiquitin ligase Cbl-b in T cell anergy induction. Immunity. 2004;21:167–177. doi: 10.1016/j.immuni.2004.07.013. [DOI] [PubMed] [Google Scholar]
- 58.Fang D, Liu YC. Proteolysis-independent regulation of PI3K by Cbl-b-mediated ubiquitination in T cells. Nat Immunol. 2001;2:870–875. doi: 10.1038/ni0901-870. [DOI] [PubMed] [Google Scholar]
- 59.Fang D, Wang HY, Fang N, Altman Y, Elly C, Liu YC. Cbl-b, a RING-type E3 ubiquitin ligase, targets phosphatidylinositol 3-kinase for ubiquitination in T cells. J Biol Chem. 2001;276:4872–4878. doi: 10.1074/jbc.M008901200. [DOI] [PubMed] [Google Scholar]
- 60.Creusot RJ, Yaghoubi SS, Kodama K, Dang DN, Dang VH, Breckpot K, Thielemans K, Gambhir SS, Fathman CG. Tissue-targeted therapy of autoimmune diabetes using dendritic cells transduced to express IL-4 in NOD mice. Clin Immunol. 2008;127:176–187. doi: 10.1016/j.clim.2007.12.009. [DOI] [PMC free article] [PubMed] [Google Scholar]
- 61.Mathis D, Vence L, Benoist C. β-Cell death during progression to diabetes. Nature. 2001;414:792–798. doi: 10.1038/414792a. [DOI] [PubMed] [Google Scholar]
- 62.Bostik P, Noble ES, Mayne AE, Gargano L, Villinger F, Ansari AA. Central memory CD4 T cells are the predominant cell subset resistant to anergy in SIV disease resistant sooty mangabeys. AIDS. 2006;20:181–188. doi: 10.1097/01.aids.0000198092.77948.8a. [DOI] [PubMed] [Google Scholar]
- 63.Egawa S, Iijima H, Shinzaki S, Nakajima S, Wang J, Kondo J, Ishii S, Yoshio T, Irie T, Nishida T, et al. Up-regulation of GRAIL is associated with remission of ulcerative colitis. Gastrointest Liver Phsiol. 2008;295:G163–G169. doi: 10.1152/ajpgi.90242.2008. [DOI] [PubMed] [Google Scholar]