Abstract
We have developed a dense reference genetic map of Lupinus angustifolius (2n = 40) based on a set of 106 publicly available recombinant inbred lines derived from a cross between domesticated and wild parental lines. The map comprised 1090 loci in 20 linkage groups and three small clusters, drawing together data from several previous mapping publications plus almost 200 new markers, of which 63 were gene-based markers. A total of 171 mainly gene-based, sequence-tagged site loci served as bridging points for comparing the Lu. angustifolius genome with the genome sequence of the model legume, Lotus japonicus via BLASTn homology searching. Comparative analysis indicated that the genomes of Lu. angustifolius and Lo. japonicus are highly diverged structurally but with significant regions of conserved synteny including the region of the Lu. angustifolius genome containing the pod-shatter resistance gene, lentus. We discuss the potential of synteny analysis for identifying candidate genes for domestication traits in Lu. angustifolius and in improving our understanding of Fabaceae genome evolution.
Keywords: synteny, genome evolution, narrow-leafed lupin, Fabaceae
1. Introduction
Comparative genetics and genomics use knowledge from different species to define important evolutionary relationships, an important aspect of which is the physical and genetic synteny (two or more homologous loci found on a single chromosome) and collinearity (conserved linear order of loci) between any two species that can be used to explain chromosomal rearrangements. Synteny and collinearity have been widely studied in legumes (Fabaceae family), and these studies have shown direct correspondences between evolutionary distance and the degree of synteny and collinearity. These include whole chromosome levels of synteny between members of the closely related Viceae1,2 with successively more fractionated and rearranged chromosomal relationships moving out to the Loteae,3 Cicereae and Phaseoleae.4
The Lupinus genus—part of the Genistoid clade of the Papilionoid legumes—includes a number of agricultural crop species, including Lupinus angustifolius L. (narrow-leafed lupin). The Genistoid clade is thought to be one of the first clades to diverge from the rest of the Papilionoid legumes about 56.4 million years ago and is quite distinct from the other clades containing crop or pasture species.5 The Lupinus genus therefore represents a useful out-group for understanding genome evolution within the legume family.
Lupinus angustifolius is diploid (2n = 40 chromosomes) with a nuclear genome size of 2C = 1.89 pg.6 Cytogenetic and linkage analyses found evidence of ancient polyploidy in Lu. angustifolius,6–8 but it is functionally diploid. Alignment of a low-density genetic map of Lu. angustifolius to an early draft genome sequence of the model legume species Medicago truncatula revealed short regions of conserved synteny between these highly divergent legume species.7
Genetic map resources for Lu. angustifolius are modest, comprising two incomplete maps,7,9 several gene-tagging reports10–14 and physical descriptions of the chromosomes by cytogenetic approaches.15,16 The purpose of this current study was to bring together marker data from previous mapping studies, add almost 200 new markers and develop a high-density consensus reference genetic map for Lu. angustifolius with all chromosomes richly populated with gene-based markers. We then used this map to compare the genome structure of Lu. angustifolius with the recently released genome sequence of the model legume, Lotus japonicus.17 By this approach, we hoped to gain further insight into the evolution of Papilionoid legumes by comparing the genomes of a Genistoid species and a Loteae species. We also sought to develop a resource for map alignment-based identification of candidate genes from Lo. japonicus for use in Lu. angustifolius genetic studies.
2. Materials and methods
2.1. Characteristics of the Lu. angustifolius mapping population
The Lu. angustifolius recombinant inbred line (RIL) mapping population used in this study was developed at the Department of Agriculture and Food Western Australia (Perth, Australia) and comprised 106 RILs derived from a cross between a domesticated line (breeding line 83A:476) and a wild landrace from Morocco (P27255).7 These two crossing parents differed in six major genes for key domestication traits used in all current Australian cultivars: Ku (early flowering); iucundis (low seed alkaloid); tardus and lentus (pod shatter resistance); mollis (water permeable seed) and leucospermus (pigmented flowers, seeds and cotyledons, used as a visible marker to indicate when undesirable cross-pollination to wild types has occurred). Two previous mapping studies used subsets of this population: 89 RILs were used by Boersma et al.9 and 93 RILs were used by Nelson et al.7 These studies shared 76 RILs in common, which allowed the straightforward combining of data sets from these previous studies.
2.2. Previously published markers
Genotyping data for 522 microsatellite-anchored fragment length polymorphism (MFLP) loci and five domestication genes (Ku, iucundis, lentus, mollis and leucospermus) were previously reported by Boersma et al.9 The anthracnose resistance gene and linked marker (Lanr1 and AntjM2, respectively) were reported by Yang et al.18 and You et al.14 Genotyping at 298 mainly gene-based sequence tagged site (STS) loci, 74 amplified fragment length fragment (AFLP) loci and five domestication genes (Ku, iucundis, lentus, mollis and leucospermus) was reported in Nelson et al.7 A sixth domestication gene (Tardus), along with three linked markers (TaM1, TaM2 and TaM3), was reported by Boersma et al.10 Four further markers tagging domestication traits (MoA, LeM1, LeM2 and KuHM1) were reported by Boersma et al.11–13 Six isozyme markers were used to screen the population using the methods of Wolko and Weeden.8,19
2.3. New PCR-based STS markers
Forty-two STS primer pairs were developed within the framework of the 6th EU FP Grain Legumes Integrated Project (GLIP) and were provided by the Laboratory of Plant Genetics and Breeding at the Agricultural Biotechnology Center, Godollo, Hungary. The primer pairs were designed on the basis of information on M. truncatula and Pisum sativum consensus sequences using an intron-targeted strategy to amplify single or low copy genes. The primer information is available on the following website: http://bioweb.abc.hu/cgi-mt/pisprim/pisprim.pl.
Nineteen previously unmapped Lupinus-derived STS primer pairs based on polymorphism screening conducted in previous comparative mapping studies were used to genotype the RIL population.1,2,7
Two cross-legume primer pairs (PPE and SGR) were provided by Prof. Norman Weeden (Department of Plant Sciences and Plant Pathology at Montana State University, Bozeman, MT, USA). The design strategy was similar to that used for the GLIP marker generation (N. Weeden, pers. comm.).
One BAC-end sequence tag (BEST) marker was developed from the clone 15L10 from the BAC library of Lu. angustifolius reported by Kasprzak et al.20 BAC DNA was isolated by QIAprep Spin Miniprep Kit (Qiagen, Doncaster, VIC, Australia) and the insert ends were sequenced by BigDye Terminator v3.1 Cycle Sequencing Kit (Applied Biosystems, Scoresby, VIC, Australia) using an AB PRISM 3130xl Genetic Analyzer. On the basis of the BAC-end sequence, primer pairs were designed with aid of Primer3 software (http://frodo.wi.mit.edu/primer3).
An improved dCAPS assay (d212Len) was developed to replace the CAPS marker 212Len reported by Nelson et al.7
STS primer pairs from the above sources were screened on Lu. angustifolius parental DNA. Primer pairs showing large length polymorphisms were used directly to genotype the RIL population. Amplicons of primer pairs showing no visible length polymorphisms were purified and directly sequenced. DNA polymorphisms were identified by manual inspection of alignments and chromatograms and suitable SNaPshot (AB), CAPS (cleaved amplified polymorphic sequence) or dCAPS (derived-CAPS) assays were developed to genotype the RIL population.
2.4. New MFLP markers
An additional 134 MFLP markers were developed using the approach described by Boersma et al.9 Briefly, DNA from each RIL was digested by the restriction enzyme Tru91 (Roche Diagnostics Australia Pty Ltd, Kew, Australia), an isoschizomer of MseI. An AFLP MseI-adaptor21 was ligated to the restriction fragments using T4 DNA-ligase (Roche). The DNA was then digested a second time with HpaII (Gene Works Pty Ltd, Australia) as described by Yang et al.22 Pre-selective amplification of fragments using the simple sequence repeat primers listed in Supplementary Table S1 in combination with an MseI primer with one selective nucleotide C was followed by a second round of amplification using 16 MseI primers having two additional selective nucleotides (Supplementary Table S1). The PCR products were resolved on 5% denaturing sequencing gels and polymorphisms visualized by autoradiography.22
2.5. Linkage map construction
Linkage mapping was conducted with the aid of MultiPoint 1.2 (MultiQTL Ltd, Haifa, Israel), a mapping software package that used the ‘evolutionary optimization strategy’23 to resolve locus order. Of the 1118 marker and trait loci inputted to MultiPoint 1.2, 16 marker loci showed severe segregation distortion (χ2 P < 0.001). These were excluded from further analyses due to their tendency to introduce false linkages into the analysis. Because a large number of loci were included in this analysis, moderately distorted loci (0.001 < P < 0.01) were retained but kept under observation in the event that they became implicated in false linkages at a later stage.
Initial clustering into linkage groups was performed at a maximum observable recombination frequency (rf) of 0.10. Multipoint marker ordering was performed separately for each linkage group, and the robustness of marker order was assessed using jack-knife re-sampling. Markers ordered with jack-knife values >90% were considered highly robust and designated as ‘framework’ markers. Markers ordered with jack-knife values <90% (including redundant markers that mapped to the same location) were initially excluded from the map construction due to their destabilizing effect on locus order. The same set of procedures was carried out serially at gradually increasing maximum recombination frequencies (rf = 0.15, 0.20, 0.25, 0.28, 0.30 and 0.31). At each new clustering cycle, manual inspection of proposed new clusters assisted the identification of valid and invalid clusters. A new cluster was considered valid if its two progenitor clusters were most closely related to each other via their terminal loci. A new cluster was considered invalid if its two progenitor clusters were most closely related by non-terminal loci. Such invalid clusters were associated with problematic loci that showed either high degree of missing data points and/or moderately severe segregation distortion (0.001 < P < 0.01) of alleles towards one of the two founding parents of the population. Only clusters judged valid were permitted during linkage mapping.
Once the framework map construction was completed, the interval sizes were transformed to account for multiple meioses involved in the development of the RIL population and were expressed in Kosambi centiMorgans (cM). Markers that had earlier been removed from the map due to their destabilizing effect on locus order (i.e. those with jack-knife values <90%) were assigned to the most likely intervals on the framework map and were referred to as ‘attached’ markers.
2.6. Comparison of Lu. angustifolius and Lo. japonicus genomes
The Lo. japonicus genome sequence version 4 was used to generate pseudomolecules representing the six chromosomes of Lo. japonicus. The pseudomolecules were assembled based on the Kazusa clone lists (http://www.kazusa.or.jp/lotus/clonelist.html) using custom Perl scripts (http://www.perl.org/). Comparison of the genetic map of Lu. angustifolius and the genome sequence of Lo. japonicus was achieved via blastall BLASTn homology search24,25 (at expected alignment values of 1e−20) and visualized using CMAP hosted at LegumeDB26 and GridMap 3.0 as described by Nelson and Lydiate.27
3. Results and discussion
3.1. A new reference map for Lu. angustifolius
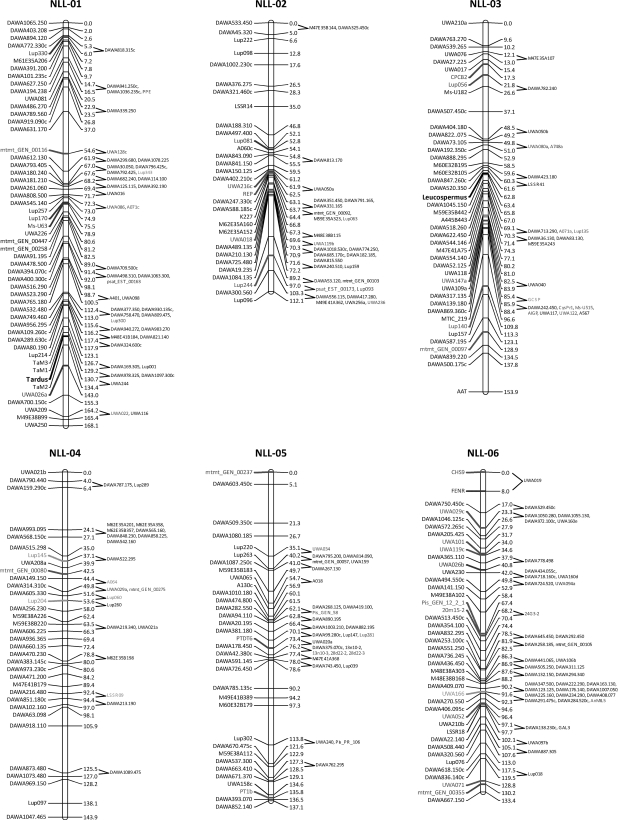
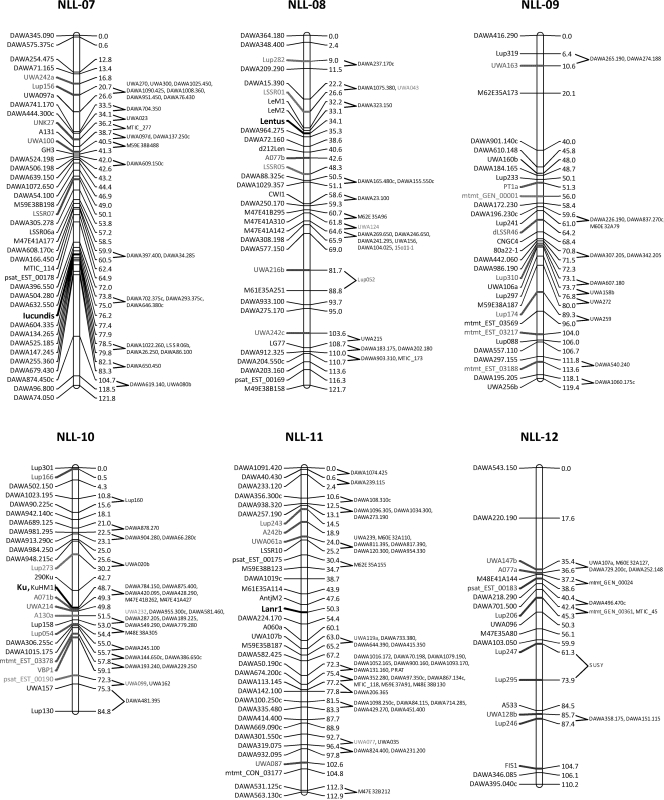
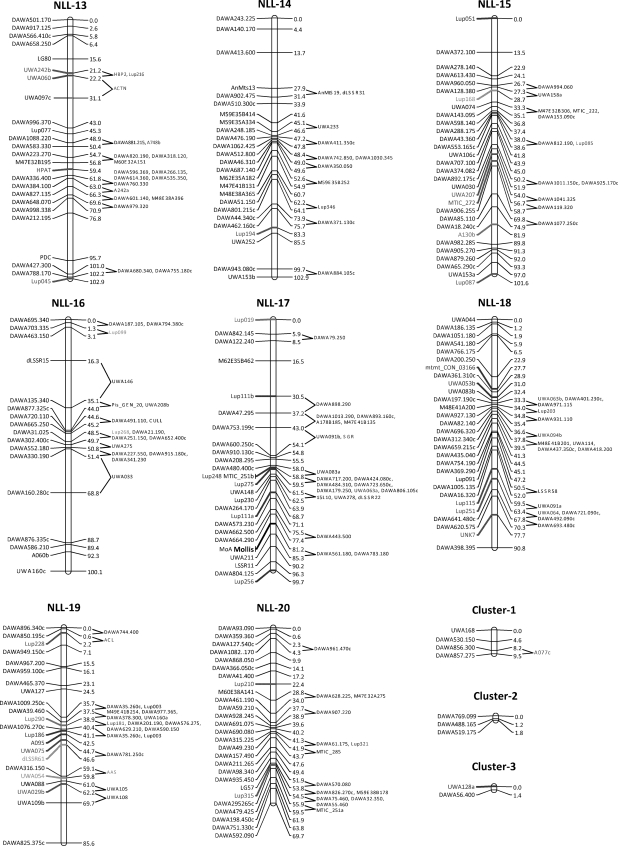
The new genetic map of Lu. angustifolius comprised 1090 loci arranged in 20 linkage groups and 3 small clusters (Fig. 1; larger scale diagrams are provided in Supplementary Fig. S1). The genotype data and map positions are provided in Supplementary Table S2. The total length of the map was 2361.8 cM, with linkage groups ranging from 69.7 to 168.1 cM. Table 1 gives summary details of each linkage group, including their size, the number of framework and total markers, and the equivalent linkage groups from the two previous maps of Lu. angustifolius reported by Boersma et al.9 and Nelson et al.7 These two previous studies lacked both the critical marker density and sophisticated mapping methodology of the current mapping study, which led to significant differences between the maps. Boersma et al.9 reported 21 linkage groups; comparison with the new map revealed that two pairs of the Boersma et al.9 linkage groups (LG13 and LG21, and LG17 and LG20) coalesced into two linkage groups in this new map (NLL-08 and NLL-10, respectively) (Table 1). One linkage group (NLL-12) in the new map was entirely absent from the Boersma et al.9 map. The Nelson et al.7 map had 20 linkage groups (the same number as the current map); comparison with the new map revealed that five linkage groups of Nelson et al.7 (LG07, LG19, LG05, LG14 and LG20) were illegitimately joined and were divided among 10 of the new linkage groups (Table 1).
Figure 1.
Linkage map of the Lu. angustifolius genome comprising 1090 loci distributed among 20 linkage groups (NLL-01 to NLL-20) and three small clusters (Cluster-1 to Cluster-3). Loci on the left of each linkage group are ‘framework’ markers used to construct the linkage group. Loci on the right of each linkage group are ‘attached’ markers whose approximate location between flanking markers is shown. Locus positions are in Kosambi centiMorgans. Major gene trait loci are shown in bold text.
Table 1.
Summary of linkage groups and small clusters for Lu. angustifolius (narrow-leafed lupin) in this study (NLL-01 to NLL-20 and Cluster-1 to Cluster-3, respectively) and the equivalent linkage groups (LG) in two previous maps
| Linkage group | Length (cM)1 | Framework loci | Total locia | Linkage group in Boersma et al.9 | Linkage group in Nelson et al.7 |
|---|---|---|---|---|---|
| NLL-01 | 168.1 | 52 | 94 | LG1 | LG07 (top) and LG18 |
| NLL-02 | 155.6 | 32 | 60 | LG6 | LG19 (top) and LG15 |
| NLL-03 | 153.9 | 43 | 65 | LG11 | LG02 |
| NLL-04 | 143.9 | 34 | 56 | LG5 | LG10 |
| NLL-05 | 137.1 | 34 | 62 | LG4 | LG13 |
| NLL-06 | 133.4 | 42 | 82 | LG3 | LG16 and LG14 (top) |
| NLL-07 | 121.8 | 40 | 66 | LG9 | LG04 |
| NLL-08 | 121.7 | 34 | 55 | LG13 and LG21 | LG05 (top) |
| NLL-09 | 119.4 | 32 | 45 | LG18 | LG11 |
| NLL-10 | 117.8 | 27 | 54 | LG17 and LG20 | LG01, LG19 (bottom) and Triplet-1 |
| NLL-11 | 112.9 | 36 | 78 | LG2 | LG06 and LG20(bottom) |
| NLL-12 | 110.2 | 20 | 31 | Unlinked clusters | LG09 |
| NLL-13 | 102.9 | 25 | 44 | LG16 | LG07(bottom) and Pair-3 |
| NLL-14 | 102.9 | 25 | 36 | LG15 | LG14 (bottom) |
| NLL-15 | 101.6 | 30 | 42 | LG12 | LG17 and Triplet-2 |
| NLL-16 | 100.1 | 17 | 34 | LG19 | LG05 (bottom) and Pair-2 |
| NLL-17 | 99.7 | 27 | 49 | LG8 | LG03 |
| NLL-18 | 90.8 | 29 | 45 | LG14 | LG12 |
| NLL-19 | 85.6 | 22 | 40 | LG7 | LG08 |
| NLL-20 | 69.7 | 27 | 41 | LG10 | LG20 (top) |
| Cluster-1 | 9.5 | 4 | 5 | Unlinked cluster | Pair-1 |
| Cluster-2 | 1.8 | 3 | 3 | Unlinked cluster | — |
| Cluster-3 | 1.4 | 2 | 2 | Unlinked | Unlinked |
| Unlinked | — | — | 12 | ||
| Total | 2361.8 | 637 | 1101 |
aFramework markers were used to form the linkage groups. Total loci includes both framework and attached loci (see text for details).
This newly constructed genetic map of Lu. angustifolius involved a significantly greater number of markers and a more sophisticated mapping approach (the evolutionary optimization strategy) compared with the two previous maps. Jack-knife re-sampling was highly effective in identifying framework markers that were used to construct stable linkage groups onto which lower quality (and redundant) markers were later attached. This approach is particularly helpful in studies where marker data have been pooled from several sources since the quality of marker genotyping is likely to vary due to differing genotyping technologies and/or technical expertise. These factors led to a greatly improved map with the number of linkage groups equalling the haploid number for this species (n = 20).
This map cannot yet be considered saturated with markers since 18 intervals exceed 15 cM and 1 interval exceeds 20 cM (Fig. 1, Supplementary Fig. S1). However, the marker density is ample for most mapping purposes. Eighteen markers showing significant (P < 0.01) segregation distortion were distributed across nine linkage groups, with the majority (14) being dominant MFLP markers. Therefore, these distorted loci are more likely to have arisen from marker genotyping errors than being an indication of imbalance in the RIL mapping population. The population of RILs used to construct this map is available to the research community on request. With these resources, this map can be considered the new reference genetic map for Lu. angustifolius.
3.2. Comparing the genomes of Lu. angustifolius and Lo. japonicus
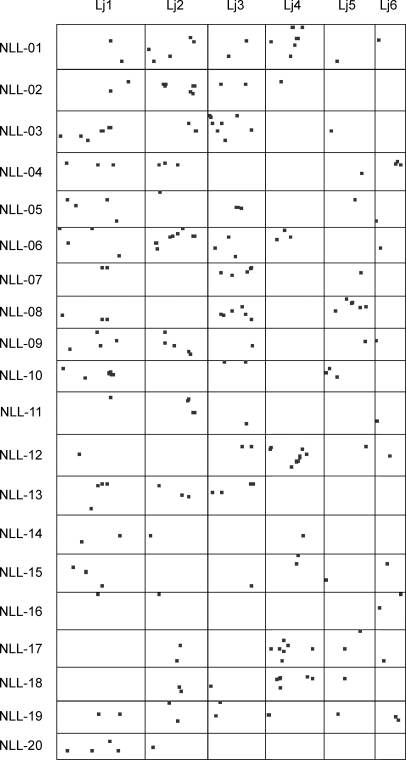
The new genetic map of Lu. angustifolius was compared with the recently released genome sequence of the model legume Lo. japonicus.17 This was achieved by comparing the DNA sequences of 311 STS markers (representing 363 mapped loci in Lu. angustifolius) to the genome sequence of Lo. japonicus using BLASTn homology searching. At the significance threshold of P < 1e−20, 159 markers (detecting 187 Lu. angustifolius loci) matched one or more locations in the Lo. japonicus genome. Seven markers (UWA023, UWA097, UWA158, UWA160, UWA270, UWA300 and LSSR18) representing 16 mapped loci in Lu. angustifolius detected repetitive sequences in the Lo. japonicus genome and were removed from further analysis. The remaining 152 markers (representing 171 mapped loci in Lu. angustifolius) detected one or more correspondences in the Lo. japonicus genome. In total, there were 242 correspondences between the two genomes, and these are plotted graphically in Fig. 2 and summarized in Table 2.
Figure 2.
Global distribution of synteny between 20 linkage groups of Lu. angustifolius (NLL-01 to NLL-20) and 6 chromosomes of Lo. japonicus (Lj1–Lj6). Loci showing homology between the two genomes at P < 1e−20 significance threshold are indicated by dots.
Table 2.
Numbers of Lu. angustifolius loci with BLASTn (P < 1e−20) correspondences in six Lo. japonicus chromosomes (Lj1–Lj6)
| Lotus japonicus chromosomes | Primary correspondences | All correspondencesa |
|---|---|---|
| Lj1 | 40 | 60 |
| Lj2 | 36 | 52 |
| Lj3 | 31 | 47 |
| Lj4 | 36 | 44 |
| Lj5 | 15 | 22 |
| Lj6 | 13 | 17 |
| Total | 171 | 242 |
aPrimary, secondary and tertiary BLASTn correspondences.
Of the 120 pairwise chromosome comparisons (i.e. 20 Lu. angustifolius × 6 Lo. japonicus chromosomes), 50 had at least two correspondences (the minimum for detecting synteny) and 34 had at least three correspondences (the minimum for detecting collinearity). There were clear differences in the degree of conserved collinearity on Lu. angustifolius and Lo. japonicus chromosomes with some regions showing good conservation whereas other regions were highly rearranged with respect to each other (Fig. 2). This heterogeneous pattern of genome collinearity was also observed in an earlier genome comparison between Lu. angustifolius (a Genistoid species) and M. truncatula (a Galegoid species),7 and provides additional support to the wide evolutionary distance believed to separate the Galegoids and Genistoids.5 A similarly heterogeneous pattern was observed between Arachis hypogea (groundnut, in the Dalbergioid clade, which is also considered relatively basal in the evolution of Papilionoid legumes) and the Galegoid species Lo. japonicus and M. truncatula.28 It is interesting to note that arguably the best conserved section between the Arachis and Lo. japonicus genomes on chromosomes Ar6 and Lj1 (synteny block 5, delineated by contigs CM0222–CM0105), respectively, appears to shows no conservation in the Lu. angustifolius genome. A more thorough analysis will be required to make firm conclusions, but on first inspection it would appear that regions of conserved gene order may not be generalized across wide evolutionary distance within the Papilionoid legumes. This is in contrast to the crucifer family where large variations in chromosome numbers and frequent rearrangements exist, but where the integrity of many chromosomal blocks has been maintained over a similarly long evolutionary timeframe.29
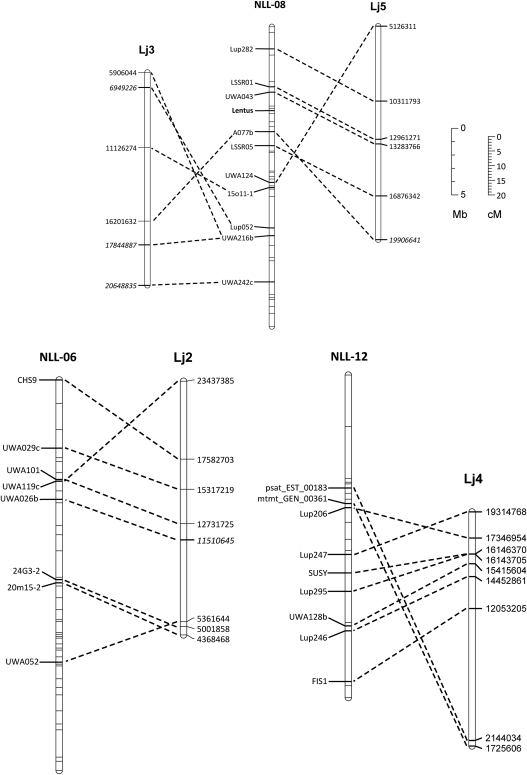
Three regions showing relatively good conservation of locus order between Lu. angustifolius and Lo. japonicus are shown in Fig. 3. Even these relatively well-conserved regions show evidence of chromosome translocations and/or inversions, which will make exploitation of synteny by lupin researchers more difficult. One of the potential applications of synteny is map alignment-based identification of candidate genes for important traits in the crop species by searching for likely candidates in the equivalent region of the model genome. For example, the pod shatter resistance gene lentus is located on Lu. angustifolius linkage group NLL-08 in a region with relatively well-conserved gene order with Lo. japonicus chromosome 5 (Fig. 3). Unfortunately, there appears to be an inversion in the interval containing lentus such that the equivalent region of Lo. japonicus is somewhat ambiguous and is only delimited to the lower half of chromosome 5. Clearly, more bridging points will be required to make such map-based inferences in Lu. angustifolius using Lo. japonicus as a model genome and therefore more gene-based markers are required in Lu. angustifolius.
Figure 3.
Three Lu. angustifolius linkage groups (NLL-08, NLL-06 and NLL-12) showing conserved gene order with Lo. japonicus chromosomes Lj2, Lj3, Lj4 and Lj5. The pod shatter resistance gene, Lentus, is located on NLL-08. Names of loci showing conserved synteny between the genomes are shown next to the Lu. angustifolius linkage groups (scaled in Kosambi centiMorgans, cM). The start position of homologous sequences on Lo. japonicus pseudomolecules is shown next to Lo. japonicus chromosomes (scaled in megabases, Mb).
In conclusion, we present a high-resolution reference map for Lu. angustifolius which will serve as a shared resource for the legume genetic community. We discovered that the Lu. angustifolius genome has numerous chromosomal rearrangements relative to the Lo. japonicus genome, though widespread but small sections of conserved gene order are present. As an outlying species compared with other legume model and crop species, Lu. angustifolius serves as a useful reference for gaining better understanding of legume genome evolution.
Supplementary data
Supplementary data are available at www.dnaresearch.oxfordjournals.org.
Funding
Generation of the GLIP STS markers was supported by the EU 6th Framework Programme Grain Legumes Integrated Project, no. FP-2002-FOOD-506223. Generation of isozyme and BEST markers was financed from the project of Polish Ministry of Sciences and Higher Education no. PBZ-MniSW-2/3/2006/3.
Supplementary Material
Acknowledgements
We thank Dr G.B. Kiss (Laboratory of Plant Genetics and Breeding, Agricultural Biotechnology Center, Godollo, Hungary) and Prof. N.F. Weeden (Department of Plant Sciences and Plant Pathology, Montana State University, Bozeman, USA) for providing primer pairs for STS markers.
Footnotes
Edited by Satoshi Tabata
References
- 1.Ellwood S., Phan H., Jordan M., et al. Construction of a comparative genetic map in faba bean (Vicia faba L.); conservation of genome structure with Lens culinaris. BMC Genomics. 2008;9:380. doi: 10.1186/1471-2164-9-380. [DOI] [PMC free article] [PubMed] [Google Scholar]
- 2.Phan H.T.T., Ellwood S.R., Hane J.K., Ford R., Materne M., Oliver R.P. Extensive macrosynteny between Medicago truncatula and Lens culinaris ssp. culinaris. Theor. Appl. Genet. 2007;114:549–58. doi: 10.1007/s00122-006-0455-3. [DOI] [PubMed] [Google Scholar]
- 3.Young N.D., Cannon S.B., Sato S., et al. Sequencing the genespaces of Medicago truncatula and Lotus japonicus. Plant Physiol. 2005;137:1174–81. doi: 10.1104/pp.104.057034. [DOI] [PMC free article] [PubMed] [Google Scholar]
- 4.Choi H.-K., Mun J.-H., Kim D.-J., et al. Estimating genome conservation between crop and model legume species. Proc. Natl Acad. Sci. USA. 2004;101:15289–94. doi: 10.1073/pnas.0402251101. [DOI] [PMC free article] [PubMed] [Google Scholar]
- 5.Lavin M., Herendeen P., Wojchiechowski M. Evolutionary rates analysis of Leguminosae implicates a rapid diversification of lineages during the Tertiary. Syst. Biol. 2005;54:575–94. doi: 10.1080/10635150590947131. [DOI] [PubMed] [Google Scholar]
- 6.Naganowska B., Wolko B., Sliwinska E., Kaczmarek Z. Nuclear DNA content variation and species relationships in the genus Lupinus (Fabaceae) Ann. Bot. 2003;92:349–55. doi: 10.1093/aob/mcg145. [DOI] [PMC free article] [PubMed] [Google Scholar]
- 7.Nelson M., Phan H., Ellwood S., et al. The first gene-based map of Lupinus angustifolius L.—location of domestication genes and conserved synteny with Medicago truncatula. Theor. Appl. Genet. 2006;113:225–38. doi: 10.1007/s00122-006-0288-0. [DOI] [PubMed] [Google Scholar]
- 8.Wolko B., Weeden N. Estimation of Lupinus genome polyploidy on the basis of isozymic loci number. Genet. Pol. 1989;30:165–71. [Google Scholar]
- 9.Boersma J.G., Pallotta M., Li C.D., Buirchell B.J., Sivasithamparam K., Yang H. Construction of a genetic linkage map using MFLP and identification of molecular markers linked to domestication genes in narrow-leafed lupin (Lupinus angustifolius L.) Cell. Mol. Biol. Lett. 2005;10:331–44. [PubMed] [Google Scholar]
- 10.Boersma J., Nelson M., Sivasithamparam K., Yang H. Development of sequence-specific PCR markers linked to the Tardus gene that reduces pod shattering in narrow-leafed lupin (Lupinus angustifolius L.) Mol. Breed. 2009;23:259–67. [Google Scholar]
- 11.Boersma J.G., Buirchell B.J., Sivasithamparam K., Yang H. Development of two sequence-specific PCR markers linked to the le gene that reduces pod shattering in narrow-leafed Lupin (Lupinus angustifolius L.) Genet. Mol. Biol. 2007;30:623–9. [Google Scholar]
- 12.Boersma J.G., Buirchell B.J., Sivasithamparam K., Yang H. Development of a sequence-specific PCR marker linked to the Ku gene which removes the vernalization requirement in narrow-leafed lupin. Plant Breed. 2007;126:306–9. [Google Scholar]
- 13.Boersma J.G., Buirchell B.J., Sivasithamparam K., Yang H. Development of a PCR marker tightly linked to mollis, the gene that controls seed dormancy in Lupinus angustifolius L. Plant Breed. 2007;126:612–6. [Google Scholar]
- 14.You M., Boersma J., Buirchell B., Sweetingham M., Siddique K., Yang H. A PCR-based molecular marker applicable for marker-assisted selection for anthracnose disease resistance in lupin breeding. Cell. Mol. Biol. Lett. 2005;10:123–34. [PubMed] [Google Scholar]
- 15.Kaczmarek A., Naganowska B., Wolko B. Karyotyping of the narrow-leafed lupin (Lupinus angustifolius L.) by using FISH, PRINS and computer measurements of chromosomes. J. Appl. Genet. 2009;50:77–82. doi: 10.1007/BF03195657. [DOI] [PubMed] [Google Scholar]
- 16.Naganowska B., Zielinska A. Physical mapping of 18S-25S rDNA and 5S rDNA in Lupinus via fluorescent in situ hybridization. Cell. Mol. Biol. Lett. 2002;7:665–70. [PubMed] [Google Scholar]
- 17.Sato S., Nakamura Y., Kaneko T., et al. Genome structure of the legume, Lotus japonicus. DNA Res. 2008;15:227–39. doi: 10.1093/dnares/dsn008. [DOI] [PMC free article] [PubMed] [Google Scholar]
- 18.Yang H., Boersma J.G., You M., Buirchell B.J., Sweetingham M.W. Development and implementation of a sequence-specific PCR marker linked to a gene conferring resistance to anthracnose disease in narrow-leafed lupin (Lupinus angustifolius L.) Mol. Breed. 2004;14:145–51. [Google Scholar]
- 19.Wolko B., Weeden N. Linkage map of isozymes and RAPD markers for L. angustifolius L. Proceedings of the VIIth International Lupin Conference; Evora, Portugal: 1993. [Google Scholar]
- 20.Kasprzak A., Šafar J., Janda J., Dolezel J., Wolko B., Naganowska B. The bacterial artificial chromosome (BAC) library of the narrow-leafed lupin (Lupinus angustifolius L.) Cell. Mol. Biol. Lett. 2006;11:396–407. doi: 10.2478/s11658-006-0033-3. [DOI] [PMC free article] [PubMed] [Google Scholar]
- 21.Vos P., Hogers R., Bleeker M., et al. AFLP: A new technique for DNA fingerprinting. Nucleic Acids Res. 1995;23:4407–14. doi: 10.1093/nar/23.21.4407. [DOI] [PMC free article] [PubMed] [Google Scholar]
- 22.Yang H., Sweetingham M.W., Cowling W.A., Smith P.M.C. DNA fingerprinting based on microsatellite-anchored fragment length polymorphisms, and isolation of sequence-specific PCR markers in lupin (Lupinus angustifolius L.) Mol. Breed. 2001;7:203–9. [Google Scholar]
- 23.Mester D., Ronin Y., Minkov D., Nevo E., Korol A. Constructing large-scale genetic maps using an evolutionary strategy algorithm. Genetics. 2003;165:2269–82. doi: 10.1093/genetics/165.4.2269. [DOI] [PMC free article] [PubMed] [Google Scholar]
- 24.Altschul S., Gish W., Miller W., Myers E., Lipman D. Basic local alignment search tool. J. Mol. Biol. 1990;215:403–10. doi: 10.1016/S0022-2836(05)80360-2. [DOI] [PubMed] [Google Scholar]
- 25.Hunter A., Schibeci D., Hiew H., Grendel B. Australasian Workshop on Grid Computing and e-Research. 2005. A bioinformatics Web Service-based architecture for accessing HPC resources. [Google Scholar]
- 26.Moolhuijzen P., Cakir M., Macgregor A., et al. LegumeDB bioinformatics resource: Comparative genomic analysis and novel cross-genera marker identification in lupin and pasture legume species. Genome. 2006;49:689–99. doi: 10.1139/g06-009. [DOI] [PubMed] [Google Scholar]
- 27.Nelson M.N., Lydiate D. New evidence from Sinapis alba L. for ancestral triplication in a crucifer genome. Genome. 2006;49:230–8. doi: 10.1139/g05-099. [DOI] [PubMed] [Google Scholar]
- 28.Bertioli D., Moretzsohn M., Madsen L., et al. An analysis of synteny of Arachis with Lotus and Medicago sheds new light on the structure, stability and evolution of legume genomes. BMC Genomics. 2009;10:45. doi: 10.1186/1471-2164-10-45. [DOI] [PMC free article] [PubMed] [Google Scholar]
- 29.Lysak M.A., Berr A., Pecinka A., Schmidt R., McBreen K., Schubert I. Mechanisms of chromosome number reduction in Arabidopsis thaliana and related Brassicaceae species. Proc. Natl Acad. Sci. USA. 2006;103:5224–9. doi: 10.1073/pnas.0510791103. [DOI] [PMC free article] [PubMed] [Google Scholar]
Associated Data
This section collects any data citations, data availability statements, or supplementary materials included in this article.


