

Abstract
Gene-to-gene coexpression analysis is a powerful approach to infer the function of uncharacterized genes. Here, we report comprehensive identification of coexpression gene modules of tomato (Solanum lycopersicum) and experimental verification of coordinated expression of module member genes. On the basis of the gene-to-gene correlation coefficient calculated from 67 microarray hybridization data points, we performed a network-based analysis. This facilitated the identification of 199 coexpression modules. A gene ontology annotation search revealed that 75 out of the 199 modules are enriched with genes associated with common functional categories. To verify the coexpression relationships between module member genes, we focused on one module enriched with genes associated with the flavonoid biosynthetic pathway. A non-enzyme, non-transcription factor gene encoding a zinc finger protein in this module was overexpressed in S. lycopersicum cultivar Micro-Tom, and expression levels of flavonoid pathway genes were investigated. Flavonoid pathway genes included in the module were up-regulated in the plant overexpressing the zinc finger gene. This result demonstrates that coexpression modules, at least the ones identified in this study, represent actual transcriptional coordination between genes, and can facilitate the inference of tomato gene function.
Keywords: coexpression, flavonoid, Solanum lycopersicum, tomato, zinc finger
1. Introduction
To elucidate functional relationships between genes, coexpression analysis has proven to be a powerful approach. From a practical point of view, coexpression analysis requires two technical bases. The first is transcriptome data. Several model organisms, including Escherichia coli, yeast, and Arabidopsis, have been regarded as excellent targets for coexpression analysis, since a large amount of microarray data are publicly available. The second technical basis is the development of analytical methods. Generally, once coexpression measures between genes (e.g. correlation coefficients) have been estimated, subsequent coexpression analysis steps include visualization of the coexpression relationships, identification of densely correlated gene groups, and interpretation of biological relevance.1 Among several possible visualization methods, network representation provides an efficient way to depict complex relationships between many genes. To identify densely correlated gene groups, several algorithms have been developed based on connectivity of the network.2–4 For biologically relevant interpretation, data from other types of ‘omics’ analyses (e.g. metabolomics and interactomics) often help greatly. With these analytical methods, coexpression analysis at last allows the function of an unknown gene to be inferred.
Excellent technical bases for coexpression analysis have been established for the model plant Arabidopsis thaliana. To accumulate transcriptome data, various data repositories are now available, including NASCArrays,5 GEO,6 SMD,7 ArrayExpress,8 and AtGenExpress,9–11 which collectively provide more than 4753 microarray data points (3 September 2009). The results of coexpression analysis using this huge data set were combined with comprehensive gene annotations and data from metabolomics analysis, and then functions of several unknown genes associated with glucosinolate and flavonoid biosynthesis were elucidated.12–14 In parallel with the elucidation of function of individual genes, the genome-wide coexpression profile was also investigated and the results are available in databases such as ATTED-II,15 GENEVESTIGATOR,16 and BAR.17
Recently, several attempts have been made for large-scale gene expression analysis of tomato (Solanum lycopersicum). For example, the gene expression profile during fruit development was investigated in detail using a tomato microarray.18,19 Another example is the investigation of tissue-dependent gene expression. In fruit peel, coordinated expression of genes associated with metabolism of cuticular components, metabolism of hormones, and metabolism of cell wall components was demonstrated by hierarchical clustering analysis.20 Hierarchical clustering of gene expression patterns also demonstrated that acquisition of the fleshy fruit trait depends on tight regulation of gene expression.21 These studies suggest that large-scale coexpression analysis can shed light on the molecular mechanisms that control fruit development. However, these studies focused on few specific biological processes, and comprehensive identification of groups of highly correlated genes has not been reported.
In this study, we report on the comprehensive identification of groups of highly correlated genes, or coexpression modules, in tomato. We performed a gene-to-gene coexpression analysis using a network-based approach. We evaluated developmental changes in gene expression profiles in various tissues of tomato plants using an Affymetrix GeneChip Tomato Genome Array. Using gene expression data from 67 hybridizations, gene-to-gene Pearson's correlation coefficients (PCCs) were estimated, and then 199 coexpression modules associated with various biological processes were identified based on an analysis of network topology. Gene ontology (GO) annotation analysis revealed enrichment of genes belonging to common functional categories in 75 modules. We then experimentally verified the coordinated expression of module member genes using tomato plants overexpressing a non-enzymatic module member gene that is a strong candidate for a regulatory gene in flavonoid biosynthesis. This result demonstrates the facilitation by coexpression analysis of the identification of the function of uncharacterized tomato genes.
2. Materials and methods
2.1. Plant materials
Miniature tomato, S. lycopersicum cultivar Micro-Tom, was grown as described previously.22 Roots were harvested 5 weeks after germination. Hypocotyl and cotyledon were harvested 3 weeks after germination. Third leaves were harvested 3 weeks after germination. All leaves of tomato plants were harvested 3 and 5 weeks after germination. Fruits were harvested at four developmental stages: mature green (MG, ∼30 days after anthesis), yellow (Y, ∼35 days after anthesis), orange (O, ∼38–40 days after anthesis), and red (R, ∼45–48 days after anthesis). S. lycopersicum cultivar Momotaro 8® (Takii & Co., Ltd, Kyoto, Japan) was grown in a greenhouse under natural photoperiod conditions from March to July 2006 in Chiba Prefecture. S. lycopersicum line 27859 was grown under field conditions from March to July 2006 in Gunma Prefecture. Monogenic mutant tomato, Anthocyanin fruit (Aft, LA1996), was provided by the C. M. Rick Tomato Genetic Resource Center (University of California, Davis, CA, USA), and was grown in a greenhouse under natural photoperiod conditions from March to July 2006 in Chiba Prefecture. Fruits of Momotaro 8®, line 27859, and Aft were harvested at MG and R stages. The peel and the flesh of fruits of Micro-Tom, Momotaro 8®, line 27 859, and Aft were separated using a razor blade. Harvested tissues were immediately frozen in liquid nitrogen and stored at −80°C.
2.2. Preparation of RNA
Total RNA was extracted from tissues by an acid guanidinium thiocyanate-phenol-chloroform method.23 Sugars were removed by a sodium acetate-precipitation method.24
2.3. DNA microarray analysis
Target for hybridization experiments was prepared using GeneChip One-Cycle Labeling and Control Reagents (Affymetrix, URL: http://www.affymetrix.com/) according to the manufacturer's instructions. GeneChip Tomato Genome Arrays (Affymetrix) were used for hybridization. Hybridization, washing, and staining were performed according to the manufacturer's instructions. Scanned GeneChip images were analysed using Microarray Suite version 5.0.1 software (Affymetrix). Normalization and analysis of microarray data were performed using GeneSpring GX 7.3 software (Agilent Technologies, URL: http://www.home.agilent.com/). The data were normalized per chip and per gene to the median value. CEL files of these experiments are available in Gene Expression Omnibus6 (GEO) DataSets (http://www.ncbi.nlm.nih.gov/gds) series record GSE19326.
2.4. Coexpression analysis and network analysis
Before performing coexpression analysis, the probes used for the analysis were screened as follows. First, probes for which flags were ‘A’ (absent) in all of the samples were excluded. Second, the coefficient of variance between biological replicates of a tissue was calculated, and probes were selected if they showed a coefficient of variance <1 in all of the samples. This probe screening procedure left 7644 probes for the following coexpression analysis. Normalized values of the selected probes were used to estimate the pairwise PCC. The data set for the PCC was then analysed using a network-based module-finding algorithm described previously by Ogata et al.4 This algorithm generates coexpression modules from a given ‘seed’ gene in six steps.4 In the first step, a seed gene was arbitrary chosen. In the second step, genes that directly connect to the seed gene with PCC higher than cutoff value (0.6) were selected, and referred to as a highly correlated gene group. In the third step, VB index was defined as VB(i) = e(i)/d(i), where VB(i) is a VB value of ith gene in the group, e(i) the number of edges between ith gene and other group member genes, and d(i) the number of edges between ith gene and all genes irrespective of group membership. VB value was calculated for all group member genes, and a gene that has the lowest VB value was excluded from the group. In the fourth step, from the highly correlated gene group, a subgroup that had the highest NB value4 was selected. NB value is defined as NB = Σe(i)/Σd(i), where definitions of e(i) and d(i) are the same as above. In short, NB represents a ratio of the number of edges within the subgroup to the number of all edges associated with subgroup members. The selected subgroup was referred to as ‘the best kernel gene group’. In the fifth step, VB value was calculated for all non-member genes. If a non-member gene had the ratio higher than threshold value, that gene was incorporated into the group. Finally, the best kernel group genes and genes incorporated in the fifth step were selected as members of a coexpression module. NB values of coexpression modules were calculated again, and coexpression modules with NB values >0.5 were selected. Threshold values were as follows: 0.6 for PCC, 0.333 for VB value, and 0.5 for NB value. For GO annotation of tomato genes, similarity search of the Affymetrix tomato consensus sequences that were used to design GeneChip probes (Tomato Consensus Sequences, downloaded from http://www.affymetrix.com/products_services/arrays/specific/tomato.affx#1_4) was performed against Arabidopsis genes (TAIR8_cdna_20080412, downloaded from the TAIR FTP site, http://www.arabidopsis.org/download/index.jsp) using the BLASTN algorithm. GO annotations of tomato genes were retrieved from TAIR GO Annotation Search (http://www.arabidopsis.org/tools/bulk/go/index.jsp) according to the best match to Arabidopsis genes.
2.5. Transformation of tomato plant
A full-length cDNA clone of zinc finger protein (clone ID: LEFL2003DB10, GenBank accession number AK326277) was provided by National Bio-Resource Project Tomato25 (http://tomato.nbrp.jp/indexEn.html). Protein coding region of LEFL2003DB10 was amplified by PCR using a gene-specific primer set (5′-GGGGGGATCCATGGCAGTTGAGGCAAGACATC and 5′-GGGGGAGTCTTCAAGAAGACATGTTAACATGCAC). PCR product was cloned in between BamHI and SacI sites of pBE2113-GUS.26 Transformation of S. lycopersicum cv. Micro-Tom was performed essentially as described by Sun et al.27 with slight modification. Cotyledon and hypocotyl segments from 7-day-old seedling were used as explants. Explants were dipped in Agrobacterium tumefaciens (strain EHA105) suspension for 10 min and blotted dry on a sterilized paper towel. The explants were then placed on co-cultivation medium [MS salts, 3% (w/v) sucrose, 0.8% (w/v) agar, 1.75 mg/l zeatin, pH 5.8], and the plate was incubated for 48 h in the dark at 25°C. The explants were then cultured and selected on a callus induction plate containing MS salts, 3% (w/v) sucrose, 0.8% (w/v) agar, 1.5 mg/l zeatin, 50 mg/l kanamycin, 125 mg/l carbenicillin, 50 mg/l Meropen (Dainippon Sumitomo Pharma, Osaka, Japan) (pH 5.8). Every 2 weeks, calli were subcultured to a fresh callus induction plate. Subculture was repeated three times and zeatin concentration in the medium was gradually decreased (1.5, 1.0, and then 0.75 mg/l). Regenerated shoots were then rooted on a rooting plate containing half-strength MS salts, 3% (w/v) sucrose, 0.8% (w/v) agar, 50 mg/l Meropen (pH 5.8). Rooted plants were transferred to rock fibre (Nittobo, Tokyo, Japan, URL: http://www.nittobo.co.jp/english/index.htm), and then to a mixture of vermiculite and Powersoil (mix ratio 1:1, Kureha Chemical Ind., Tokyo, Japan, and Kanto Hiryou Ind., Saitama, Japan).
2.6. Real-time RT–PCR
RT–PCR experiments were performed to confirm gene expression patterns observed in microarray experiments. The total RNA samples used as templates in microarray analysis were reverse transcribed using SuperScript III First-Strand Synthesis System (Invitrogen Corp., URL: http://www.invitrogen.com/) according to the manufacturer's instructions. Following reverse transcription, PCR was carried out using rTaq DNA polymerase (Takara Bio Inc., URL; http://www.takara-bio.com/index.htm). Real-time PCR reactions to confirm gene expression were carried out using a DyNAmo™ HS SYBR® Green qPCR Kit (New England Biolabs Inc., URL: http://www.neb.com/nebecomm/default.asp) by a DNA Engine Opticon 2 system (MJ Research Inc., Waltham, MA, USA). Primers used in this study are shown in Supplementary data 1. Elongation factor 1a gene (GenBank accession number X14449) was used as a control.
2.7. Transient expression of GFP-fusion protein
Transient expression vectors of the zinc finger protein fused to GFP were produced as described in Supplementary data 2. CaMV35S-sGFP(S65T)-nos3′ vector28 was used for transient expression of free GFP. The vectors were introduced to the epidermis of onion purchased from local market. Particle bombardment was performed by using Helios Gene Gun (Bio-Rad Laboratories, URL: http://www3.bio-rad.com/) according to the manufacturer's instruction. Expression of GFP-fusion proteins was monitored by using a confocal laser scanning microscope LSM700 (Carl Zeiss, URL: http://www.zeiss.com/). Image processing was performed using the ZEN 2008 software (Carl Zeiss).
3. Results and discussion
3.1. Identification of coexpression modules
We obtained gene expression data for tomato from 67 hybridizations using RNA derived from roots, hypocotyls, cotyledons, leaves, and fruits (Table 1, Supplementary data 3). To estimate coexpression profiles, we first calculated PCC values for all pair-wise combinations of the 7644 quality-checked probes (see Materials and methods). To find coexpression modules, we first generated network graphs using different PCC cutoff values. Network density became minimal at a cutoff value of 0.91, suggesting that, at a PCC cutoff value >0.91, a decreasing number of nodes are more tightly connected (Fig. 1A). Indeed, the numbers of nodes and edges decreased at PCC cutoffs >0.91 (Fig. 1B and C). However, even at a PCC cutoff of 0.95, the network was still complex, containing ∼1000 nodes and 5000 edges (Fig. 1B and C). Thus, we concluded that the use of a PCC cutoff value alone will not efficiently find coexpression modules to an extent allowing the inference of module functions.
Table 1.
Microarray data used for coexpression analysis
| Tomato cultivar | Tissue | Developmental stage | Biological replicates | ID in Supplementary data 1 |
|---|---|---|---|---|
| Micro-Tom | Root | 5 weeks after germination | 3 | MT_5Wroot |
| Hypocotyl | 3 weeks after germination | 2 | MT_3Whypocoty | |
| Cotyledon | 3 weeks after germination | 2 | MT_3Wcotyledon | |
| Leaf | 3 weeks after germination | 2 | MT_3rdleaf | |
| Leaf | 3 weeks after germination | 3 | MT_3Wleaf | |
| Leaf | 5 weeks after germination | 3 | MT_5Wleaf | |
| Fruit flesh | MG, 30 days after anthesis | 3 | MT_MG_flesh | |
| Fruit flesh | Y, 35 days after anthesis | 2 | MT_Y_flesh | |
| Fruit flesh | O, 38–40 days after anthesis | 2 | MT_O_flesh | |
| Fruit flesh | R, 45–48 days after anthesis | 3 | MT_R_flesh | |
| Fruit peel | MG, 30 days after anthesis | 3 | MT_MG_peel | |
| Fruit peel | Y, 35 days after anthesis | 2 | MT_Y_peel | |
| Fruit peel | O, 38–40 days after anthesis | 2 | MT_O_peel | |
| Fruit peel | R, 45–48 days after anthesis | 3 | MT_R_peel | |
| Aft (LA1996) | Fruit flesh | MG, 40 days after anthesis | 3 | Aft_MG_flesh |
| Fruit flesh | R, 50–55 days after anthesis | 3 | Aft_R_flesh | |
| Fruit peel | MG, 40 days after anthesis | 3 | Aft_MG_peel | |
| Fruit peel | R, 50–55 days after anthesis | 3 | Aft_R_peel | |
| Line27859 | Fruit flesh | MG, 40 days after anthesis | 3 | Line27859_MG_flesh |
| Fruit flesh | R, 50–55 days after anthesis | 3 | Line27859_R_flesh | |
| Fruit peel | MG, 40 days after anthesis | 3 | Line27859_MG_peel | |
| Fruit peel | R, 50–55 days after anthesis | 3 | Line27859_R_peel | |
| Momotaro8 | Fruit flesh | R, 50–55 days after anthesis | 4 | MO_R_flesh |
| Fruit peel | R, 50–55 days after anthesis | 4 | MO_R_peel |
MG, mature green; Y, yellow; O, orange; R, red.
Figure 1.

Global topology of the tomato coexpression network. (A) Network density, (B) number of nodes, and (C) number of edges, at varied PCC cutoff values. Inserts are magnified curves within a cutoff range from 0.85 to 1.0. Network density showed the minimal value at PCC cutoff 0.91. Arrows in the inserts indicate this cutoff value.
We attempted to identify coexpression modules using an alternative module-finding algorithm developed by Ogata et al.4 This algorithm detects coexpression modules not only by using PCC cutoff, but also by evaluating density and connectivity of networks. Each coexpression module was reconstituted from a given seed gene. Genes directly connected to the seed gene were first selected using PCC cutoff value. From this set of correlated genes, a subgroup that had the highest NB value4 (see Materials and methods) was selected, and referred to as the kernel group. Next, VB value (for definition, see Materials and methods) was calculated for all genes not belonging to the kernel group. If the gene had VB value higher than the threshold, that gene was incorporated into the kernel group. Resulting set of genes was defined as coexpression module. Modules with NB value above threshold were selected for further analysis. As a result, generated modules have dense connections within the module and sparse connections to other modules. When member genes overlapped between multiple modules, non-redundant member genes were bundled into a larger module. It has been reported that this approach can detect coexpression modules with better assignment to biological processes (e.g. metabolic pathway) than other algorithms.4 On the basis of this approach, 199 coexpression modules were identified (Supplementary data 4) using following threshold values: PCC cutoff, 0.6; VB value, 0.333; and NB value, 0.5. The number of member probes per module ranged from 3 to 103, with a median value of 7 member probes per module (Fig. 2A). The distribution of the NB value4 showed that more than 40% of the modules have an NB value >0.8, indicating that the modules have high intra-modular connectivity (Fig. 2B).
Figure 2.

Distribution of characteristic parameters of the identified coexpression modules. Distribution of (A) number of member probes per module and (B) NB value. NB value is defined as a ratio of a number of edges within the module and a total number of edges between module members and all possible nodes irrespective of membership in the module. Median value of the number of member probes per module is 7. More than 40% of the modules have NB values >0.8, indicating that intra-modular connectivity is high in the coexpression modules.
Functions of the modules were inferred using GO annotations. GO annotations to tomato probes were provided according to their similarity to Arabidopsis genes using a TAIR GO annotation search. First, we investigated whether or not specific GO terms were enriched in a given module compared with the GO term distribution in all Affymetrix tomato microarray probes. Enrichment of GO categories with significance at the 1% level was observed in 75 modules (Table 2). Enriched GO categories included chloroplast, plastid, cytosol, ribosome, other enzymatic activity, transferase activity, hydrolase activity, kinase activity, structural molecule activity, protein metabolism, and response to stress (Fig. 3). Ribosome-related genes were expected to be coexpressed, since ribosome is a protein complex. Coexpression modules enriched with chloroplast-related genes appear to be classified into several subgroups according to the sub-plastidal localization (e.g. envelope, thylakoid, and stroma) of proteins encoded by the module member genes.
Table 2.
Coexpression modules in which transcription factor genes are present or GO annotations are enriched
| ID | NB | Average PCC | Num. of member probes | Num. of Arabidopsis genes | Num. of SGN unigenes | Num. of DFCI TCs | Num. of transcription factors | Enriched GO categoriesa |
|---|---|---|---|---|---|---|---|---|
| 1 | 1.000 | 0.805 | 5 | 4 | 5 | 5 | 2 | |
| 2 | 1.000 | 0.870 | 5 | 3 | 2 | 2 | 1 | |
| 3 | 1.000 | 0.642 | 11 | 7 | 6 | 9 | 1 | CC2, CC6 |
| 5 | 1.000 | 0.749 | 5 | 2 | 0 | 3 | 1 | |
| 6 | 1.000 | 0.552 | 9 | 5 | 5 | 6 | 0 | BP5, BP6 |
| 9 | 1.000 | 0.647 | 10 | 9 | 8 | 9 | 0 | MF1, MF4 |
| 15 | 1.000 | 0.368 | 6 | 4 | 4 | 6 | 1 | |
| 17 | 1.000 | 0.731 | 6 | 6 | 6 | 6 | 0 | BP7 |
| 18 | 1.000 | 0.572 | 4 | 3 | 4 | 4 | 0 | CC2 |
| 22 | 1.000 | 0.774 | 7 | 6 | 6 | 7 | 0 | BP8 |
| 25 | 1.000 | 0.847 | 11 | 10 | 11 | 11 | 0 | CC4, BP6 |
| 27 | 1.000 | 0.655 | 7 | 6 | 6 | 7 | 0 | MF9 |
| 29 | 1.000 | 0.483 | 7 | 7 | 5 | 6 | 0 | MF1 |
| 33 | 1.000 | 0.758 | 5 | 5 | 3 | 5 | 0 | BP8 |
| 34 | 1.000 | 0.407 | 4 | 2 | 3 | 4 | 1 | |
| 36 | 0.938 | 0.881 | 8 | 6 | 6 | 7 | 0 | BP1 |
| 38 | 0.914 | 0.752 | 10 | 6 | 8 | 10 | 0 | CC2 |
| 39 | 0.910 | 0.667 | 10 | 7 | 6 | 7 | 0 | MF3 |
| 41 | 0.901 | 0.837 | 5 | 5 | 3 | 5 | 0 | CC10, CC11 |
| 48 | 0.875 | 0.538 | 12 | 10 | 12 | 12 | 1 | |
| 49 | 0.863 | 0.664 | 14 | 11 | 13 | 13 | 0 | MF1, MF4, BP6 |
| 50 | 0.858 | 0.634 | 13 | 8 | 8 | 11 | 0 | CC10, CC11, MF12, BP4 |
| 52 | 0.858 | 0.842 | 12 | 4 | 10 | 11 | 2 | |
| 53 | 0.858 | 0.609 | 9 | 8 | 8 | 8 | 3 | |
| 55 | 0.858 | 0.780 | 7 | 6 | 6 | 7 | 0 | CC10, CC11, MF12, BP4 |
| 61 | 0.858 | 0.766 | 5 | 5 | 4 | 5 | 0 | CC2 |
| 62 | 0.858 | 0.654 | 10 | 8 | 9 | 9 | 0 | BP5, BP6 |
| 64 | 0.850 | 0.824 | 17 | 13 | 13 | 15 | 0 | MF1, BP2 |
| 65 | 0.847 | 0.404 | 5 | 4 | 5 | 5 | 1 | |
| 66 | 0.834 | 0.771 | 12 | 12 | 11 | 12 | 0 | CC9, MF8 |
| 67 | 0.834 | 0.700 | 11 | 11 | 8 | 11 | 0 | CC2, CC6 |
| 70 | 0.826 | 0.578 | 18 | 15 | 13 | 16 | 0 | CC2, CC6 |
| 71 | 0.819 | 0.470 | 8 | 8 | 8 | 8 | 1 | MF7 |
| 72 | 0.815 | 0.597 | 6 | 3 | 4 | 6 | 1 | |
| 74 | 0.811 | 0.628 | 19 | 18 | 18 | 18 | 3 | CC8 |
| 77 | 0.801 | 0.753 | 4 | 4 | 1 | 3 | 0 | CC11 |
| 78 | 0.801 | 0.745 | 6 | 4 | 6 | 6 | 1 | |
| 79 | 0.801 | 0.631 | 10 | 7 | 10 | 10 | 0 | MF5 |
| 80 | 0.801 | 0.894 | 5 | 5 | 4 | 5 | 0 | MF3 |
| 82 | 0.801 | 0.888 | 5 | 5 | 5 | 5 | 1 | |
| 86 | 0.786 | 0.786 | 103 | 78 | 85 | 97 | 2 | CC1, CC2, CC3, CC6, MF1, MF4, MF9, BP2, BP12 |
| 88 | 0.767 | 0.737 | 9 | 7 | 6 | 7 | 0 | MF1 |
| 89 | 0.750 | 0.666 | 14 | 13 | 12 | 13 | 0 | CC4, MF2, BP3 |
| 90 | 0.750 | 0.772 | 8 | 8 | 8 | 8 | 0 | BP4 |
| 93 | 0.750 | 0.613 | 12 | 12 | 10 | 12 | 0 | MF2, BP3 |
| 101 | 0.734 | 0.810 | 14 | 11 | 10 | 14 | 0 | CC10, CC11, MF12, BP4 |
| 102 | 0.734 | 0.825 | 12 | 11 | 12 | 12 | 0 | CC2, CC6 |
| 103 | 0.733 | 0.677 | 11 | 8 | 7 | 10 | 0 | MF7 |
| 104 | 0.728 | 0.564 | 7 | 5 | 3 | 7 | 0 | MF1 |
| 105 | 0.728 | 0.845 | 8 | 5 | 8 | 8 | 1 | |
| 108 | 0.719 | 0.652 | 8 | 8 | 6 | 8 | 1 | |
| 109 | 0.711 | 0.633 | 100 | 69 | 80 | 94 | 14 | CC4, CC8, MF1, MF11, BP5, BP6, BP7 |
| 110 | 0.706 | 0.800 | 10 | 10 | 8 | 10 | 0 | CC7, CC13, BP7 |
| 111 | 0.693 | 0.722 | 10 | 8 | 8 | 9 | 0 | CC2, CC6 |
| 117 | 0.688 | 0.635 | 10 | 8 | 8 | 10 | 0 | MF5 |
| 118 | 0.688 | 0.784 | 8 | 4 | 8 | 8 | 1 | |
| 119 | 0.671 | 0.851 | 14 | 13 | 10 | 13 | 0 | BP9 |
| 120 | 0.667 | 0.599 | 14 | 14 | 11 | 14 | 1 | CC4, BP4 |
| 122 | 0.667 | 0.639 | 7 | 4 | 3 | 7 | 0 | BP5, BP6 |
| 126 | 0.667 | 0.639 | 10 | 10 | 9 | 10 | 0 | CC7, MF6 |
| 127 | 0.667 | 0.601 | 7 | 7 | 7 | 7 | 0 | BP3 |
| 128 | 0.667 | 0.783 | 9 | 9 | 6 | 9 | 0 | BP4 |
| 132 | 0.667 | 0.814 | 7 | 7 | 4 | 7 | 2 | |
| 137 | 0.667 | 0.692 | 4 | 3 | 4 | 4 | 0 | CC11 |
| 139 | 0.666 | 0.669 | 52 | 44 | 43 | 50 | 12 | CC4, CC8, CC12, MF10, MF11, BP5, BP6, BP9, BP11 |
| 140 | 0.650 | 0.623 | 9 | 8 | 8 | 9 | 0 | CC4 |
| 141 | 0.650 | 0.662 | 9 | 9 | 7 | 9 | 0 | CC3, CC10, CC11, MF10, MF12 |
| 142 | 0.643 | 0.819 | 8 | 7 | 8 | 8 | 1 | |
| 144 | 0.635 | 0.787 | 16 | 14 | 15 | 16 | 2 | CC4, MF7, BP7 |
| 145 | 0.632 | 0.722 | 13 | 13 | 13 | 13 | 1 | CC4, MF7 |
| 147 | 0.632 | 0.893 | 3 | 3 | 3 | 3 | 1 | |
| 148 | 0.625 | 0.662 | 5 | 5 | 4 | 5 | 0 | MF3, MF6 |
| 149 | 0.622 | 0.864 | 13 | 10 | 10 | 13 | 0 | CC1, MF5, BP4 |
| 151 | 0.617 | 0.734 | 34 | 22 | 27 | 34 | 0 | CC7, MF5 |
| 152 | 0.609 | 0.860 | 18 | 14 | 16 | 18 | 0 | CC9, BP7, BP10 |
| 154 | 0.600 | 0.893 | 3 | 2 | 2 | 2 | 0 | MF6 |
| 155 | 0.600 | 0.623 | 7 | 7 | 6 | 7 | 1 | |
| 163 | 0.596 | 0.778 | 14 | 12 | 9 | 14 | 0 | CC4, CC5, BP8 |
| 165 | 0.589 | 0.788 | 9 | 9 | 8 | 9 | 1 | |
| 166 | 0.587 | 0.838 | 16 | 11 | 12 | 14 | 0 | CC10, CC11, MF12, BP4 |
| 167 | 0.581 | 0.832 | 23 | 17 | 22 | 22 | 1 | MF5, MF6 |
| 169 | 0.576 | 0.686 | 32 | 22 | 30 | 29 | 4 | BP9 |
| 171 | 0.571 | 0.876 | 25 | 19 | 20 | 25 | 1 | CC9, MF7, MF8, MF9 |
| 172 | 0.570 | 0.758 | 47 | 34 | 41 | 43 | 1 | CC2, CC3, CC6, MF1, BP10 |
| 174 | 0.563 | 0.898 | 8 | 8 | 7 | 8 | 0 | CC10, CC11, MF12, BP4 |
| 175 | 0.556 | 0.868 | 7 | 7 | 5 | 7 | 0 | MF6 |
| 176 | 0.551 | 0.719 | 13 | 11 | 9 | 13 | 0 | CC4, MF2, BP3 |
| 180 | 0.546 | 0.762 | 7 | 2 | 7 | 7 | 1 | |
| 182 | 0.546 | 0.704 | 7 | 7 | 6 | 7 | 1 | CC2 |
| 184 | 0.542 | 0.716 | 28 | 26 | 21 | 27 | 3 | MF6, BP7 |
| 188 | 0.524 | 0.810 | 10 | 7 | 7 | 10 | 0 | CC10, CC11 |
| 189 | 0.522 | 0.520 | 6 | 5 | 5 | 6 | 0 | BP6 |
| 190 | 0.519 | 0.775 | 9 | 6 | 7 | 7 | 0 | MF4 |
| 192 | 0.500 | 0.781 | 7 | 6 | 7 | 7 | 0 | CC3 |
| 193 | 0.500 | 0.848 | 7 | 5 | 6 | 6 | 0 | CC10, CC11, MF12, BP4 |
| 197 | 0.500 | 0.785 | 4 | 4 | 4 | 4 | 0 | CC10, CC11 |
| 199 | 0.500 | 0.792 | 9 | 8 | 8 | 9 | 1 |
aCC1, other intracellular components; CC2, chloroplast; CC3, other cytoplasmic components; CC4, unknown cellular components; CC5, other membranes; CC6, plastid; CC7, plasma membrane; CC8, nucleus; CC9, mitochondria; CC10, cytosol; CC11, ribosome; CC12, cell wall; CC13, ER; MF1, other enzyme activity; MF2, unknown molecular functions; MF3, transferase activity; MF4, other binding; MF5, hydrolase activity; MF6, kinase activity; MF7, protein binding; MF8, nucleotide binding; MF9, transporter activity; MF10, DNA or RNA binding; MF11, transcription factor activity; MF12, structural molecule activity; BP1, other cellular processes; BP2, other metabolic processes; BP3, unknown biological processes; BP4, protein metabolism; BP5, response to abiotic or biotic stimulus; BP6, response to stress; BP7, developmental processes; BP8, transport; BP9, other biological processes; BP10, cell organization and biogenesis; BP11, transcription; BP12, electron transport or energy pathways.
Figure 3.

Distribution of GO category significantly enriched within a coexpression module. Note that GO categories of ‘chloroplast’ and ‘plastid’ are frequently associated with the same genes. GO categories of ‘cytosol’, ‘ribosome’, ‘structural molecule activity’, and ‘protein metabolism’ are frequently associated with the same genes.
3.2. Coexpression modules containing transcription factor genes
Coexpression analysis can facilitate prediction of functions of regulatory proteins that do not have enzymatic, transporter, or structural molecule activities. Modules containing transcription factor genes are of particular interest, since these transcription factors may have a role in controlling the expression of other module member genes. We identified 37 modules containing transcription factors in the 199 modules. In 16 modules containing transcription factors, significant enrichment of certain GO categories was observed (Table 2). For example, two transcription factor genes are found in module 52 (Table 2, Supplementary data 4). Genes corresponding to Les.3716.1.S1_at (GenBank accession number AJ277944) and Les.3517.2.S1_a_at (GenBank accession number BT012879), respectively, encoding Myb-family and TCP-family transcription factors, are tightly correlated with seven protease inhibitor unigenes (SGN tomato unigenes: SGN-U313509, SGN-U312622, SGN-U312829, SGN-U312623, SGN-U312822, SGN-U313508, and SGN-U312824) (Supplementary data 4). This implies that these transcription factors regulate expression of protease inhibitor genes. Another example is module 3 (Table 2, Supplementary data 4). Gene corresponding to LesAffx.69411.1.S1_at (GenBank accession number AW651000) encoding bHLH-family transcription factor is correlated exclusively with plastid-associated genes, implying that this bHLH-family protein is associated with the regulation of plastid function.
3.3. Regulatory protein that does not belong to transcription factor family can regulate expression of module member genes
Elucidation of the role of transcription factors in regulating expression of coexpressed genes has been well documented.13 However, the role of regulatory protein genes that are not classified as transcription factors in the regulation of coexpressed genes remains unclear. We tested whether a non-transcription factor-type regulatory gene can control the coordinated expression of genes in a given module. To exemplify this, we performed an experimental analysis of module 64 (NB value 0.850, average PCC value 0.822), in which flavonoid biosynthesis genes are enriched (Table 3). Expression profiles of member genes of this module show that they are highly expressed in fruit peel tissues, and are expressed at a lower level in leaf and fruit flesh tissues, an expression pattern that correlates with the localization of tomato flavonoid compounds22 (Fig. 4A). We found that one of the non-enzymatic genes, corresponding to Les.2294.2.A1_at (GenBank accession number AK326277), encodes RING-finger type zinc finger protein by protein domain search using InterProScan29 (http://www.ebi.ac.uk/Tools/InterProScan/), although description of the best match Arabidopsis gene (At1g79110) and SGN unigene (SGN-U323178) indicates ‘expressed protein’ (Fig. 4B, Supplementary data 4). In a network graph of module 64, enzymatic genes of flavonoid biosynthesis are tightly interconnected. The zinc finger protein gene, hereafter referred to as ZnF, has direct links to genes of 4-coumarate-CoA ligase, cinnamoyl-CoA reductase, chalcone synthase 1, flavanone 3-hydroxylase, flavonol synthase, glycosyltransferases, and malonyl-CoA synthetase (Fig. 4C). To test whether this ZnF gene controls expression of flavonoid biosynthetic genes, we overexpressed a full-length cDNA of this gene (clone ID: LEFL2003DB10) in Micro-Tom. Gene expression analysis was performed using leaf tissues, in which expression of flavonoid biosynthesis genes is low in wild-type plants. Expression of genes of 4-coumarate-CoA ligase, cinnamate 4-hydroxylase, cinnamoyl-CoA reductase, chalcone synthase 1, chalcone synthase 2, chalcone isomerase, flavanone 3-hydroxylase 1, and flavonol synthase was higher in ZnF-overexpressing leaves than in control leaves, although PCC values between ZnF and these up-regulated genes were not very high, mainly because of high expression levels in one of the transformant lines (Fig. 4D). On the other hand, the expression of phenylalanine ammonia-lyase, which is not a member of the module, did not change significantly. The expression of flavonoid 3′-hydroxylase genes correlated negatively with overexpression of the ZnF gene. These results demonstrated that the ZnF gene positively regulates the expression of enzymatic genes in the early part of the flavonoid biosynthetic pathway, which is consistent with the coexpression relationship seen in module 64.
Table 3.
Coexpression modules 64
| Module ID | Member probes | SGN unigene | DFCI TC | Description |
|---|---|---|---|---|
| 64 | Les.3649.1.S1_at | TC193015 | Chalcone synthase 2 | |
| Les.3650.1.S1_at | SGN-U316359 | TC193390 | Chalcone synthase 1 | |
| Les.5427.1.S1_at | SGN-U317537 | TC193461 | Malonyl-CoA synthetase | |
| LesAffx.61398.1.S1_at | SGN-U320999 | TC208694 | Expressed protein | |
| LesAffx.63776.1.S1_at | SGN-U316228 | TC195757 | UDP-glucosyl transferase family protein | |
| Les.2633.1.A1_at | SGN-U316228 | TC203484 | UDP-glucosyl transferase family protein | |
| LesAffx.68320.1.S1_at | SGN-U319782 | ES893432 | Chalcone-flavanone isomerase family protein | |
| Les.1968.1.A1_at | SGN-U319782 | TC205850 | Chalcone-flavanone isomerase family protein | |
| Les.3085.1.S1_at | TC200116 | Flavonol synthase | ||
| LesAffx.34276.2.A1_at | TC198877 | Cinnamoyl-CoA reductase | ||
| Les.2278.1.S1_at | SGN-U312401 | TC191763 | Flavanone 3-hydroxylase | |
| LesAffx.34276.1.S1_at | TC198877 | Cinnamoyl CoA reductase | ||
| LesAffx.30397.1.A1_at | TC209623 | Allyl alcohol dehydrogenase | ||
| LesAffx.34276.2.S1_at | TC198877 | Cinnamoyl-CoA reductase | ||
| Les.2294.2.A1_at | SGN-U323178 | TC211502 | Expressed protein (zinc finger protein) | |
| Les.5848.2.S1_at | SGN-U321355 | TC199613 | 4-coumarate–CoA ligase | |
| LesAffx.5010.2.S1_at | SGN-U316789 | TC194689 | Cytochrome b-561 family protein |
Figure 4.

Experimental verification of the coexpression relationship between members of module 64. (A) Expression profiles of 15 member genes (corresponding to 17 probes, see Supplementary data 2). 5W, five week; 3W, three week; MG, mature green; Y, yellow; O, orange; R, red. (B) Sequence of a full-length cDNA corresponding to the probe Les.2294.2.A1_at (LEFL2003DB10, GenBank accession number AK326277). Gray-shaded letters indicate a unigene sequence used to design Les.2294.2.A1_at. Boxed ATG indicates the start codon. Underlined TGA indicates the stop codon. Dotted line indicates cDNA sequence corresponding to zinc finger domain. (C) Flavonoid biosynthesis pathway (left) and coexpression network of module 64 (right, correlation coefficient cutoff at 0.6). ZnF, zinc finger; PAL, phenylalanine ammonia-lyase; C4H, cinnamate 4-hydroxylase; 4CL, 4-coumarate–CoA ligase; CCR, cinnamoyl-CoA reductase; CHS, chalcone synthase; CHI, chalcone isomerase; F3H, flavanone 3-hydroxylase; FLS, flavonol synthase; GT, glycosyltransferase; F3′H, flavonoid 3′-hydroxylase; EP, expressed protein; Cyt B561, cytochrome b-561; AADH, allyl alcohol dehydrogenase; dKae, dihydrokaempferol; dQue, dihydroquercetin; Kae, kaempferol; Que, quercetin. In the network graph, black edges indicate PCC ≥0.8, and grey edges indicate PCC from 0.6 to 0.8. (D) Changes in expression levels of flavonoid biosynthesis genes in module 64. Expression level of each gene is indicated as a relative value to the level in control line. Black and grey bars indicate control lines and ZnF-overexpression lines, respectively. Each of the four grey bars indicates independent ZnF-overexpression plant.
Analysis of intracellular localization demonstrated that the localization of GFP-ZnF fusion protein was the same as that of free GFP protein (Fig. 5). We obtained the same result using ZnF–GFP fusion protein (data not shown). This result suggests that ZnF protein is localized to cytosol, and that ZnF protein is not a canonical transcription factor protein. The RING-finger type zinc finger domain is reportedly involved in protein–protein interaction.30 Thus, it can be hypothesized that the ZnF gene positively regulates the expression of flavonoid biosynthetic genes through interaction with other transcriptional regulator proteins. This example demonstrates the potential of coexpression analysis in inferring functions of unknown regulatory genes that do not belong to transcription factor families.
Figure 5.
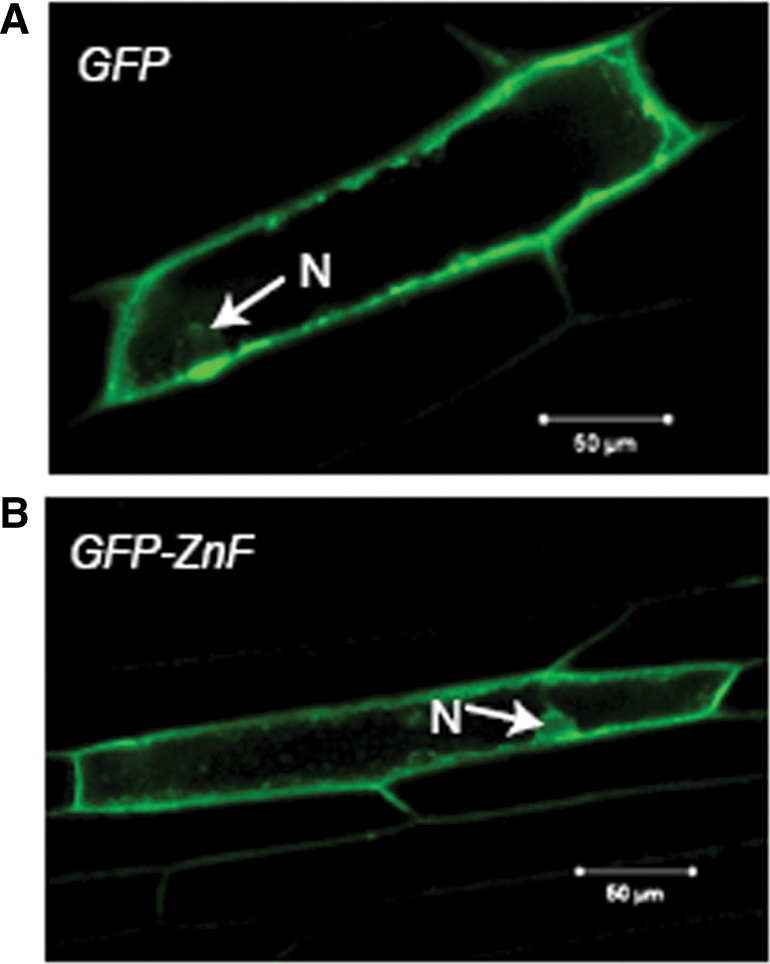
Intracellular localization of (A) GFP protein and (B) GFP-ZnF fusion protein. N, nucleus. Scale bar, 50 µm. Localization pattern of GFP-ZnF is the same as free GFP, suggesting that ZnF protein is localized to cytosol.
3.4. Potential of coexpression analysis in predicting functions of uncharacterized genes
Recently, coexpression analysis was used to predict the function of a transporter gene involved in Arabidopsis glucosinolate biosynthesis.31 The function of this transporter gene, BASS5, was experimentally demonstrated using BASS5 knockout Arabidopsis plants, in which the accumulation of methionine-derived glucosinolates decreased. The results shown in the present study, together with this previous transporter study, suggest that the validity of gene-to-gene coexpression analysis is not limited to genes involved in protein complex formation or transcriptional regulation, but is also applicable to inferring the function of various types of uncharacterized genes. Experimental verification of the functions of several other candidate genes for regulatory protein is in progress.
Supplementary data
Supplementary data are available at www.dnaresearch.oxfordjournals.org.
Funding
This work was partly supported by the Research and Development Program for New Bio-Industry Initiatives, and by a grant from Kazusa DNA Research Institute.
Supplementary Material
Acknowledgements
CaMV35S-sGFP(S65T)-nos3′ plasmid was kindly provided by Dr Yasuo Niwa (University of Shizuoka). We thank Dr Hiroshi Masumoto (Kazusa DNA Research Institute) for the technical advice for confocal laser scanning microscopy. We also thank Tomomi Ishizaki, Tsugumi Isozaki, Miyuki Inde, and Tsurue Aoyama (Kazusa DNA Research Institute) for plant care and lab assistance.
Footnotes
Edited by Satoshi Tabata
References
- 1.Aoki K., Ogata Y., Shibata D. Approaches for extracting practical information from gene co-expression networks in plant biology. Plant Cell Physiol. 2007;48:381–90. doi: 10.1093/pcp/pcm013. [DOI] [PubMed] [Google Scholar]
- 2.Girvan M., Newman M.E. Community structure in social and biological networks. Proc. Natl Acad. Sci. USA. 2002;99:7821–6. doi: 10.1073/pnas.122653799. [DOI] [PMC free article] [PubMed] [Google Scholar]
- 3.Altaf-Ul-Amin M., Shinbo Y., Mihara K., Kurokawa K., Kanaya S. Development and implementation of an algorithm for detection of protein complexes in large interaction networks. BMC Bioinformatics. 2006;7:207. doi: 10.1186/1471-2105-7-207. [DOI] [PMC free article] [PubMed] [Google Scholar]
- 4.Ogata Y., Sakurai N., Suzuki H., Aoki K., Saito K., Shibata D. The prediction of local modular structures in a co-expression network based on gene expression datasets. Genome Inform. 2009;23:117–27. [PubMed] [Google Scholar]
- 5.Craigon D.J., James N., Okyere J., Higgins J., Jotham J., May S. NASCArrays: a repository for microarray data generated by NASC's transcriptomics service. Nucleic Acids Res. 2004;32:D575–7. doi: 10.1093/nar/gkh133. [DOI] [PMC free article] [PubMed] [Google Scholar]
- 6.Edgar R., Domrachev M., Lash A.E. Gene Expression Omnibus: NCBI gene expression and hybridization array data repository. Nucleic Acids Res. 2002;30:207–10. doi: 10.1093/nar/30.1.207. [DOI] [PMC free article] [PubMed] [Google Scholar]
- 7.Sherlock G. Analysis of large-scale gene expression data. Brief Bioinform. 2001;2:350–62. doi: 10.1093/bib/2.4.350. [DOI] [PubMed] [Google Scholar]
- 8.Rocca-Serra P., Brazma A., Parkinson H., et al. ArrayExpress: a public database of gene expression data at EBI. C. R. Biol. 2003;326:1075–8. doi: 10.1016/j.crvi.2003.09.026. [DOI] [PubMed] [Google Scholar]
- 9.Schmid M., Davison T.S., Henz S.R., et al. A gene expression map of Arabidopsis thaliana development. Nat. Genet. 2005;37:501–6. doi: 10.1038/ng1543. [DOI] [PubMed] [Google Scholar]
- 10.Kilian J., Whitehead D., Horak J., et al. The AtGenExpress global stress expression data set: protocols, evaluation and model data analysis of UV-B light, drought and cold stress responses. Plant J. 2007;50:347–63. doi: 10.1111/j.1365-313X.2007.03052.x. [DOI] [PubMed] [Google Scholar]
- 11.Goda H., Sasaki E., Akiyama K., et al. The AtGenExpress hormone and chemical treatment data set: experimental design, data evaluation, model data analysis and data access. Plant J. 2008;55:526–42. doi: 10.1111/j.0960-7412.2008.03510.x. [DOI] [PubMed] [Google Scholar]
- 12.Tohge T., Nishiyama Y., Hirai M.Y., et al. Functional genomics by integrated analysis of metabolome and transcriptome of Arabidopsis plants over-expressing an MYB transcription factor. Plant J. 2005;42:218–35. doi: 10.1111/j.1365-313X.2005.02371.x. [DOI] [PubMed] [Google Scholar]
- 13.Hirai M.Y., Sugiyama K., Sawada Y., et al. Omics-based identification of Arabidopsis Myb transcription factors regulating aliphatic glucosinolate biosynthesis. Proc. Natl Acad. Sci. USA. 2007;104:6478–83. doi: 10.1073/pnas.0611629104. [DOI] [PMC free article] [PubMed] [Google Scholar]
- 14.Yonekura-Sakakibara K., Tohge T., Matsuda F., et al. Comprehensive flavonol profiling and transcriptome coexpression analysis leading to decoding gene-metabolite correlations in Arabidopsis. Plant Cell. 2008;20:2160–76. doi: 10.1105/tpc.108.058040. [DOI] [PMC free article] [PubMed] [Google Scholar]
- 15.Obayashi T., Hayashi S., Saeki M., Ohta H., Kinoshita K. ATTED-II provides coexpressed gene networks for Arabidopsis. Nucleic Acids Res. 2009;37:D987–91. doi: 10.1093/nar/gkn807. [DOI] [PMC free article] [PubMed] [Google Scholar]
- 16.Zimmermann P., Hirsch-Hoffmann M., Hennig L., Gruissem W. GENEVESTIGATOR. Arabidopsis microarray database and analysis toolbox. Plant Physiol. 2004;136:2621–32. doi: 10.1104/pp.104.046367. [DOI] [PMC free article] [PubMed] [Google Scholar]
- 17.Toufighi K., Brady S.M., Austin R., Ly E., Provart N.J. The Botany Array Resource: e-Northerns, Expression Angling, and promoter analyses. Plant J. 2005;43:153–63. doi: 10.1111/j.1365-313X.2005.02437.x. [DOI] [PubMed] [Google Scholar]
- 18.Alba R., Payton P., Fei Z., et al. Transcriptome and selected metabolite analyses reveal multiple points of ethylene control during tomato fruit development. Plant Cell. 2005;17:2954–65. doi: 10.1105/tpc.105.036053. [DOI] [PMC free article] [PubMed] [Google Scholar]
- 19.Carrari F., Baxter C., Usadel B., et al. Integrated analysis of metabolite and transcript levels reveals the metabolic shifts that underlie tomato fruit development and highlight regulatory aspects of metabolic network behavior. Plant Physiol. 2006;142:1380–96. doi: 10.1104/pp.106.088534. [DOI] [PMC free article] [PubMed] [Google Scholar]
- 20.Mintz-Oron S., Mandel T., Rogachev I., et al. Gene expression and metabolism in tomato fruit surface tissues. Plant Physiol. 2008;147:823–51. doi: 10.1104/pp.108.116004. [DOI] [PMC free article] [PubMed] [Google Scholar]
- 21.Lemaire-Chamley M., Petit J., Garcia V., et al. Changes in transcriptional profiles are associated with early fruit tissue specialization in tomato. Plant Physiol. 2005;139:750–69. doi: 10.1104/pp.105.063719. [DOI] [PMC free article] [PubMed] [Google Scholar]
- 22.Iijima Y., Nakamura Y., Ogata Y., et al. Metabolite annotations based on the integration of mass spectral information. Plant J. 2008;54:949–62. doi: 10.1111/j.1365-313X.2008.03434.x. [DOI] [PMC free article] [PubMed] [Google Scholar]
- 23.Chomczynski P., Sacchi N. Single-step method of RNA isolation by acid guanidinium thiocyanate-phenol-chloroform extraction. Anal. Biochem. 1987;162:156–9. doi: 10.1006/abio.1987.9999. [DOI] [PubMed] [Google Scholar]
- 24.Tsugane T., Watanabe M., Yano K., Sakurai N., Suzuki H., Shibata D. Expressed sequence tags of full-length cDNA clones from the miniature tomato (Lycopersicon esculentum) cultivar Micro-Tom. Plant Biotechnol. 2005;22:161–5. [Google Scholar]
- 25.Matsukura C., Aoki K., Fukuda N., et al. Comprehensive resources for tomato functional genomics based on the miniature model tomato micro-tom. Curr. Genomics. 2008;9:436–43. doi: 10.2174/138920208786241225. [DOI] [PMC free article] [PubMed] [Google Scholar]
- 26.Mitsuhara I., Ugaki M., Hirochika H., et al. Efficient promoter cassettes for enhanced expression of foreign genes in dicotyledonous and monocotyledonous plants. Plant Cell Physiol. 1996;37:49–59. doi: 10.1093/oxfordjournals.pcp.a028913. [DOI] [PubMed] [Google Scholar]
- 27.Sun H.J., Uchii S., Watanabe S., Ezura H. A highly efficient transformation protocol for Micro-Tom, a model cultivar for tomato functional genomics. Plant Cell Physiol. 2006;47:426–31. doi: 10.1093/pcp/pci251. [DOI] [PubMed] [Google Scholar]
- 28.Chiu W., Niwa Y., Zeng W., Hirano T., Kobayashi H., Sheen J. Engineered GFP as a vital reporter in plants. Curr. Biol. 1996;6:325–30. doi: 10.1016/s0960-9822(02)00483-9. [DOI] [PubMed] [Google Scholar]
- 29.Quevillon E., Silventoinen V., Pillai S., et al. InterProScan: protein domains identifier. Nucleic Acids Res. 2005;33:W116–20. doi: 10.1093/nar/gki442. [DOI] [PMC free article] [PubMed] [Google Scholar]
- 30.Borden K.L., Freemont P.S. The RING finger domain: a recent example of a sequence-structure family. Curr. Opin. Struct. Biol. 1996;6:395–401. doi: 10.1016/s0959-440x(96)80060-1. [DOI] [PubMed] [Google Scholar]
- 31.Sawada Y., Toyooka K., Kuwahara A., et al. Arabidopsis bile acid: sodium symporter family protein 5 is involved in methionine-derived glucosinolate biosynthesis. Plant Cell Physiol. 2009;50:1579–86. doi: 10.1093/pcp/pcp110. [DOI] [PMC free article] [PubMed] [Google Scholar]
Associated Data
This section collects any data citations, data availability statements, or supplementary materials included in this article.