Abstract
Perilipin A is the most abundant phosphoprotein on adipocyte lipid droplets and is essential for lipid storage and lipolysis. Perilipin null mice exhibit diminished adipose tissue, elevated basal lipolysis, reduced catecholamine-stimulated lipolysis, and increased insulin resistance. To understand the physiological consequences of increased perilipin expression in vivo, we generated transgenic mice that overexpressed either human or mouse perilipin using the adipocyte-specific aP2 promoter/enhancer. Phenotypes of female transgenic and wild-type mice were characterized on chow and high-fat diets (HFDs). When challenged with an HFD, transgenic mice exhibited lower body weight, fat mass, and adipocyte size than wild-type mice. Expression of oxidative genes was increased and lipogenic genes decreased in brown adipose tissue of transgenic mice. Basal and catecholamine-stimulated lipolysis was decreased and glucose tolerance significantly improved in transgenic mice fed a HFD. Perilipin overexpression in adipose tissue protects against HFD-induced adipocyte hypertrophy, obesity, and glucose intolerance. Alterations in brown adipose tissue metabolism may mediate the effects of perilipin overexpression on body fat, although the mechanisms by which perilipin overexpression alters brown adipose tissue metabolism remain to be determined. Our findings demonstrate a novel role for perilipin expression in adipose tissue metabolism and regulation of obesity and its metabolic complications.
Keywords: adipocyte, lipolysis, transgenic mice, lipid oxidation, glucose tolerance, insulin resistance
Obesity is associated with metabolic dysfunction and increased risk for diabetes, cardiovascular disease, cancer, and early mortality (1, 2). In both lean and obese states, triacylglycerol is predominately stored within lipid droplets of adipocytes. Perilipin A (PeriA) is the most abundant phosphoprotein on adipocyte lipid droplets and is an important regulator of lipid storage and release (lipolysis) (3, 4). In the absence of hormonal stimulation (basal state), PeriA functions to inhibit the actions of lipases on stored neutral lipids, thereby maintaining a low rate of constitutive lipolysis (promotes lipid storage) (5–10). Catecholamines enhance adipocyte lipolysis by stimulating adenylate cyclase activity and consequently activating cAMP-dependent protein kinase A (PKA), which simultaneously phosphorylates perilipin and hormone-sensitive lipase (HSL) (3, 11, 12). PKA-dependent phosphorylation of multiple serine residues on perilipin releases CGI-58 from the lipid droplet protein, resulting in enhanced activity of adipose triglyceride lipase (ATGL) (13, 14) and enhanced HSL accessibility to lipid stores (4, 5, 10, 15–17). As a result of these combined actions, lipolysis is dramatically increased.
Perilipin knockout mice have provided important insights into the role of perilipin biology in vivo (7, 8). Perilipin null mice exhibit constitutively activated basal lipolysis and attenuated stimulated lipolysis and are characterized by a marked reduction in fat depots, which comprise small adipocytes. This phenotype occurs despite increased food intake, and the mice have been demonstrated to be resistant to both diet-induced and genetic obesity (7, 8, 18). These mice have increased tissue β-oxidation and increased energy expenditure; however, they develop insulin resistance (8, 18, 19). Therefore, in addition to its role in whole-body energy homeostasis, the regulation of adipocyte lipolysis is vital to metabolic homeostasis.
While we have a significant understanding of the consequences of reduced perilipin protein expression, we have a limited understanding of the in vivo effects of increased perilipin expression. Previous studies in mice and humans (20, 21) have demonstrated that PeriA expression in adipocytes is reduced with obesity. Consistent with this observation, ovariectomy-induced increases in adiposity are associated with a significant reduction in perilipin and increased size of adipocytes (22). Recent studies have investigated human perilipin expression (20, 21, 23). Several groups described the correlations between perilipin expression in adipose tissue or perilipin gene haplotype and gender, obesity, and glucose and lipid metabolism (24–26). To date, almost all published studies investigating the molecular mechanism of perilipin have focused on mouse perilipin (5, 9, 27–29).
Human and mouse periA cDNA possess an open reading frame of 1569 and 1554 nucleotides, encoding 522 and 517 amino acids, respectively. PeriA is by far the most abundant form of perilipin in adipocytes (30). Human perilipin bears 80% amino acid identity to mouse perilipin (30, 31), and both cDNAs have conserved phosphorylation domains important for regulating lipolysis (15, 32), a lipid droplet targeting domain (23, 33), and a PAT (common to several lipid droplet proteins) domain (34). In this article, we demonstrate that expression of human PeriA or mouse PeriA in perilipin null murine adipocytes regulates lipolysis in a similar manner. To understand the physiological consequences of increased PeriA expression in adipocytes and to determine if functional differences exist between mouse and human PeriA in vivo, we generated two lines of mice that overexpressed either human or mouse PeriA in adipose tissue. This study is to our knowledge the first to investigate the effects of PeriA overexpression in vivo. Results demonstrate that both lines of transgenic mice are protected against diet-induced obesity, coincident with increased oxidative gene expression in brown adipose tissue and an improved metabolic phenotype relative to wild-type mice. In general, the effects of the human PeriA transgene were more robust compared with the effects of the mouse PeriA transgene.
MATERIALS AND METHODS
Chemicals and antibodies
Reagents were purchased from Sigma Chemicals (St. Louis, MO). Polyclonal antiperilipin antibody, ATGL antibody, and anti-HSL antibody were generated as previously described (9, 15). Phosphoserine antibody (1:1,000) was purchased from Zymed Laboratories (San Francisco, CA).
Generation of transgenic mice with adipose-specific overexpression of human or mouse perilipin
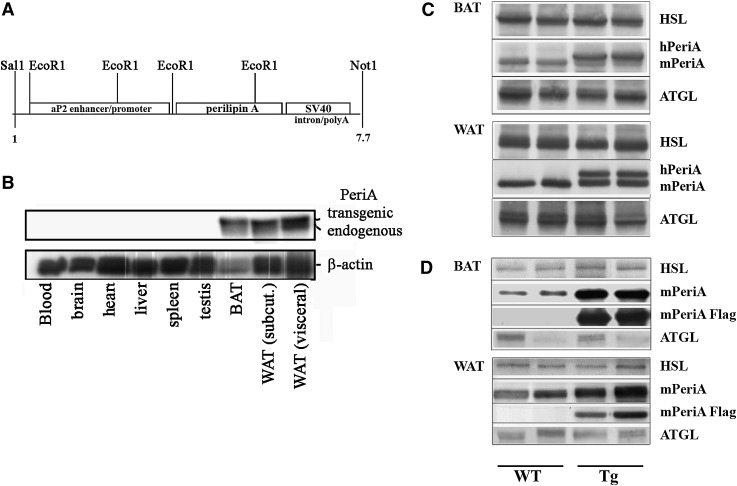
We generated a mouse PeriA cDNA (mPeriA) with a Flag tag at the C terminus using a standard PCR method (28). We obtained the human PeriA cDNA (hPeriA) from Dr. Yusuke Nakamura. These cDNAs were then ligated into a pBluescript SK vector containing the aP2 enhancer/promoter region, the SV40 small tumor antigen splice site, and a polyadenylation signal sequence (provided by Dr. B. M. Spiegelman; Fig. 2A) (35). A 7.7 kb SalI-NotI fragment containing the entire aP2-human PeriA or aP2-mouse PeriA-Flag transgenes was microinjected into fertilized eggs of C57BL/6J mice. Integration of the hPeriA or mPeriA-flag gene in newborn mice was determined by Southern blot analysis. Founder animals were bred with C57BL/6J mice, and two transgenic (Tg) mouse lines were established (hTg or mTg) on the C57BL/6J background. All Tg mice used for the study were hemizygous for the transgene. Littermates that lacked the transgene were used as controls (WT).
Fig. 2.
Characterization of hPeriA and mPeriA transgenic mice. A: Schematic of the the aP2-perilipin A (human) transgene. B: Western blotting of protein lysates from multiple tissues of hPeriA transgenic (hTG) mice using antibodies recognizing perilipin or β-actin. C, D: Western blotting of protein lysates collected from BAT and perigonadal WAT of WT mice and transgenic mice expressing human PeriA (C) or flag-tagged mouse PeriA (D). Blots are probed with antibodies recognizing either PeriA, the Flag epitope, HSL, or ATGL.
Animal experiments
hTg mice were generated at the Institute for Animal Experimentation at Hokkaido University and shipped to the JM-USDA Human Nutrition Research Center on Aging at Tufts, while mTg mice were generated at the Transgenic Core Facility at Tufts University. Mice were housed in a pathogen-free barrier facility at the JM-USDA HNRCA at Tufts in accordance with IACUC guidelines. All mice were housed at room temperature, maintained on a 12 h light/dark cycle, given free access to water, and fed a standard chow diet (ND) (Harlan #7012; Indianapolis, IN). For high-fat diet (HFD) (60% calories from fat; Research Diets #D12492; New Brunswick, NJ) experiments, mice were fed an HFD from the age of 5 weeks to 30 weeks. Food intake and body weight were monitored weekly. On the day prior to tissue harvest at 30 weeks, food was removed at 21:00 h for an overnight fast. Blood, white adipose tissue (WAT) from visceral (perigonadal, perirenal, and mesenteric) and subcutaneous (right side inguinal) depots, and interscapular brown adipose tissue (BAT) were rapidly dissected out, weighed, and processed for subsequent analysis.
Isolated adipocyte lipolysis
Adipocytes were isolated from the perigonadal depot using collagenase and centrifugation as previously described (36) with minor modifications. The samples were gassed (5% CO2 and 95% O2), capped, and incubated at 37°C with shaking until digestion was complete (30–40 min). Adipocytes were aliquoted in triplicate to measure lipolysis under basal (200 nM phenyl isopropyl adenosine) and stimulated (200 nM phenyl isopropyl adenosine + 10 µM isoproterenol) conditions. Lipolytic rate was assessed as glycerol released into the media for 2 h using a Free Glycerol Determination kit (Sigma) (22). Lipolysis was quantified per cell. The number of adipocytes per incubation was determined according to previously published methods (37). Lipid content (mg/ml) was determined by organic extraction of lipids from isolated adipocytes. Adipocytes were visually sized (100–150 adipocytes per mouse) using a light microscope and a 200 µm ocular micrometer. Cell number was then calculated using measures of lipid concentration and adipocyte diameter (37).
Measures of glucose and insulin tolerance
Intraperitoneal glucose tolerance tests (GTTs) and intraperitoneal insulin tolerance tests (ITTs) were performed on nonanesthetized mice that were fasted overnight or for 4 h. The ITT was performed 1 week subsequent to the GTT. For the GTT, blood glucose levels from whole-tail vein blood were measured at baseline and 30, 60, and 120 min following intraperitoneal injection of glucose (1 g/kg body weight) using an automated glucometer. For the ITT, mice received an intraperitoneal injection of human insulin (0.75 mU/kg body weight), and blood glucose was measured at baseline and 15, 30, 45, 60, and 90 min after injection. Glucose area under the curve (AUC0-120 or 0-90) was determined for HFD-fed and ND-fed cohorts and the difference (ΔAUC) reported (38).
Histology
WAT and BAT were dissected, fixed, embedded in paraffin, and sectioned (38). Sections were stained with hematoxylin and eosin. Digital images were acquired with an Olympus DX51 light microscope.
Quantitative PCR
Total RNA was extracted from WAT and BAT using a commercial kit (RNeasy lipid tissue; Qiagen, Valencia, CA). RNA was quantified by RiboGreen Quantitation Assay (Molecular Probes, Eugene, OR), and cDNA was synthesized from 1 µg of total RNA (Reverse Transcription System; Promega, Madison, WI). Real-time PCR was performed in triplicate on an ABI PRISM® 7700 in 20 µl total volume reactions using SYBR® Green PCR Master MIX (Applied Biosystems, Foster City, CA). Primers were designed using Primer Express. Data were analyzed by comparative critical threshold (Ct) method (39) and normalized to an endogenous control gene (18S rRNA). Percentage of difference was calculated by 2−ΔΔCt.
In vitro experiments
Stable lines of mouse embryonic fibroblasts (MEFs) were generated from embryos of Peri−/− mice as described (10, 15, 29, 40). Adenoviruses expressing the constructs Aequoria Victoria green fluorescent protein (GFP), mPeriA, and hPeriA were generated and verified as previously described (28). Recombinant adenovirus was transduced into Peri−/− MEFs with LipofectAMINE PlusTM (Invitrogen, Carlsbad, CA) on day 3 after induction of differentiation. The amount of each adenovirus used was selected to assure comparable levels of expression of the different PeriA constructs, which was confirmed by densitometry on Western blots (10, 15, 40). Functional similarity of mPeriA and hPeriA was demonstrated via lipolysis experiments in Peri−/− MEFs transduced with adenovirus. Glycerol and fatty acid release were measured after 2 h of treatment with/without the PKA activator forskolin (20 µM) and normalized for total protein as described (10, 15, 28, 40).
Statistical analysis
Data were analyzed using a Student's t-test, and significance was set a P < 0.05. Results are presented as mean values ± SEM.
RESULTS
Lipolytic regulation is similar between hPeriA and mPeriA when expressed in Peri−/− MEF adipocytes
In order to demonstrate the functional similarity between hPeriA and mPeriA, we performed studies in perilipin null MEF adipocytes, which exhibit phenotypic hallmarks of adipocytes but do not express perilipin (10, 15, 29, 40, 41). We used adenoviruses to express hPeriA, mPeriA, or GFP (as a control) in the Peri−/− MEFs beginning on day 3 after induction of differentiation. The expression levels of mPeriA or hPeriA in the Peri−/− MEFs were comparable as assessed by Western blot (Fig. 1) and were also comparable to that in control adipocytes derived from Peri+/+ (WT) MEFs. Importantly, attenuation of basal lipolysis and facilitation of PKA-stimulated lipolysis were comparable in MEF adipocytes expressing either mPeriA or hPeriA (Fig. 1). These data indicate that in the absence of endogenous PeriA, mPeriA and hPeriA are functional equivalents.
Fig. 1.
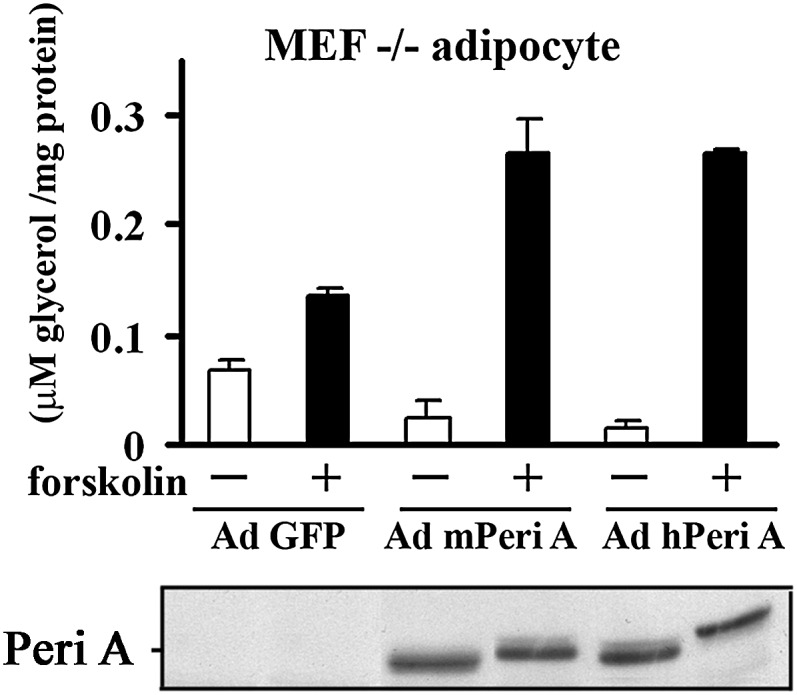
Lipolytic effects in the absence or presence of mPeriA or hPeriA in PeriA−/− MEF adipocytes. Adenovirus (Ad)-expressing mPeriA, hPeriA, or GFP (control) was transduced in murine embryonic fibroblasts of perilipin null mice at 3 days after differentiation. Glycerol release for 2 h was measured in the absence or presence of the PKA activator, forskolin, 7–9 days after differentiation. Data (mean ± SEM) are from three separate experiments performed in at least duplicate. Bottom panel of immunoblotting with antiperilipin IgG shows comparable levels of adenovirally expressed proteins in a representative experiment.
Adipose-specific overexpression of hPeriA and mPeriA in transgenic mice
In order to investigate the effects of perilipin overexpression in vivo, the murine aP2 promoter was used to generate two separate lines of PeriA transgenic mice, one expressing hPeriA (hTg mice) and another expressing mPeriA with a flag tag at its C terminus (mTg mice) (see Fig. 2A for schematic). Expression of both hPeriA and mPeriA (data not shown) was limited to WAT and BAT (Fig. 2B). Consistent with our prior studies of endogenous hPeriA (42), overexpressed hPeriA migrated as a higher band on Western blots compared with endogenous mouse PeriA (Fig. 2C). Relative to WT littermates, PeriA protein levels were increased 2-fold in intra-abdominal (perigonadal) WAT and ∼5-fold in BAT of both hTg and mTg mice (Fig. 2C, D). The protein expression of other adipocyte proteins involved in lipolysis (e.g., HSL and ATGL) was not altered in either hTg or mTg mice (Fig. 2C, D). In summary, we generated lines of transgenic mice overexpressing hPeriA or murine PeriA specifically in adipose tissue.
Attenuated weight gain in Tg mice fed HFD
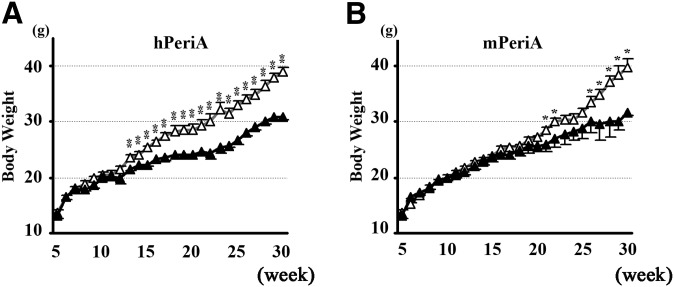
Body weight gain of female hTg and mTg mice was similar to WT controls when fed a normal chow diet (ND) (data not shown). In contrast, when female mice were fed a HFD, both hTg and mTg mice gained weight less rapidly than their WT littermates (Fig. 3A, B). Male hTg mice had a very small but significant reduction in body weight gain when fed a HFD compared with WT littermates, whereas mTg did not differ from WT in their weight gain on an HFD. Since both female hTg and mTg mice demonstrated a more robust phenotype compared with male transgenic mice, the data presented throughout this manuscript focused only on female mice. At 30 weeks of age (25 weeks of HFD), both hTg and mTg mice weighed ∼20% less than WT controls (Fig. 3A, B). The observed difference in body weight became significant after the animals reached 13 (hTg) and 22 (mTg) weeks of age, respectively. Regardless of diet, food intake was similar between Tg and WT mice and was not a contributing factor to the observed differences in body weight on the HFD (WT 2.28 ± 0.16g vs. 2.09 ± 0.09g, P = 0.55). In spite of their similar food consumption level, fasting serum leptin concentration was significantly lower in HFD-fed hTg mice compared with WT mice (9.83 ± 3.57 vs. 32.85 ± 0.02 ng/ml) (P = 0.003), which is probably explained by smaller adipocyte in hTg mice.
Fig. 3.
Effect of PeriA overexpression on HFD-induced weight gain. Weekly weight gain in Tg mice expressing hPeriA (A) or mPeriA (B) and WT littermates fed an HFD for 25 weeks (open triangle, WT; closed triangle, Tg). n > 7 per genotype; results are mean ± SEM. * P < 0.05; ** P < 0.01.
Lower adipose depot weight and smaller adipocyte size in Tg mice
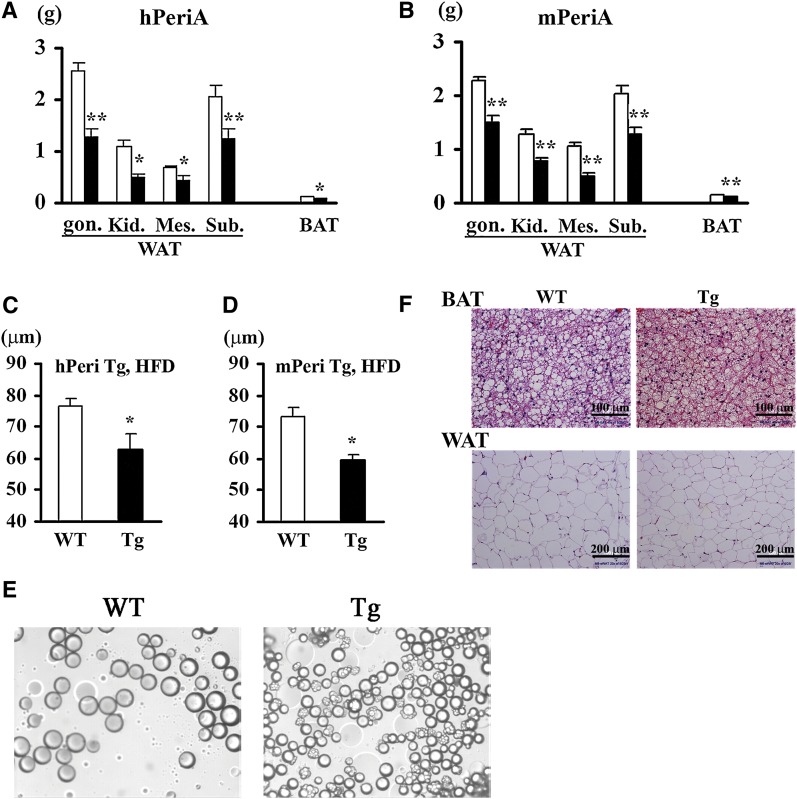
When mice were fed the ND, small but significant reductions in the weights of multiple adipose tissue depots were observed in hTg mice (but not in mTg mice) relative to WT mice (data not shown). Consistent with these observations, adipocytes isolated from the perigonadal depot of hTg mice were significantly smaller than adipocytes from WT mice (45.9 ± 4.7 μm vs. 57.9 ± 1.9 μm) (P = 0.046) (Fig. 4E) but only tended to be smaller in mTg mice. In contrast, when mice were challenged with an HFD, adipose depot weights in both Tg lines were dramatically reduced compared with WT mice (Fig. 4A, B), thus accounting, at least in part, for the relatively lower whole body weight (Fig. 3A, B). Consistent with relatively reduced adipose depot mass in Tg mice fed an HFD, perigonadal adipocytes were significantly smaller in both hTg and mTg mice (Fig. 4C, D). In addition to these effects of transgene expression in WAT, both adipocyte and lipid droplet size was significantly smaller in BAT of Tg mice compared with WT mice (Fig. 4F).
Fig. 4.
Effect of PeriA overexpression on fat pad weight and adipocyte size. Adipose depot weights of hPeriA Tg (A) or mPeriA Tg (B) and their respective WT littermates fed an HFD for 25 weeks (open bar, WT; closed bar, Tg). Adipocyte size of hPeriA Tg (C) or mPeriA Tg (D) and their respective WT littermates fed an HFD for 25 weeks (open bar, WT; closed bar, Tg). n > 5 per genotype; results are mean ± SEM. * P < 0.05; ** P < 0.01. Gon., perigonadal; Kid., perirenal; Mes., mesenteric; Sub., subcutaneous. E: Representative micrograph of isolated adipocytes from perigonadal WAT of hPeriA Tg and WT. F: Representative adipose tissue histology of BAT (top panel) and WAT (bottom panel) of hPeriA Tg and WT fed a normal chow diet.
Oxidative and lipogenic gene expression is altered in the adipose tissue of Tg mice
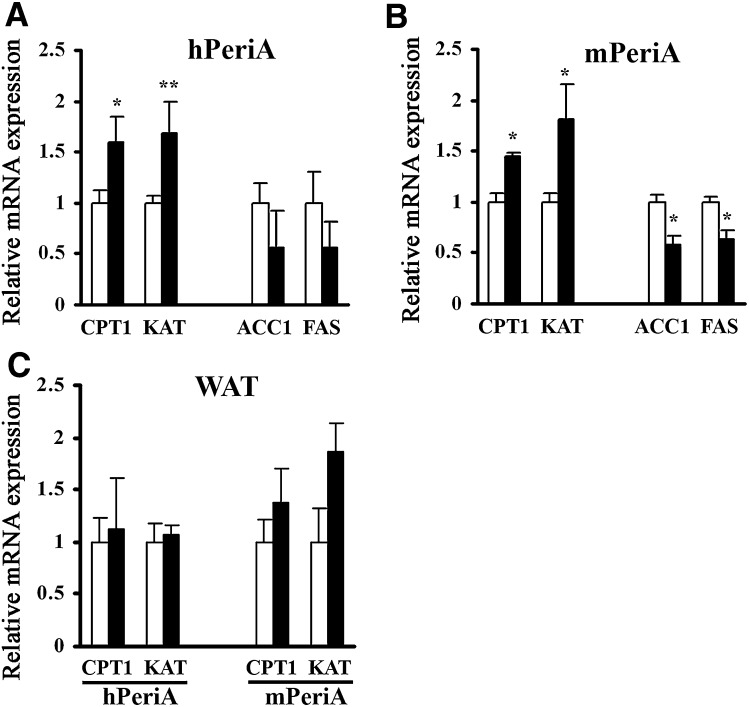
We next employed real-time PCR to investigate molecular mechanism(s) by which overexpressing PeriA decreases adipocyte size and adipose tissue mass, focusing on genes involved in β-oxidation and lipogenesis. We observed significant increases in the expression of the oxidative genes carnitine palmitoyltransferase 1 and 3-ketoacyl-CoA thiolase B in BAT of both lines of Tg mice (Fig. 5A, B). Similar tendencies were observed in WAT, but these changes in gene expression were not significant (Fig. 5C). Consistent with decreased adipocyte size, the lipogenic genes acetyl-CoA carboxylase-1 and FAS were significantly downregulated in BAT of mTg mice and tended to be reduced in hTg mice as well (Fig. 5A, B). With regard to energy metabolism, we measured whole-body oxygen consumption rate (VO2) during a 12 h dark/12 h light cycle in 30 week old female mice fed a HFD. The average values for the 24 h period of oxygen consumption was significantly increased in hTg mice maintained on an HFD compared with the corresponding values for WT mice (0.41 ± 0.03 vs. 0.30 ± 0.02 l/h/kg weight, P = 0.026).
Fig. 5.
Effect of PeriA overexpression on adipose tissue mRNA transcripts involved in β-oxidation and lipogenesis. Overnight fasted hPeriA Tg (A, C) or mPeriA Tg (B, C) and their respective WT littermates fed an HFD for 25 weeks (open bar, WT; closed bar, Tg). mRNA expression was quantified by real-time PCR of BAT (A, B) and WAT (C). Target gene expression was normalized to 18S rRNA. n > 5 per genotype; results are mean ± SEM. * P < 0.05; ** P < 0.01. CPT1, carnitine palmitoyltransferase 1; KAT, 3-ketoacyl-CoA thiolase B; ACC-1, acetyl-CoA carboxylase-1.
Improved glucose/insulin homeostasis in hTg mice fed an HFD
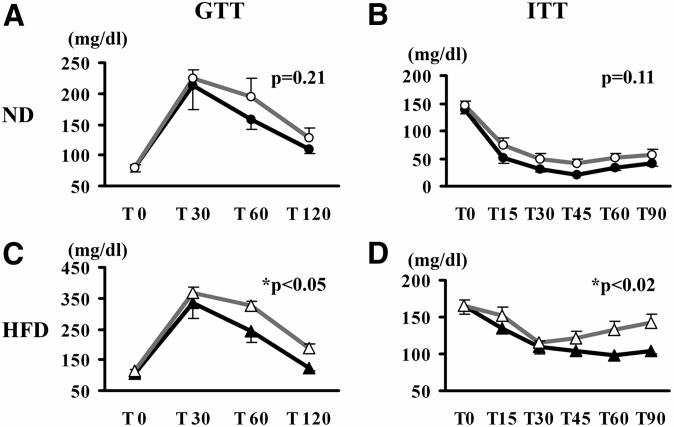
Glucose homeostasis was assessed in hTg and WT mice by GTT and ITT. When maintained on the ND, hTg and WT mice responded similarly to glucose and insulin challenges, manifest as comparable calculated AUCs for the two genotypes (Fig. 6A, B). However, when mice were fed an HFD, AUC for both GTT and ITT were significantly lower in hTg mice compared with WT mice (Fig. 6C, D). Consistent with these data, fasting serum insulin concentration, a surrogate marker of insulin sensitivity, was also significantly lower in HFD-fed hTg mice compared with WT mice (0.30 ± 0.07 vs. 0.58 ± 0.10 ng/ml; P = 0.043). Together, these data indicate that hTg mice were resistant to HFD-induced glucose intolerance and insulin resistance.
Fig. 6.
Effect of PeriA overexpression on glucose homeostasis. hPeriA Tg and their WT littermates fed a chow diet (ND; A, B) or HFD (C, D) were given an intraperitoneal injection of glucose (1 mg/g of body weight; A, C) or insulin (0.75 U/kg of body weight, humulin regular insulin; B, D) (open triangle, WT; closed triangle, Tg). Mean AUC was calculated for each genotype. n > 5 per genotype; results are mean ± SE. * P < 0.05.
Attenuated catecholamine-stimulated lipolysis in Tg mice
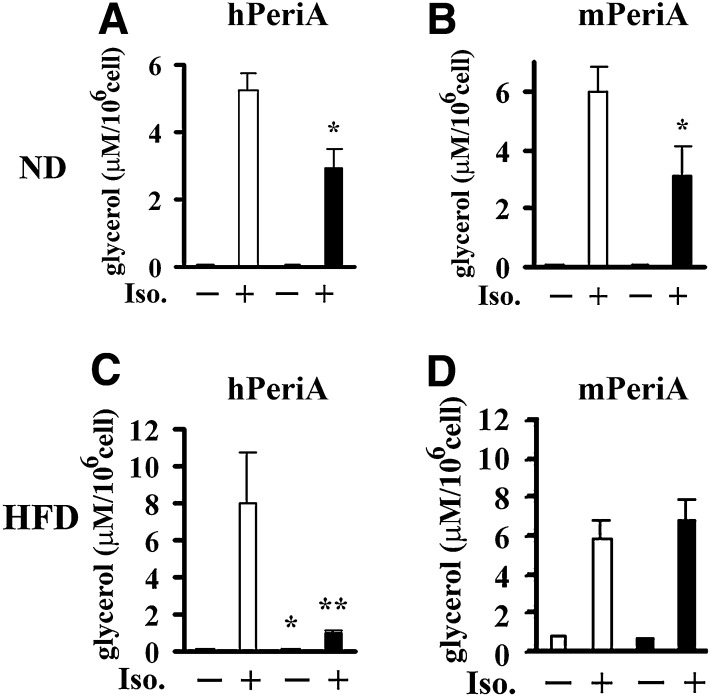
Ex vivo lipolysis studies were performed with isolated adipocytes from perigonadal adipose tissue. The nonselective β-adrenergic agonist, isoproterenol, was used to stimulate lipolysis. When mice were maintained on chow diet, ex vivo basal lipolysis was similar in isolated adipocytes from hTg, mTg, and their respective WT mice, but stimulated lipolysis was significantly attenuated in isolated adipocytes from both hTg and mTg (Fig. 7A, B). When mice were challenged by an HFD, both basal and stimulated lipolysis were reduced in isolated adipocytes from hTg mice compared with WT controls (Fig. 7C). However, basal and stimulated lipolysis was not attenuated in isolated adipocytes from mTg mice (Fig. 7D). In summary, catecholamine stimulated lipolysis in adipocytes from both lines of ND-fed transgenic animals was reduced. However, in response to HFD, only adipocytes from the hTg exhibited reduced stimulated lipolysis.
Fig. 7.
Effect of PeriA overexpression on ex vivo and in vivo lipolysis. Lipolysis was measured in isolated adipocytes of hPeriA Tg (A, C) or mPeriA Tg (B, D) mice and their respective WT littermates fed a chow diet (ND) or HFD for 25 weeks (open bar, WT; closed bar, Tg). Glycerol release in the absence or presence of 10 μM isoproterenol (Iso) was measured and adjusted per cell number. n > 5 per genotype; results are means ± SE. * P < 0.05; ** P < 0.01.
DISCUSSION
PeriA localizes exclusively to the surface of lipid droplets and regulates lipid storage in adipose tissue (3, 27, 43). PeriA has dual roles that are regulated by phosphorylation state. PeriA acts as a barrier between stored neutral lipid and lipases in the unphosphorylated (basal) state and as an enhancer of lipolysis in the phosphorylated (PKA-stimulated) state (4, 7, 8, 10, 44). Both human and animal studies suggest associations between perilipin expression and adiposity, lipid metabolism, and glucose homeostasis (20–23). Moreover, perilipin null mice exhibit altered lipolysis and energy metabolism and are protected from diet-induced obesity (7, 8). In this study, we generated two strains of transgenic mice in which mPeriA or hPeriA was overexpressed specifically in adipose tissue to elucidate for the first time the metabolic and physiological consequences of PeriA overexpression.
PeriA Tg mice and WT littermates were assessed on both a chow diet and when challenged by an HFD for 25 weeks. When fed a chow diet, Tg and WT mice attained similar body weights, although we observed modest attenuation of adipose depot weights in hTg mice. However, when challenged with an HFD, both lines of Tg mice had substantially lower body weight, adipocyte size, and adipose mass compared with WT littermates. Gene expression data suggest that one mechanism underlying the resistance to HFD-induced obesity in PeriA Tg mice is an upregulation of oxidative genes in BAT (and to a lesser in WAT). Based on prior studies, enhanced oxidative capacity in BAT is predicted to decrease the susceptibility to diet-induced obesity, as brown fat has been demonstrated to regulate obesity susceptibility in mice (45). Consistent with a leaner phenotype, HFD-fed hTg mice exhibited improved glucose tolerance and insulin sensitivity than WT littermates. Elevated β-oxidation and/or the secretion of a more beneficial profile of adipokines from smaller adipocytes (46–48) may contribute to the salutory effects of PeriA overexpression on glucose homeostasis. How perilipin overexpression increased oxidative gene expression in BAT is unclear. The underlying mechanism by which perilipin overexpression in BAT increases oxidative gene expression is currently under study in our laboratory.
Studies from multiple laboratories have demonstrated that perilipin is critical in the regulation of basal and catecholamine-stimulated lipolysis. In both lines of ND-fed Tg mice, overexpression of perilipin reduced catecholamine-stimulated lipolysis. Preliminary studies from our laboratory using 3T3-L1 adipocytes indicate that in vitro overexpression of either mPeriA or hPeriA renders cAMP limiting for PeriA hyperphosphorylation, thereby constraining the magnitude of stimulated lipolysis (data not shown). However, after the HFD challenge, only hTg mice had reduced catecholamine stimulated lipolysis compared with WT (Fig. 7). Notwithstanding this intriguing difference, it is currently unclear if and how the inhibitory effect of PeriA overexpression in WAT contributes to the lean and metabolically protected phenotype observed during HFD challenge.
As mentioned previously, the phenotype of reduced body weight and adiposity and improved glucose tolerance was more apparent in the female mice from both transgenic lines (data not shown). It has been reported by several groups that PeriA protein levels were significantly higher in adipose tissue of men than women (20, 21). In addition, other groups have reported that a perilipin gene haplotype was a significant genetic determinant for obesity risk and concluded that women are more sensitive to the genetic effects of perilipin than men (24). Interestingly, we previously demonstrated that perilipin expression is greater in ovariectomized mice treated with estrogen, and this is associated with smaller adipocytes and reduced WAT adipose tissue mass, a phenotype observed in our PeriA Tg mice (22).
In general, it appears that expression of the hPeriA transgene resulted in a more robust phenotype compared with expression of the mPeriA transgene. The explanation for the differences between the two lines of mice is unclear but may reflect the small difference in amino acid sequence between hPeriA and endogenous mouse PeriA (30, 31). Further studies are required to determine the precise mechanism and organ networks involved in this effect.
Acknowledgments
The authors thank research technicians Miki Ishida and Megumi Masuyama for technical support, Janis Lem and Kirby Johnson at the Transgenic Core Facility at Tufts for their excellence in generating mTG mice, and Tsutomu Osanai at the Institute for Animal Experimentation, Hokkaido University Graduate School of Medicine for his education of mice procedures.
Footnotes
Abbreviations:
- ATGL
- adipose triacylglycerol lipase
- AUC
- area under the curve
- BAT
- brown adipose tissue
- GFP
- green fluorescent protein
- GTT
- intraperitoneal glucose tolerance test
- HFD
- high-fat diet
- hPeriA
- human perilipin A
- HSL
- hormone-sensitive lipase
- ITT
- intraperitoneal insulin tolerance test
- mPeriA
- mouse perilipin A
- ND
- normal chow diet
- PeriA
- perilipin A
- PKA
- protein kinase A
- Tg
- transgenic
- WAT
- white adipose tissue
- WT
- wild type
This work was supported by the National Institutes of Health Grant DK-50647 and USDA-Agricultural Research Service Cooperative Agreement 58 1950-4-401 (A.S.G.), by NIH AG024635, NIH P30 DK-34928 Center for Digestive Disease Research, and 1-06-RA-96 from the American Diabetes Association (M.S.O.), and by the Japanese Ministry of Education, Culture, Sports, Science, and Technology Foundation #19591029, Takeda Science Foundation, Kanae Foundation for the Promotion of Medical Science, and Kissei Pharmaceutical Foundation (H.M.). Its contents are solely the responsibility of the authors and do not necessarily represent the official views of the National Institutes of Health or other granting agencies.
REFERENCES
- 1.Reaven G. 2002. Metabolic syndrome: pathophysiology and implications for management of cardiovascular disease. Circulation. 106: 286–288. [DOI] [PubMed] [Google Scholar]
- 2.Hjartaker A., Langseth H., Weiderpass E. 2008. Obesity and diabetes epidemics: cancer repercussions. Adv. Exp. Med. Biol. 630: 72–93. [DOI] [PubMed] [Google Scholar]
- 3.Greenberg A. S., Egan J. J., Wek S. A., Garty N. B., Blanchette-Mackie E. J., Londos C. 1991. Perilipin, a major hormonally regulated adipocyte-specific phosphoprotein associated with the periphery of lipid storage droplets. J. Biol. Chem. 266: 11341–11346. [PubMed] [Google Scholar]
- 4.Londos C., Sztalryd C., Tansey J. T., Kimmel A. R. 2005. Role of PAT proteins in lipid metabolism. Biochimie. 87: 45–49. [DOI] [PubMed] [Google Scholar]
- 5.Brasaemle D. L., Rubin B., Harten I., Gruia-Gray J., Kimmel A., Londos C. 2000. Perilipin A increases triacylglycerol storage by decreasing the rate of triacylglycerol hydrolysis. J. Biol. Chem. 275: 38486–38493. [DOI] [PubMed] [Google Scholar]
- 6.Souza S. C., Moitoso de Vargas L., Yamamato M., Line P., Franciosa M., Moss L., Greenberg A. 1998. Overexpression of perilipin A and B blocks the ability of tumor necrosis factor to increase adipocyte lipolysis in 3T3-L1 adipocytes. J. Biol. Chem. 273: 24665–24669. [DOI] [PubMed] [Google Scholar]
- 7.Martinez-Botas J., Andreson J., Tessler D., Lapillojnne A., Hung-Junn Chang B., Quast M., Gorenstein D., Chen K-H., Chan L. 2000. Absence of perilipin results in leanness and reverses obesity in Leprdb/db mice. Nat. Genet. 26: 474–479. [DOI] [PubMed] [Google Scholar]
- 8.Tansey J. T., Sztalryd C., Gruia-Gray J., Roush D., Zeo J., Gavrilova O., Reitman M., Deng C-X., Ki C., Kimmel A., et al. 2001. Perilipin ablation results in a lean mouse with aberrant adipocyte lipolysis, enhanced leptin production, and resistance to diet-induced obesity. Proc. Natl. Acad. Sci. USA. 98: 6494–6499. [DOI] [PMC free article] [PubMed] [Google Scholar]
- 9.Souza S. C., Muliro K., Liscum L., Lien P., Yamamoto Y., Schaffer J., Dallal G., Wang X., Kraemer F., Obin M., et al. 2002. Modulation of hormone-sensitive lipase and protein kinase-A-mediated lipolysis by perilipin A in an adenoviral reconstituted system. J. Biol. Chem. 277: 8267–8272. [DOI] [PubMed] [Google Scholar]
- 10.Miyoshi H., Souza S. C., Zhang H. H., Strissel K. J., Christoffolete M. A., Kovsan J., Rudich A., Kraemer F. B., Bianco A. C., Obin M. S., et al. 2006. Perilipin promotes hormone-sensitive lipase-mediated adipocyte lipolysis via phosphorylation-dependent and -independent mechanisms. J. Biol. Chem. 281: 15837–15844. [DOI] [PubMed] [Google Scholar]
- 11.Belfrage P., Fredrikson G., Olsson H., Stralfors P. 1982. Hormonal regulation of adipose tissue lipolysis by reversible phosphorylation of hormone-sensitive lipase. Prog. Clin. Biol. Res. 102(Pt C): 213–223. [PubMed] [Google Scholar]
- 12.Egan J. J., Greenberg A. S., Chang M. K., Wek S. A., Moos M. C., Jr., Londos C. 1992. Mechanism of hormone-stimulated lipolysis in adipocytes: translocation of hormone-sensitive lipase to the lipid storage droplet. Proc. Natl. Acad. Sci. USA. 89: 8537–8541. [DOI] [PMC free article] [PubMed] [Google Scholar]
- 13.Lass A., Zimmermann R., Haemmerle G., Riederer M., Schoiswohl G., Schweiger M., Kienesberger P., Strauss J. G., Gorkiewicz G., Zechner R. 2006. Adipose triglyceride lipase-mediated lipolysis of cellular fat stores is activated by CGI-58 and defective in Chanarin-Dorfman Syndrome. Cell Metab. 3: 309–319. [DOI] [PubMed] [Google Scholar]
- 14.Schweiger M., Schreiber R., Haemmerle G., Lass A., Fledelius C., Jacobsen P., Tornqvist H., Zechner R., Zimmermann R. 2006. Adipose triglyceride lipase and hormone-sensitive lipase are the major enzymes in adipose tissue triacylglycerol catabolism. J. Biol. Chem. 281: 40236–40241. [DOI] [PubMed] [Google Scholar]
- 15.Miyoshi H., Perfield J. W., 2nd, Souza S. C., Shen W. J., Zhang H. H., Stancheva Z. S., Kraemer F. B., Obin M. S., Greenberg A. S. 2007. Control of adipose triglyceride lipase action by serine 517 of perilipin A globally regulates protein kinase A-stimulated lipolysis in adipocytes. J. Biol. Chem. 282: 996–1002. [DOI] [PubMed] [Google Scholar]
- 16.Granneman J. G., Moore H. P. 2008. Location, location: protein trafficking and lipolysis in adipocytes. Trends Endocrinol. Metab. 19: 3–9. [DOI] [PubMed] [Google Scholar]
- 17.Sztalryd C., Xu G., Dorward H., Tansey J., Contreras J., Kimmel A., Londos C. 2003. Perilipin A is essential for the translocation of hormone-sensitive lipase during lipolytic activation. J. Cell Biol. 161: 1093–1103. [DOI] [PMC free article] [PubMed] [Google Scholar]
- 18.Saha P. K., Kojima H., Martinez-Botas J., Sunehag A. L., Chan L. 2004. Metabolic adaptations in the absence of perilipin: increased beta-oxidation and decreased hepatic glucose production associated with peripheral insulin resistance but normal glucose tolerance in perilipin-null mice. J. Biol. Chem. 279: 35150–35158. [DOI] [PubMed] [Google Scholar]
- 19.Arner P. 2005. Human fat cell lipolysis: biochemistry, regulation and clinical role. Best Pract. Res. Clin. Endocrinol. Metab. 19: 471–482. [DOI] [PubMed] [Google Scholar]
- 20.Wang Y., Sullivan S., Trujillo M., Lee M. J., Schneider S. H., Brolin R. E., Kang Y. H., Werber Y., Greenberg A. S., Fried S. K. 2003. Perilipin expression in human adipose tissues: effects of severe obesity, gender, and depot. Obes. Res. 11: 930–936. [DOI] [PubMed] [Google Scholar]
- 21.Mottagui-Tabar S., Ryden M., Lofgren P., Faulds G., Hoffstedt J., Brookes A. J., Andersson I., Arner P. 2003. Evidence for an important role of perilipin in the regulation of human adipocyte lipolysis. Diabetologia. 46: 789–797. [DOI] [PubMed] [Google Scholar]
- 22.D'Eon T. M., Souza S. C., Aronovitz M., Obin M. S., Fried S. K., Greenberg A. S. 2005. Estrogen regulation of adiposity and fuel partitioning. Evidence of genomic and non-genomic regulation of lipogenic and oxidative pathways. J. Biol. Chem. 280: 35983–35991. [DOI] [PubMed] [Google Scholar]
- 23.Puri V., Ranjit S., Konda S., Nicoloro S. M., Straubhaar J., Chawla A., Chouinard M., Lin C., Burkart A., Corvera S., et al. 2008. Cidea is associated with lipid droplets and insulin sensitivity in humans. Proc. Natl. Acad. Sci. USA. 105: 7833–7838. [DOI] [PMC free article] [PubMed] [Google Scholar]
- 24.Qi L., Shen H., Larson I., Schaefer E. J., Greenberg A. S., Tregouet D. A., Corella D., Ordovas J. M. 2004. Gender-specific association of a perilipin gene haplotype with obesity risk in a white population. Obes. Res. 12: 1758–1765. [DOI] [PubMed] [Google Scholar]
- 25.Corella D., Qi L., Tai E. S., Deurenberg-Yap M., Tan C. E., Chew S. K., Ordovas J. M. 2006. Perilipin gene variation determines higher susceptibility to insulin resistance in Asian women when consuming a high-saturated fat, low-carbohydrate diet. Diabetes Care. 29: 1313–1319. [DOI] [PubMed] [Google Scholar]
- 26.Deram S., Nicolau C. Y., Perez-Martinez P., Guazzelli I., Halpern A., Wajchenberg B. L., Ordovas J. M., Villares S. M. 2008. Effects of perilipin (PLIN) gene variation on metabolic syndrome risk and weight loss in obese children and adolescents. J. Clin. Endocrinol. Metab. 93: 4933–4940. [DOI] [PMC free article] [PubMed] [Google Scholar]
- 27.Granneman J. G., Moore H. P., Granneman R. L., Greenberg A. S., Obin M. S., Zhu Z. 2007. Analysis of lipolytic protein trafficking and interactions in adipocytes. J. Biol. Chem. 282: 5726–5735. [DOI] [PubMed] [Google Scholar]
- 28.Zhang H., Souza S., Muliro K., Kraemer F., Obin M., Greenberg A. S. 2003. Lipase-selective functional domains of perililpin A differentially regulate constitutive and protein kinase A-stimulated lipolysis. J. Biol. Chem. 278: 51535–51542. [DOI] [PubMed] [Google Scholar]
- 29.Miyoshi H., Perfield J. W., 2nd, Obin M. S., Greenberg A. S. 2008. Adipose triglyceride lipase regulates basal lipolysis and lipid droplet size in adipocytes. J. Cell. Biochem. 105: 1430–1436. [DOI] [PMC free article] [PubMed] [Google Scholar]
- 30.Greenberg A. S., Egan J. J., Wek S. A., Moos M. C., Jr., Londos C., Kimmel A. R. 1993. Isolation of cDNAs for perilipins A and B: sequence and expression of lipid droplet-associated proteins of adipocytes. Proc. Natl. Acad. Sci. USA. 90: 12035–12039. [DOI] [PMC free article] [PubMed] [Google Scholar]
- 31.Nishiu J., Tanaka T., Nakamura Y. 1998. Isolation and chromosomal mapping of the human homolog of perilipin, a rat adipose tissue-specific gene, by differential display method. Genomics. 48: 254–257. [DOI] [PubMed] [Google Scholar]
- 32.Marcinkiewicz A., Gauthier D., Garcia A., Brasaemie D. L. 2006. The phosphorylation of serine 492 of perilipin A directs lipid droplet fragmentation and dispersion. J. Biol. Chem. 281: 11901–11909. [DOI] [PubMed] [Google Scholar]
- 33.Subramanian V., Garcia A., Sekowski A., Brasaemle D. L. 2004. Hydrophobic sequences target and anchor perilipin A to lipid droplets. J. Lipid Res. 45: 1983–1991. [DOI] [PubMed] [Google Scholar]
- 34.Miura S., Gan J. W., Brzostowski J., Parisi M. J., Schultz C. J., Londos C., Oliver B., Kimmel A. R. 2002. Functional conservation for lipid storage droplet association among Perilipin, ADRP, and TIP47 (PAT)-related proteins in mammals, Drosophila, and Dictyostelium. J. Biol. Chem. 277: 32253–32257. [DOI] [PubMed] [Google Scholar]
- 35.Soloveva V., Graves R. A., Rasenick M. M., Spiegelman B. M., Ross S. R. 1997. Transgenic mice overexpressing the beta 1-adrenergic receptor in adipose tissue are resistant to obesity. Mol. Endocrinol. 11: 27–38. [DOI] [PubMed] [Google Scholar]
- 36.Honnor R. C., Dhillon G. S., Londos D. 1985. cAMP-dependent protein kinase and lipolysis in rat adipocytes I. Cell preparation, manipulation, and predictability in behavior. J. Biol. Chem. 260: 15122–15129. [PubMed] [Google Scholar]
- 37.Di Girolamo M., Mendlinger S., Fertig J. 1971. A simple method to determine fat cell size and number in four mammalian species. Am. J. Physiol. 221: 850–858. [DOI] [PubMed] [Google Scholar]
- 38.Strissel K. J., Stancheva Z., Miyoshi H., Perfield J. W., II, DeFuria J., Jick Z., Greenberg A. S., Obin M. S. 2007. Adipocyte death, adipose tissue remodeling, and obesity complications. Diabetes. 56: 2910–2918. [DOI] [PubMed] [Google Scholar]
- 39.Livak K. J., Schmittgen T. D. 2001. Analysis of relative gene expression data using real-time quantitative PCR and the 2(-Delta Delta C(T)) Method. Methods. 25: 402–408. [DOI] [PubMed] [Google Scholar]
- 40.Gauthier M. S., Miyoshi H., Souza S. C., Cacicedo J. M., Saha A. K., Greenberg A. S., Ruderman N. B. 2008. AMP-activated protein kinase is activated as a consequence of lipolysis in the adipocyte: potential mechanism and physiological relevance. J. Biol. Chem. 283: 16514–16524. [DOI] [PMC free article] [PubMed] [Google Scholar]
- 41.Gross D. N., Miyoshi H., Hosaka T., Zhang H. H., Pino E. C., Souza S., Obin M., Greenberg A. S., Pilch P. F. 2006. Dynamics of lipid droplet-associated proteins during hormonally stimulated lipolysis in engineered adipocytes: stabilization and lipid droplet binding of adipocyte differentiation-related protein/adipophilin. Mol. Endocrinol. 20: 459–466. [DOI] [PubMed] [Google Scholar]
- 42.Zhang H. H., Halbleib M., Ahmed F., Manganiello V., Greenberg A. 2002. Tumor necrosis factor-alpha stimulates lipolysis in differentiated human adipocytes through activation of extracellular signal related kinase and elevated extracelular related kinase and elevation of intracellular cAMP. Diabetes. 51: 2929–2935. [DOI] [PubMed] [Google Scholar]
- 43.Brasaemle D. L., Dolios G., Shapiro L., Wang R. 2004. Proteomic analysis of proteins associated with lipid droplets of basal and lipolytically stimulated 3T3-L1 adipocytes. J. Biol. Chem. 279: 46835–46842. [DOI] [PubMed] [Google Scholar]
- 44.Brasaemle D.L. 2007. The perilipin family of structural lipid droplet proteins: stabilization of lipid droplets and control of lipolysis. J. Lipid Res. 48: 2547–2559. [DOI] [PubMed] [Google Scholar]
- 45.Hamann A., Flier J. S., Lowell B. B. 1996. Decreased brown fat markedly enhances susceptibility to diet-induced obesity, diabetes, and hyperlipidemia. Endocrinology. 137: 21–29. [DOI] [PubMed] [Google Scholar]
- 46.Arita Y., Kihara S., Ouchi N., Takahashi M., Maeda K., Miyagawa J., Hotta K., Shimomura I., Nakamura T., Miyaoka K., et al. 1999. Paradoxical decrease of an adipose-specific protein, adiponectin, in obesity. Biochem. Biophys. Res. Commun. 257: 79–83. [DOI] [PubMed] [Google Scholar]
- 47.Skurk T., Alberti-Huber C., Herder C., Hauner H. 2007. Relationship between adipocyte size and adipokine expression and secretion. J. Clin. Endocrinol. Metab. 92: 1023–1033. [DOI] [PubMed] [Google Scholar]
- 48.Yamauchi T., Nio Y., Maki T., Kobayashi M., Takazawa T., Iwabu M., Okada-Iwabu M., Kawamoto S., Kubota N., Kubota T., et al. 2007. Targeted disruption of AdipoR1 and AdipoR2 causes abrogation of adiponectin binding and metabolic actions. Nat. Med. 13: 332–339. [DOI] [PubMed] [Google Scholar]


