Abstract
Background/Aims
The present study tested the hypothesis that chronic hypoxia adversely affects renal development in the ovine fetus.
Methods
Kidneys were collected from near-term fetuses of pregnant ewes maintained at sea level or high altitude (3,801 m, PaO2: approx. 60 mm Hg) for 110 days (n = 6 for each group).
Results
Long-term high altitude hypoxia reduced the fetal kidney/body weight ratio. Histological analysis showed a significant enlargement in the Bowman's space and swelling of tubule epithelial cells in the kidney of the hypoxic fetus. The histological alterations were limited to the cortical, but not medullary, zone. These alterations were associated with an increase in serum creatinine and a decrease in the BUN-to-creatinine ratio in hypoxic fetuses. Angiotensin II receptors (AT1R and AT2R) were detected in the glomerular and tubular regions of the kidney. Chronic hypoxia caused a significant increase in AT1R and a decrease in AT2R protein and mRNA abundance, resulting in a large increase in the AT1R/AT2R ratio in the fetal kidney.
Conclusion
The results demonstrate an adverse effect of chronic hypoxia on renal AT1R and AT2R expression and functions in the fetus, suggesting a possible role of fetal hypoxia in the programming of renal diseases in fetal origins.
Key Words: Hypoxia, Angiotensin II receptors, Ovine fetus
Introduction
Abnormal maternal anatomy in the reproductive system, such as obstructive uropathy, or adverse environmental factors, including malnutrition during pregnancy, may cause impaired fetal developmental and pathological changes in the kidney [1,2,3,4,5]. Retarded growth and restricted organ development in fetuses may be linked to a poor supply of nutrients, including oxygen. Notably, a large number of studies have demonstrated that alterations in fetal development may lead to diseases after birth in adults, including hypertension and metabolic diseases [6,7]. However, there is limited information on how fetal kidney development is affected by hypoxia. The present study used the ovine fetal model to test whether, and to what extent, low levels of oxygen affect fetal kidney development inside healthy maternal sheep with intact reproductive systems (i.e. no obstructive anatomy).
Previous studies have demonstrated that fetuses exposed to malnutrition or other adverse environmental factors have smaller kidneys with a reduction of the number of nephrons [2,4]. However, specific information on the details of the changes in the nephron has not been elucidated. In addition, the influence of hypoxia on the fetal renal units, such as the glomerular and tubule systems, is largely unknown.
Among several mechanisms which produce developmental problems in fetal organs, we focused on the renin-angiotensin system and its receptor subtypes such as the angiotensin II receptor subtype 1 (AT1R) and subtype 2 (AT2R). It is known that AT1R and AT2R play an important role in cell growth, differentiation and apoptosis during development [8,9,10,11,12]. Abnormal expression of AT1R and AT2R in the renal system or in the body has also been shown to be related to kidney and cardiovascular diseases [13,14,15,16]. Therefore, expression of AT1R and AT2R, as well as their ratio (AT1R/AT2R), at both the mRNA and protein level, as well as with fetal renal functions, were determined in the present study. Our data provide novel information for the study of hypoxia-mediated mechanisms in renal development and for disease development in fetal origins.
Methods
Experimental Animals
As previously described [17,18], time-dated pregnant sheep were obtained from the Nebeker Ranch (Lancaster, Calif., USA; altitude: approx. 300 m; arterial PaO2: 102 ± 2 mm Hg) and served as the sea-level normoxic control (n = 6). For chronic hypoxic treatment (n = 6), pregnant ewes (30 days of gestation) were transported to the Barcroft Laboratory, White Mountain Research Station (Bishop, Calif., USA; altitude: 3,801 m; maternal PaO2: 60 ± 2 mm Hg), and maintained there for approximately 110 days. As previously reported, fetal PaO2 in the hypoxic group was 19.3 ± 0.8 mm Hg and 23.3 ± 0.5 mm Hg in the normoxic control [18]. The animals were transported to the laboratory immediately before the studies. Ewes were anesthetized with thiamylal (10 mg/kg) administered via the left external jugular vein. The animals were then intubated and anesthesia was maintained on 1.5–2.0% halothane in oxygen throughout surgery. An incision was made in the abdomen to expose the fetus. Maternal blood samples were collected from the maternal jugular vein and fetal blood samples were collected from the umbilical cord (vein) immediately after opening the uterus. Following the collection of blood samples, fetuses were removed and weighed, and fetal kidneys were collected and weighed. Blood samples were centrifuged and serum was measured for the determination of electrolytes (Na+, K+ and Ca2+), albumin (ALB), amylase (AMY), total bilirubin (Tbil), creatinine (CRE) and blood urea nitrogen (BUN) using Vetscan (Abaxis, Union City, Calif., USA). ALB, AMY and Tbil were measured to determine fetal metabolic status related to liver function under the hypoxic condition. All procedures and protocols used in the present study were approved by the IACUC of Loma Linda University and followed the guidelines of the National Institutes of Health Guide for the Care and Use of Laboratory Animals.
Histological Analysis
Fetal kidney tissue was used. Deparaffinized sections (4 μm) were treated with 2 changes of xylene, 10 min each, and rehydrated in descending alcohol (absolute alcohol for 5 min, 95% alcohol for 1 min, 85% alcohol for 1 min and 75% alcohol for 1 min, sequentially). The sections were washed briefly in distilled water and then stained in Mayer's hematoxylin solution for 5 min. Counterstaining was done in eosin-phloxine B solution for 2 min. The sections were dehydrated through alcohol solutions, and cleared in phenol xylene mounted with xylene-based mounting medium. The slices were viewed, analyzed and diagnosed with a Nikon microscope by experienced pathologists in Soochow University's Pathology Lab in a blinded manner. Images were captured with an attached SPOT digital camera imaging system.
Immunoblotting
Protein levels of renal AT1R and AT2R were determined with Western blot analysis as reported previously [16]. Briefly, fetal renal tissue was homogenized in lysis buffer containing 20 mM HEPES, 10 mM KCl, 1.5 mM MgCl2, 1 mM EDTA, 1 mM EGTA, 1 mM dithiothreitol, 1 mM phenylmethylsulfonyl fluoride and 2 g/ml aprotinin, pH 7.4. Homogenates were centrifuged at 4°C for 10 min at 12,000 g, and supernatants were collected. Samples with equal protein (80 μg) were loaded on 7.5% polyacrylamide gel and separated by electrophoresis at 100 V for 90 min. Proteins were then transferred onto nitrocellulose membranes. Nonspecific binding was blocked in TBST containing 5% dry milk for 50 min at room temperature. The membranes were incubated with rabbit AT1R and AT2R polyclonal antibody (1:300; Santa Cruz Biotechnology, Santa Cruz, Calif., USA) overnight at 4°C. The membranes were then incubated with secondary horseradish peroxidase-conjugated goat anti-rabbit antibody (1:2,000). Protein bands were visualized with enhanced chemiluminescence reagents, and the blots were exposed to Hyperfilm. For comparison of the levels of AT1R and AT2R protein (relative density) between the 2 groups, bands were normalized to β-actin, which was used as a control. Results were quantified by the Kodak electrophoresis documentation and analysis system with Kodak ID image analysis software as reported [16].
Real-Time RT-PCR
RNA was extracted from fetal renal tissue using TRIzol reagents (Invitrogen, Carlsbad, Calif., USA). PCR was performed in triplicate. mRNA abundance of AT1R and AT2R was determined by real-time RT-PCR using an Icycler Thermal Cycler (Bio-Rad, Hercules, Calif., USA). The primer sequences for AT1R were forward 5′-CGGCCTTCGGATAACATGA-3′ and reverse 5′-CCTGTCACTCCACCTCAAAACA-3′. The primer sequences for AT2R were forward 5′-CAATCTGGCTGTGGCTGACTT-3′ and reverse 5′-TGCACATCACAGGTCCAAAGA-3′. Real-time RT-PCR was performed in a final volume of 25 μl. Each PCR reaction mixture consisted of 600 nM of primers, 33 units of M-MLV reverse transcriptase (Promega, Madison, Wisc., USA) and iQ SYBR Green Supermix (Bio-Rad) containing 0.625 units of Taq polymerase; 400 μM each of dATP, dCTP, dGTP, and dTTP; 100 mM KCl; 16.6 mM ammonium sulfate; 40 mM Tris-HCl; 6 mM MgSO4; SYBR Green I; 20 nM fluorescein; and stabilizers. RT-PCR was performed under the following conditions: 42°C for 30 min and 95°C for 15 min, followed by 45 cycles of 95°C for 20 s and 52°C for 1 min. GAPDH was used as an internal reference and serial dilutions of the positive control were performed on each plate to create a standard curve. The amount of target gene was normalized to the reference GAPDH to obtain the relative threshold cycle.
Immunohistochemistry
Fetal kidneys were fixed in 4% paraformaldehyde in 0.1 M phosphate buffer and embedded in paraffin. Ten-micrometer sections were cut through the fetal kidney on a cryostat. Immunohistochemical detection of AT1R and AT2R was performed using the avidin-biotin-peroxidase technique, as described previously [16]. Tissue sections were incubated with primary antibodies against AT1R or AT2R (1:1,000) overnight at 4°C. After rinsing the sections in 0.01 M phosphate-buffered saline for 5 min (3 times), they were incubated with biotinylated goat anti-rabbit Ig (1:500) for 60 min at room temperature. The sections were then treated with 1 mg/ml diaminobenzidine tetrahydrochloride (Sigma; 0.02% hydrogen peroxide). The negative control of immunostaining was performed in the absence of the primary antibody. The slices were viewed with a Nikon microscope, and images were captured with an attached SPOT digital camera imaging system.
Data Analysis
Results from all experiments described above were expressed as means ± SEM obtained from the number of animals given (n = 6 for each group). Differences were evaluated for statistical significance (p < 0.05) by 2-way ANOVA followed by the Newman-Keuls post-hoc test or t test, where appropriate.
Results
Blood Values
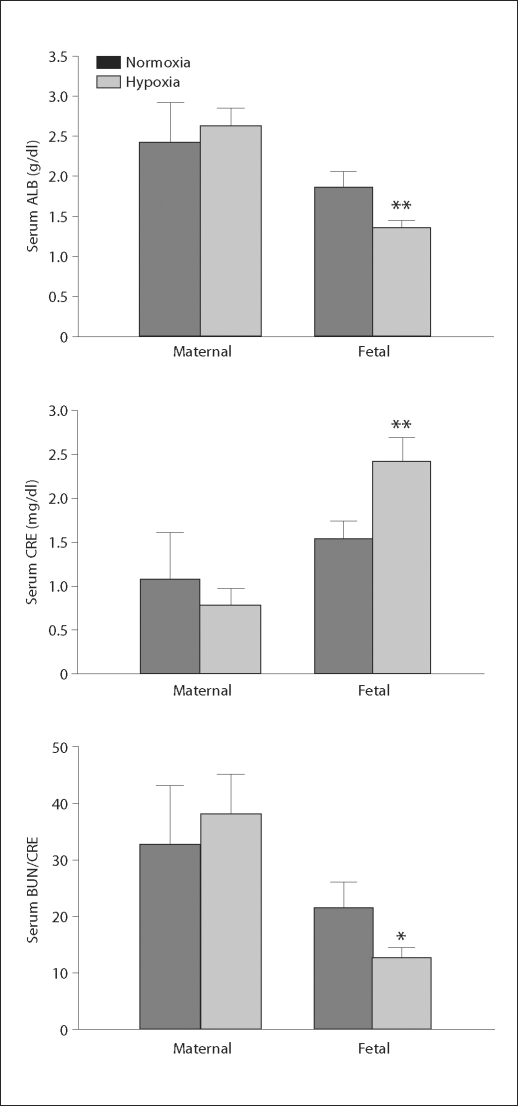
There was no difference in maternal ALB, AMY, Tbil, CRE or BUN/CRE between the normoxic and hypoxic groups (fig. 1; table 1). In the fetuses, serum ALB was significantly less in the hypoxic group than in the control group. Fetal serum CRE was significantly higher and the ratio of BUN/CRE was significantly lower in the hypoxic fetuses than in the normoxic controls (fig. 1). However, fetal serum AMY and Tbil levels were the same between the control and hypoxic animals (table 1). Although serum Na+ and Ca2+ levels in the maternal and fetal sheep were the same between the control and hypoxic groups, serum K+ concentrations in both maternal and fetal sheep were significantly lower in the hypoxic group than in the normoxic group (table 1).
Fig. 1.
Maternal and fetal serum values following chronic hypoxia. Normoxia represents the control, hypoxia represents exposure to hypoxia. ∗ p < 0.05; ∗∗ p < 0.01.
Table 1.
Maternal and fetal serum values
| Adult |
Fetus |
|||
|---|---|---|---|---|
| normoxia | hypoxia | normoxia | hypoxia | |
| AMY, U/l | 14.60 ± 5.93 | 10.00 ± 2.34 | 5.20 ± 1.50 | 4.00 ± 0.00 |
| Tbil, mg/dl | 0.56 ± 0.05 | 0.58 ± 0.07 | 0.72 ± 0.08 | 0.77 ± 0.07 |
| Na+, mM/l | 143.00 ± 3.19 | 143.5 ± 1.29 | 142.2 ± 1.03 | 142.71 ± 1.34 |
| K+, mM/l | 5.38 ± 0.06 | 4.37 ± 0.10∗ | 5.50 ± 0.35 | 4.81 ± 0.13∗ |
| Ca2+, mM/l | 9.74 ± 0.94 | 9.28 ± 0.27 | 11.76 ± 0.95 | 12.78 ± 0.32 |
Values are expressed as means ± SEM. Normoxia represents the control, hypoxia represents exposure to hypoxia.
p < 0.05.
Ratio of Fetal Kidney/Body Weight
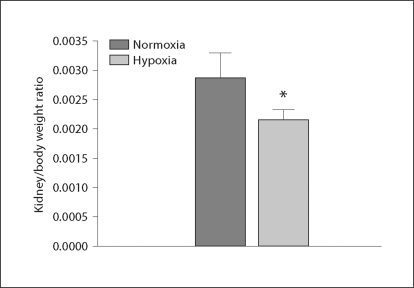
There was no significant difference in fetal body weight between the control and the hypoxic groups (3,760 ± 69 vs. 3,972 ± 43 g, p > 0.05). When the normoxic and the hypoxic groups were compared at the same gestational age, statistical analysis showed that the ratio of fetal kidney/body weight was significantly lowered in the hypoxic animals (fig. 2).
Fig. 2.
Fetal kidney/body weight ratio following exposure to hypoxia. Normoxia represents the control, hypoxia represents exposure to hypoxia. * p < 0.05.
Histological Changes
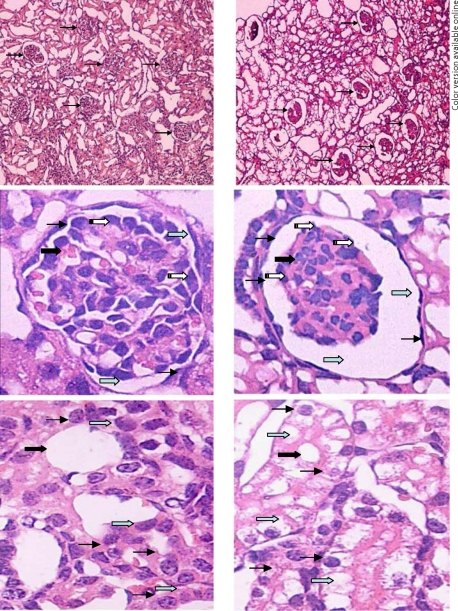
Compared with the control group, the histological changes in the fetal kidney of the hypoxic group were mainly located in the cortical zone of the kidney, including the glomeruli and renal tubule. No significant histological changes were observed in the medullary zone of the kidneys in either group. The most notable histological change in the glomeruli was that the Bowman's space was greatly enlarged, while the sizes of the solid parts of the glomeruli were reduced, accompanied by an increased red-stained renal matrix in the glomeruli of the fetuses exposed to hypoxia (fig. 3). It also appeared that the number of parenchymal cells in glomeruli was decreased in the hypoxic group compared to that in the control fetuses (fig. 3). The major histological change in the renal tubule was cellular swelling or hydropic degeneration in the epithelium of the proximal convoluted renal tubule, where epithelial cells were enlarged and cytoplasm was translucent and loosened (fig. 3). No obvious histological changes were observed in other sections of the renal tubule, including the loop of Henle, the distal convoluted tubule and the collecting tubule.
Fig. 3.
Histological changes in the fetal glomeruli (top and middle panels, 10× and 40×) and the renal tubule (bottom panel, 40×). The left panels show tissue from a normoxic control fetus, the right panels show tissue from a hypoxic fetus. The Bowman's space was enlarged, while the size of the solid core of the glomeruli was reduced, accompanied by an increased red-stained renal matrix in the fetuses exposed to hypoxia (top and middle panels). The number of parenchymal cells of partial glomeruli was decreased in the right panels (thick solid arrows show glomeruli, thin solid arrows show parietal cells, gray arrows show the Bowman's space and white arrows show podocytes in middle panels). Cellular swelling was observed in the epithelium of the proximal convoluted renal tubule, where epithelial cells were enlarged, and the cytoplasm was translucent and loosened in the bottom right panel (thick solid arrows show renal tubule, thin solid arrows show cytoplasm of tubular epithelium and gray arrows show epithelial cells of the renal tubule in the bottom panels).
AT1R and AT2R Protein Levels
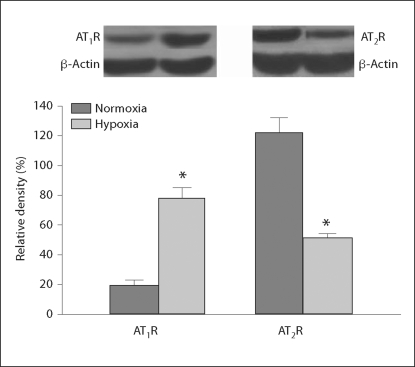
Western blot analysis showed that the total amount of AT1R protein demonstrated by the relative density of AT1R in the fetal kidney was significantly increased following chronic exposure to hypoxia during pregnancy, while levels of renal AT2R protein were significantly decreased in the hypoxic fetuses (fig. 4).
Fig. 4.
Fetal renal angiotensin II receptor protein following exposure to hypoxia. Normoxia represents the control, hypoxia represents exposure to hypoxia. * p < 0.05.
AT1R and AT2R mRNA Levels
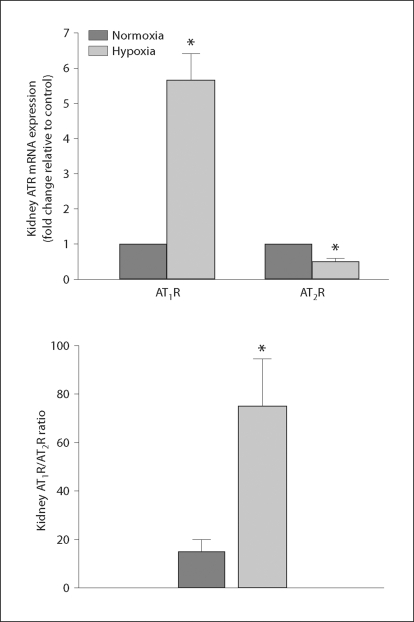
Real-time PCR analysis showed that renal levels of AT1R mRNA were also significantly increased in the fetuses exposed to hypoxia in comparison to the control animals. In addition, renal AT2R mRNA was significantly lower (t = 5.963, p < 0.05, n = 6) in the fetal kidney of the hypoxic group than in the normoxic group (fig. 5). Furthermore, the ratio of renal AT1R/AT2R mRNA levels was significantly increased (approx. 4 fold) in the hypoxic fetus (fig. 5).
Fig. 5.
Fetal renal angiotensin II receptor mRNA (top panel) and the AT1R/AT2R mRNA ratio (bottom panel) following exposure to hypoxia. Normoxia represents the control, hypoxia represents exposure to hypoxia. * p < 0.05 (n = 5–6). ATR = Angiotensin II receptor.
AT1R and AT2R Immunostaining
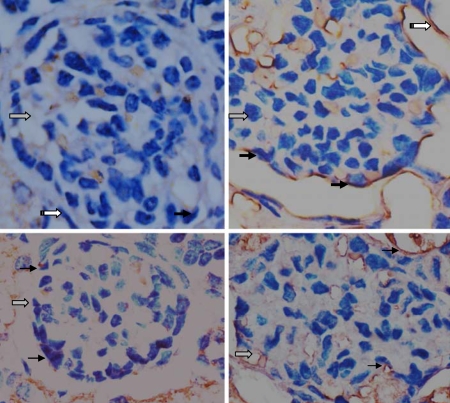
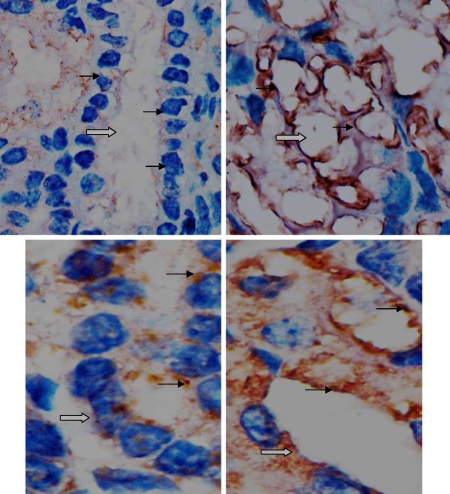
In fetal glomeruli and the proximal convoluted renal tubule, histological analysis showed AT1R immunostaining in podocytes, parietal cells and epithelia in kidneys of both the control and hypoxic groups. The AT1R immunosignal in the glomeruli of the fetuses exposed to hypoxia was stronger than that in the control group (fig. 6). Immunohistochemistry also showed similar AT2R immunostaining in podocytes and the epithelia in fetal kidneys of both the control and hypoxic groups (fig. 7).
Fig. 6.
Immunohistochemical staining showing AT1R (top panel) and AT2R (bottom panel) expression patterns in fetal glomerular podocytes and parietal cells of the Bowman's space. AT1R staining was relatively stronger in the top right panel, while AT2R staining appeared similar between the 2 groups. The left panels show the control, the right panels show the treated hypoxia. Gray arrows show glomeruli, solid arrows show AT1R or AT2R on podocytes, and white arrows show parietal cells of the Bowman's space. 40×.
Fig. 7.
Immunohistochemical staining showing AT1R (top panels, 40×) and AT2R (bottom panels, 100×) expression patterns in the epithelia of the proximal convoluted renal tubule. AT1R staining was relatively stronger in the top right panel, while AT2R staining appeared similar between the 2 groups. The left panels show the control, the right panels show the treated hypoxia. Gray arrows show the renal tubule and solid arrows show AT1R or AT2R on the epithelia of the proximal convoluted tubule.
Discussion
It has been demonstrated that anatomical problems like uropathy and environmental insults such as malnutrition [1,2,3,4,5] may cause renal developmental changes in fetuses. Although mechanisms for obstructive uropathy-induced developmental problems in fetuses include a deficient supply of oxygen in utero, few studies examined the effect of hypoxia on fetal renal development during pregnancy. The present study demonstrated that chronic in utero hypoxia caused alternations in kidney glomeruli and the renal renin-angiotensin system in near-term fetuses.
Previous studies have indicated that the development of the fetal kidney is affected by malnutrition and other adverse environmental factors [2,7]. In the present study, we demonstrated a significant decrease in the kidney/body weight ratio in ovine fetuses exposed to long-term high altitude hypoxia, indicating impairment in fetal renal development. The findings of an enlarged Bowman's space and reduced size of the glomeruli accompanied by an increased red-stained renal matrix in hypoxic fetuses suggest that chronic hypoxia adversely affects glomeruli and tubular systems in the fetal kidney. These changes in histology show that hypoxia mainly affects the glomeruli and renal tubule in the cortical zone, not the medullary zone, of the fetal kidney. Previous studies showed that multiple factors could reduce nephron number in the fetus [3,4,5,7,19]. Given that maternal food intake and body weight at high altitude were not significantly decreased, the effects observed in the present study are likely caused by hypoxia. The finding of the enlarged Bowman's space and shrunken core of glomeruli caused by in utero hypoxia is intriguing and suggests a likelihood of increased risk of renal disease in the postnatal development. Whether and to what extent the histological changes in the glomeruli in the fetus are reversible after birth remains an interesting area for further investigation.
We also measured fetal serum CRE and other chemicals for a preliminary assessment of renal functions. CRE is a break-down product of creatine phosphate and is chiefly filtered by the kidneys. If renal filtering is deficient, serum CRE rises. As a result, CRE levels in blood may reflect the glomerular filtration rate and renal functions. Measuring serum CRE is the most commonly used indicator of renal functions, and a rise in blood CRE levels is often indicative of marked damage to functioning nephrons [20,21,22,23,24]. In the present study, fetal serum CRE levels were significantly increased following exposure to hypoxia, while maternal CRE remained unchanged. This demonstrated that the mature kidney in the mother could still handle CRE when exposed to hypoxia, but the immature fetal kidney failed to remove CRE sufficiently, suggesting that the capability of fetal renal filtering was damaged. The BUN-to-CRE ratio was also reduced (<10) in the fetuses exposed to hypoxia, further indicating that the problems were intrinsic in the kidney. Serum AMY and Tbil, which can reflect both maternal and fetal liver function, were not changed between the normoxia and hypoxia groups in the present study. Maternal and fetal blood sodium and calcium levels were also unchanged by hypoxia. However, fetal serum ALB and potassium were significantly lowered in the fetuses exposed to hypoxia. Low ALB levels can reflect excess excretion by the kidney as seen in nephrotic syndrome [25]. Low potassium also can be caused by renal tubular problems. Many factors can cause low blood ALB and potassium, thus renal influence is not the only possible interpretation of the data. However, due to the evidence of a higher fetal serum CRE associated with the histological changes in renal filtering units and tubular structures, low serum ALB and potassium in the fetus could be suspected as being consequences of renal structural changes following exposure to hypoxia.
We were also interested in the mechanisms involved in hypoxia-induced renal histological and functional alterations in the fetus. Among many possibilities, we focused on renal angiotensin II receptors because several lines of studies have shown that activation of these receptors makes important contributions to cell growth, differentiation and apoptosis during development [22,23,24,25,26,27,28,29,30,31,32,33]. We found that both fetal renal AT1R protein and mRNA levels were significantly increased, while AT2R protein and its mRNA levels were decreased in the ovine fetuses exposed to hypoxia. In addition, the renal AT1R/AT2R mRNA ratio was significantly increased (approx. 4-fold) in the hypoxia-treated fetuses compared to that of the control. Immunostaining also showed both AT1R and AT2R on glomerular podocytes, parietal cells of Bowman's space and the epithelia of the proximal convoluted renal tubule in fetal kidneys. Notably, AT1R immunostaining was more intense in the fetal glomeruli and renal tubule following hypoxia than in the control. Angiotensin II receptor subtypes play a critical role in renal development, including glomerular apoptosis [17,34,35,36]. Both AT1R and AT2R have been suggested to be involved in cellular development, including cellular proliferation and differentiation [8,9,10,11,12,36]. In light of this, at least one explanation was considered for the data gained in the present study: an increase of fetal renal AT1R and a decrease of AT2R following hypoxia may contribute to cell growth, differentiation, migration and apoptosis [37,38] in the cortical zone of the fetal kidney and may be involved in alterations in glomerular and tubular histology. Although future studies are needed for further clarification, the present study was the first to demonstrate that the fetal renal AT1R/AT2R ratio was significantly increased following hypoxia in association with glomerular and tubular alterations in utero.
In conclusion, the present study on hypoxia-mediated alterations in the fetal renal development demonstrated that hypoxia during pregnancy specifically affected the development of the cortical zone, but not the medullary zone, of the fetal kidney at near-term. Hypoxia altered fetal renal histological structures mainly located at the Bowman's space, the core of glumeruli and the renal tubule in the cortical zone. Notably, these alterations were associated with the changes in fetal serum CRE and the BUN-to-CRE ratio that may reflect impaired renal functions. Importantly, both the mRNA and protein levels of AT1R and AT2R, as well as the AT1R/AT2R mRNA ratio, in the fetal kidney were significantly altered by hypoxia, indicating a possible mechanism of hypoxia-mediated poor development of fetal kidneys in utero. The findings in the present study also generated new questions and ideas for further and future investigation. These include (1) how to test and clarify the hypothesis that the renal renin-angiotensin system plays an important role in the fetal glomerular and tubular development, (2) whether prenatal environmental insult-induced alterations in fetal renal structures are reversible or permanent following birth or after removing hypoxia stimulation, and (3) whether the altered gene and protein expression of renal AT1R and AT2R at the fetal stage would last in the offspring. Answering these questions will assist in further understanding the development, prevention and treatment of diseases in fetal renal origins.
Acknowledgements
This work was supported in part by grants from the NIH [HD31226 (L.Z.), HL89012 (L.Z.), HL090920 (Z.X.)]; the National Natural Science Foundation (30871400, 30973211); a Jiangsu Natural Science Grant (BK2006703, 08KJB32001); and a Suzhou Grant (90134602, SWH0716, EE134704).
References
- 1.Langley-Evans SC, Welham SJ, Jackson AA. Fetal exposure to a maternal low protein diet impairs nephrogenesis and promotes hypertension in the rat. Life Sci. 1999;64:965–974. doi: 10.1016/s0024-3205(99)00022-3. [DOI] [PubMed] [Google Scholar]
- 2.Gray SP, Kenna K, Bertram JF, Hoy WE, Yan EB, Bocking AD, Brien JF, Walker DW, Harding R, Moritz KM. Repeated ethanol exposure during late gestation decreases nephron endowment in fetal sheep. Am J Physiol Regul Integr Comp Physiol. 2008;295:R568–R574. doi: 10.1152/ajpregu.90316.2008. [DOI] [PubMed] [Google Scholar]
- 3.Ortiz LA, Quan A, Weinberg A, Baum M. Effect of prenatal dexamethasone on rat renal development. Kidney Int. 2001;59:1663–1669. doi: 10.1046/j.1523-1755.2001.0590051663.x. [DOI] [PMC free article] [PubMed] [Google Scholar]
- 4.Wlodek ME, Westcott K, Siebel AL, Owens JA, Moritz KM. Growth restriction before or after birth reduces nephron number and increases blood pressure in male rats. Kidney Int. 2008;74:187–195. doi: 10.1038/ki.2008.153. [DOI] [PubMed] [Google Scholar]
- 5.Daïkha-Dahmane F, Dommergues M, Muller F, Narcy F, Lacoste M, Beziau A, Dumez Y, Gubler MC. Development of human fetal kidney in obstructive uropathy: correlations with ultrasonography and urine biochemistry. Kidney Int. 1997;52:21–32. doi: 10.1038/ki.1997.299. [DOI] [PubMed] [Google Scholar]
- 6.Zandi-Nejad K, Luyckx VA, Brenner BM. Adult hypertension and kidney disease: the role of fetal programming. Hypertension. 2006;47:502–508. doi: 10.1161/01.HYP.0000198544.09909.1a. [DOI] [PubMed] [Google Scholar]
- 7.Vuguin PM. Animal models for small for gestational age and fetal programming of adult disease. Horm Res. 2007;68:113–123. doi: 10.1159/000100545. [DOI] [PMC free article] [PubMed] [Google Scholar]
- 8.Tanaka M, Ohnishi J, Ozawa Y, Sugimoto M, Usuki S, Naruse M, Murakami K, Miyazaki H. Characterization of angiotensin II receptor type 2 during differentiation and apoptosis of rat ovarian cultured granulosa cells. Biochem Biophys Res Commun. 1995;207:593–598. doi: 10.1006/bbrc.1995.1229. [DOI] [PubMed] [Google Scholar]
- 9.Clément S, Pellieux C, Chaponnier C, Pedrazzini T, Gabbiani G. Angiotensin II stimulates alpha-skeletal actin expression in cardiomyocytes in vitro and in vivo in the absence of hypertension. Differentiation. 2001;69:66–74. doi: 10.1046/j.1432-0436.2001.690107.x. [DOI] [PubMed] [Google Scholar]
- 10.Rodgers KE, Xiong S, Steer R, diZerega GS. Effect of angiotensin II on hematopoietic progenitor cell proliferation. Stem Cells. 2000;18:287–294. doi: 10.1634/stemcells.18-4-287. [DOI] [PubMed] [Google Scholar]
- 11.Janke J, Engeli S, Gorzelniak K, Luft FC, Sharma AM. Mature adipocytes inhibit in vitro differentiation of human preadipocytes via angiotensin type 1 receptors. Diabetes. 2002;51:1699–1707. doi: 10.2337/diabetes.51.6.1699. [DOI] [PubMed] [Google Scholar]
- 12.Perlegas D, Xie H, Sinha S, Somlyo AV, Owens GK. ANG II type 2 receptor regulates smooth muscle growth and force generation in late fetal mouse development. Am J Physiol Heart Circ Physiol. 2005;288:H96–H102. doi: 10.1152/ajpheart.00620.2004. [DOI] [PubMed] [Google Scholar]
- 13.Billet S, Aguilar F, Baudry C, Clauser E. Role of angiotensin II AT1 receptor activation in cardiovascular diseases. Kidney Int. 2008;74:1379. doi: 10.1038/ki.2008.358. [DOI] [PubMed] [Google Scholar]
- 14.Xu Z, Shi L, Hu F, White R, Stewart L, Yao J. In utero development of central ANG-stimulated pressor response and hypothalamic fos expression. Brain Res Dev Brain Res. 2003;145:169–176. doi: 10.1016/s0165-3806(03)00226-8. [DOI] [PubMed] [Google Scholar]
- 15.Shi L, Hu F, Morrissey P, Yao J, Xu Z. Intravenous angiotensin induces brain c-fos expression and vasopressin release in the near-term ovine fetus. Am J Physiol. 2003;285:E1216–E1222. doi: 10.1152/ajpendo.00289.2003. [DOI] [PubMed] [Google Scholar]
- 16.Shi L, Mao C, Wu J, Morrissey P, Lee J, Xu Z. Effects of i.c.v. losartan on the angiotensin II-mediated vasopressin release and hypothalamic fos expression in near-term ovine fetuses. Peptides. 2006;27:2230–2238. doi: 10.1016/j.peptides.2006.03.013. [DOI] [PubMed] [Google Scholar]
- 17.Xiao D, Bird IM, Magness RR, Longo LD, Zhang L. Upregulation of eNOS in pregnant ovine uterine arteries by chronic hypoxia. Am J Physiol Heart Circ Physiol. 2001;280:H812–H820. doi: 10.1152/ajpheart.2001.280.2.H812. [DOI] [PubMed] [Google Scholar]
- 18.Kamitomo M, Longo LD, Gilbert RD. Right and left ventricular function in fetal sheep exposed to long-term high-altitude hypoxemia. Am J Physiol. 1992;262:H399–H405. doi: 10.1152/ajpheart.1992.262.2.H399. [DOI] [PubMed] [Google Scholar]
- 19.Dickinson H, Walker DW, Wintour EM, Moritz K. Maternal dexamethasone treatment at midgestation reduces nephron number and alters renal gene expression in the fetal spiny mouse. Am J Physiol Regul Integr Comp Physiol. 2007;292:R453–R461. doi: 10.1152/ajpregu.00481.2006. [DOI] [PubMed] [Google Scholar]
- 20.Van Lente F, Suit P. Assessment of renal function by serum creatinine and creatinine clearance: glomerular filtration rate estimated by four procedures. Clin Chem. 1989;35:2326–2330. [PubMed] [Google Scholar]
- 21.Cockcroft DW, Gault MH. Prediction of creatinine clearance from serum creatinine. Nephron. 1976;16:31–41. doi: 10.1159/000180580. [DOI] [PubMed] [Google Scholar]
- 22.Gault MH, Longerich LL, Harnett JD, Wesolowski C. Predicting glomerular function from adjusted serum creatinine. Nephron. 1992;62:249–256. doi: 10.1159/000187054. [DOI] [PubMed] [Google Scholar]
- 23.Levey AS, Coresh J, Greene T, Stevens LA, Zhang YL, Hendriksen S, Kusek JW, Van Lente F, Chronic Kidney Disease Epidemiology Collaboration Using standardized serum creatinine values in the modification of diet in renal disease study equation for estimating glomerular filtration rate. Ann Intern Med. 2006;145:247–254. doi: 10.7326/0003-4819-145-4-200608150-00004. [DOI] [PubMed] [Google Scholar]
- 24.Schwartz GJ, Haycock GB, Edelmann CM, Spitzer A. A simple estimate of glomerular filtration rate in children derived from body length and plasma creatinine. Pediatrics. 1976;58:259–263. [PubMed] [Google Scholar]
- 25.Özyilkan E, Simek H, Uzunalimolu B, Telatar H. Interferon treatment of chronic active hepatitis C in patients with end-stage chronic renal failure. Nephron. 1995;71:156–159. doi: 10.1159/000188705. [DOI] [PubMed] [Google Scholar]
- 26.Striker GE, Praddaude F, Alcazar O, Cousins SW, Marin-Castaño ME. Regulation of angiotensin II receptors and extracellular matrix turnover in human retinal pigment epithelium: role of angiotensin II. Am J Physiol Cell Physiol. 2008;295:C1633–C1646. doi: 10.1152/ajpcell.00092.2008. [DOI] [PMC free article] [PubMed] [Google Scholar]
- 27.Sarzani R, Marcucci P, Salvi F, Bordicchia M, Espinosa E, Mucci L, Lorenzetti B, Minardi D, Muzzonigro G, Dessì-Fulgheri P, Rappelli A. Angiotensin II stimulates and atrial natriuretic peptide inhibits human visceral adipocyte growth. Int J Obes (Lond) 2008;32:259–267. doi: 10.1038/sj.ijo.0803724. [DOI] [PubMed] [Google Scholar]
- 28.Huang Z, Yu J, Toselli P, Bhawan J, Sudireddy V, Taylor L, Polgar P. Angiotensin II type 1 and bradykinin B2 receptors expressed in early stage epithelial cells derived from human embryonic stem cells. J Cell Physiol. 2007;211:816–825. doi: 10.1002/jcp.20985. [DOI] [PubMed] [Google Scholar]
- 29.Blume A, Kaschina E, Unger T. Angiotensin II type 2 receptors: signalling and pathophysiological role. Curr Opin Nephrol Hypertens. 2001;10:239–246. doi: 10.1097/00041552-200103000-00013. [DOI] [PubMed] [Google Scholar]
- 30.Côté F, Do TH, Laflamme L, Gallo JM, Gallo-Payet N. Activation of the AT(2) receptor of angiotensin II induces neurite outgrowth and cell migration in microexplant cultures of the cerebellum. J Biol Chem. 1999;274:31686–31692. doi: 10.1074/jbc.274.44.31686. [DOI] [PubMed] [Google Scholar]
- 31.Crandall DL, Armellino DC, Busler DE, McHendry-Rinde B, Kral JG. Angiotensin II receptors in human preadipocytes: role in cell cycle regulation. Endocrinology. 1999;140:154–158. doi: 10.1210/endo.140.1.6430. [DOI] [PubMed] [Google Scholar]
- 32.Jirikowski G, Reisert I, Pilgrim C. Angiotensin II promotes development of neurophysin neurons in dissociated culture. Brain Res. 1984;316:179–183. doi: 10.1016/0165-3806(84)90304-3. [DOI] [PubMed] [Google Scholar]
- 33.Gunther S, Alexander RW, Atkinson WJ, Gimbrone MA., Jr Functional angiotensin II receptors in cultured vascular smooth muscle cells. J Cell Biol. 1982;92:289–298. doi: 10.1083/jcb.92.2.289. [DOI] [PMC free article] [PubMed] [Google Scholar]
- 34.Kolb RJ, Woost PG, Hopfer U. Membrane trafficking of angiotensin receptor type-1 and mechanochemical signal transduction in proximal tubule cells. Hypertension. 2004;44:352–359. doi: 10.1161/01.HYP.0000136645.90116.1a. [DOI] [PubMed] [Google Scholar]
- 35.Schling P. Expression of angiotensin II receptors type 1 and type 2 in human preadipose cells during differentiation. Horm Metab Res. 2002;34:709–715. doi: 10.1055/s-2002-38240. [DOI] [PubMed] [Google Scholar]
- 36.Eskild-Jensen A, Paulsen LF, Wogensen L, Olesen P, Pedersen L, Fr⊘kiær J, Nyengaard JR. AT1 receptor blockade prevents interstitial and glomerular apoptosis but not fibrosis in pigs with neonatal induced partial unilateral ureteral obstruction. Am J Physiol Renal Physiol. 2007;292:F1771–F1781. doi: 10.1152/ajprenal.00479.2006. [DOI] [PubMed] [Google Scholar]
- 37.Mao C, Shi L, Xu F, Zhang L, Xu Z. Development of fetal brain renin-angiotensin system and hypertension programmed in fetal origins. Prog Neurobiol. 2009;87:252–263. doi: 10.1016/j.pneurobio.2008.12.001. [DOI] [PMC free article] [PubMed] [Google Scholar]
- 38.Xu F, Mao C, Liu Y, Wu L, Xu Z, Zhang L: Losartan chemistry and its effects via AT1 mechanisms in the kidney. Curr Med Chem 2009, Epub ahead of print. [DOI] [PMC free article] [PubMed]


