

Abstract
Objective
To determine changes in body weight and composition resulting from hormonal contraception.
Study design
Dual-energy X-ray absorptiometry was performed at baseline and every 6 months for 3 years on 703 women (200 Black, 247 White, 256 Hispanic) initiating use of oral contraception (OC, n = 245), depot medroxyprogesterone acetate (DMPA, n = 240), or nonhormonal contraception (NH, n = 218). DMPA discontinuers were followed for up to 2 years to examine the reversibility of observed changes.
Results
Over 36 months, DMPA users increased their weight (+5.1 kg), body fat (+4.1 kg), percent body fat (+3.4%), and central-to-peripheral fat ratio (+0.1) more than OC and NH users (P<.01). OC use did not cause weight gain. After DMPA discontinuation, NH users lost 0.42 kg/6 months while OC users gained 0.43 kg/6 months.
Conclusions
Body weight and fat significantly increase while using DMPA. After discontinuation, some decrease occurs when NH is used.
Keywords: depot medroxyprogesterone acetate, body weight, body fat, oral contraception
Introduction
Weight gain is frequently cited by women as a reason for discontinuing the injectable contraceptive, depot medroxyprogesterone acetate (DMPA).1-3 However, studies have differed in their findings as to whether this birth control method actually causes an increase in weight. For example, several studies have demonstrated weight gain while using DMPA4-6 while others have shown no effect.1,7,8 Many of these studies, however, were retrospective in design 4,8-11 or did not include a comparison group using nonhormonal contraception. 8,9,12 In contrast, studies on low dose oral contraceptives have not shown an effect on weight or body composition. 13,14 However, many of these studies are limited by small sample sizes 14 or merged different formulations of oral contraceptives.15,16
Furthermore, most studies on these contraceptive methods have failed to include a diverse sample or did not conduct analyses by race so racial effects on contraceptive-related weight changes cannot be determined. In addition, almost no studies have followed women after DMPA discontinuation to determine if any observed weight increases were reversible. Absence of these data prevents clinicians from being able to advise women on whether weight gain that occurs as a result of using hormonal contraception persists following discontinuation.
The purpose of this study was to determine changes in body weight and composition during 3 years of hormonal contraceptive use and up to 2 years after discontinuation, as well as the influence of age, race, caloric intake, and exercise as well as other factors on this relationship. Exploration of these questions will allow clinicians to counsel women about body composition changes associated with these popular forms of contraception.
Methods
As part of a larger study to examine the effects of hormonal contraception on bone mineral density, 17 805 non-Hispanic black, non-Hispanic white, and Hispanic women between 16 and 33 years of age were recruited between October 9, 2001, and September 14, 2004. Recruitment was conducted to achieve a sample that was balanced by age group (16–24 years and 25–33 years) and contraceptive method, as previously described .17 All women underwent eligibility screening including a medical interview, anthropometry, and fasting phlebotomy during the follicular phase of their menstrual cycle. Criteria for exclusion included current pregnancy or breastfeeding; pregnancy planned within the next 3 years; use of DMPA within the past 6 months; use of oral contraception (OC) within the past 3 months; current use of hormonal intrauterine device; contraindication to hormonal contraception; lack of menses for >3 months within the past year; bilateral oopherectomy; use of over-the-counter phytoestrogen supplements; dietary isoflavone intake exceeding 84 mg per day as determined by a checklist of high-isoflavone foods developed from the literature as well as the USDA nutrient database; illness or medications known to affect bone mineral density (BMD) (anticonvulsants, benzodiazepines, corticosteroids, diuretics, thyroid hormones); and eating disorders or strict vegetarian diet. Creatinine, calcium, phosphorus, alanine aminotransferase (ALT), aspartate amino-transferase (AST), thyroid stimulating hormone (TSH), parathyroid hormone (PTH), and 25-OH vitamin D were measured and women were excluded if results were not within normal reference ranges. Of 2,999 women who responded to advertisements, 1,404 met general inclusion criteria and matched an “open” recruitment cell (age group × race × contraceptive method). Of these, 805 women provided written consent (and parental consent if <18 years of age) to undergo further screening for the larger study. Of these, 5 withdrew prior to completing their first visit and 97 had abnormal laboratory or bone scan results (Figure 1). Thus, 703 women were invited to participate in the longitudinal study. Those excluded (n=102) did not differ from women included in the longitudinal study (n=703) on age, marital status, parity, or education (all P>.05).
Figure 1.
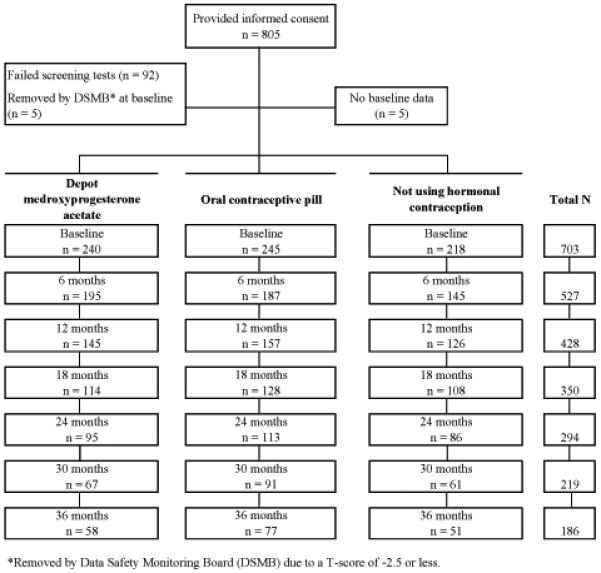
Flow of recruitment and retention across the study.
Following counseling, women were allowed to select one of three types of birth control: 245 chose oral contraception (OC; 0.15 mg desogestrel + 20 μg ethinyl estradiol taken for 21 days, followed by 2 days of placebo and 5 days of 10 μg ethinyl estradiol); 240 chose depot medroxyprogesterone acetate (DMPA); and 218 chose nonhormonal contraception (NH). NH methods included bilateral tubal ligation, condoms, and abstinence. Contraception was dispensed every 3 months. At baseline and every 6 months thereafter, women were weighed wearing light indoor clothing with a digital scale accurate to the nearest 0.1 kg and height was measured using a wall-mounted stadiometer (Heightronic, Snoqualmie, WA) accurate to the nearest 0.001 m.
Total body fat, percent body fat, total lean mass, and body fat distribution measures were obtained using dual-energy X-ray absorptiometry (DXA) (Hologic QDR 4500W densitometer). Body composition measurements with DXA show a high correlation with other techniques such as underwater weighing and has been described as the gold standard method. Reliability of the QDR 4500W as measured by intraclass correlation coefficients are very high (0.997 to 0.999 for percent body fat and total fat). 18 The central-to-peripheral fat ratio was calculated by dividing the trunk fat by the total of upper and lower limb fat.5,19 All scans were conducted on a single machine with no change in software throughout the study. Details of the scan protocol have been previously described.17 To obtain estimates on daily calorie intake along with amount of protein, fat, and carbohydrate consumed, a registered dietician conducted a 24-hour dietary recall interview with each participant annually. Nutrient calculations were performed using the Nutrition Data System for Research (NDS-R) software, version 4.05 (Nutrition Coordinating Center, University of Minnesota, Minneapolis).20
A subset of participants (n=608) also completed a symptom checklist at baseline and every 6 months thereafter for 36 months which included questions on changes in appetite over time (increase or decrease). Women responded “yes” to indicate they had experienced the symptom in the past three months or “no” if not. Ninety-five women were enrolled prior to the addition of this checklist to the study protocol. These 95 women did not differ from the 608 in age, parity, race, marital status, and education. All participants received free well-woman care and contraception during the study as well as monetary compensation. Those who did not return for scheduled visits were reminded by phone and certified letters.
Participants also completed a written questionnaire containing demographic and behavioral measures. Behavioral measures included prior breastfeeding and hormonal contraceptive use, smoking, alcohol use, and physical activity. Tobacco use was measured with questions from the MONICA Smoking Assessment. 21 For analytic purposes, current smokers were those who reported regular or occasional smoking while nonsmokers were those who currently did not smoke. Alcohol use was calculated from questions on the Diet History Questionnaire regarding how often subjects drank alcohol (either beer, wine or wine coolers, or liquor or mixed drinks) during the past 12 months and the amount usually consumed when drinking.22 Weight-bearing physical activity was taken from a measure that included a list of 56 common activities, and questions on the frequency and duration of up to two physical activities performed during the past month. We categorized weight-bearing exercise into two groups: < 120 minutes/week and > 121 minutes/week.
Of the 240 initial DMPA users, 182 discontinued this method, 68 of whom remained in the study for up to 2 additional years. There were no differences in baseline characteristics between DMPA users who remained in the study (n=68) and those who did not (n=114) with regard to age, race/ethnicity, height, weight, lean mass, age at menarche, lifestyle variables, calcium intake, pregnancy/breast feeding, and previous exposure to OC or DMPA. However, the former were more likely to have a higher BMI, exercise more, and have higher baseline fat mass and percent body fat. Of the 68 women who were followed after DMPA discontinuation, 44 began OC and were given the same formulation used in the study, while the remaining 24 chose NH. All procedures were approved by the Institutional Review Board of the University of Texas Medical Branch.
Statistical Analysis
One-way analysis of variance with Bonferroni correction for continuous variables and chi-square test for categorical variables were performed to compare the three contraceptive groups at baseline. We used longitudinal analyses to determine changes in weight, total body fat, percent body fat, central-to-peripheral fat ratio, and total lean mass for each contraceptive method, along with their predictors over time. To accommodate the repeated measurements, the data were modeled using Stata’s mixed effects regression procedure (xtmixed module), which allowed us to obtain regression coefficients for various predictors while adjusting for the estimated errors for the repeated measurements. This class of model also allows inclusion of time-dependent covariates and accommodates subjects with incomplete data due to variation in number and spacing in observations over the period of follow-up, which frequently occurs in longitudinal studies.
The primary outcomes were weight, total body fat, percent body fat, central-to-peripheral fat ratio, and total lean mass. To examine the overall effect of method, race, and time, our models included contraceptive method (OC/DMPA/NH), race/ethnicity, and duration of contraceptive use (time) as main effects after adjusting for other covariates. Interaction terms (method × race/ethnicity, method × time) were then included in the model. The interaction term between time and contraceptive method was included to estimate the changes in weight and body composition over time in different contraceptive users. Further, the time2-by-method interaction term was also included to examine the linearity of changes by different method over time. Age, age at menarche, parity, previous use of pills and DMPA, and lifestyle variables were included as fixed covariates. The effect of socioeconomic variables such as income, education, marital status, and prior breastfeeding were also examined and retained if found statistically significant. Similar linear mixed models were also constructed to estimate the changes in weight and body composition after discontinuation of DMPA.
Separate linear mixed models were also constructed to examine the effect of baseline obesity status (BMI: <30 vs. ≥ 30), appetite change, and daily intake of protein, fat, carbohydrate, and total calories (based on 12-monthly follow-up data) on weight and body composition changes. In addition, a generalized estimating equations (GEE) model23 was constructed to examine the risk of obesity by contraceptive method after adjusting for baseline obesity status, age, race, and other covariates. This method can be considered a linear regression technique, which takes into account that the same subjects are measured over a period of time. The model allowed us to obtain odds ratios (OR) for the various predictors while adjusting for the estimated errors for repeated measurements. All analyses were performed using STATA 10 (Stata Corporation, College Station, TX).
Results
At baseline, the total sample included 200 blacks, 247 whites, and 256 Hispanics with a mean age of 24.3 years. DMPA, OC, and NH users were similar in terms of age, race, height, weight, lean mass, fat mass, percent body fat, age at menarche, prior use of OC, alcohol use, and weight bearing exercise (Table 1). However, NH users were more likely to have been pregnant, OC users were less likely to have used DMPA previously, and DMPA users were more likely to report current smoking.
Table 1.
Sample Characteristics According to Contraceptive Selected at Baseline
| Characteristic | OC (n = 245) |
DMPA (n = 240) |
NH (n = 218) |
|---|---|---|---|
| Number of study subjects (%) | |||
| Age | |||
| 16–24 y | 113 (54.3) | 136 (56.7) | 100 (45.9) |
| 25–33 y | 112 (45.7) | 104 (43.3) | 118 (54.1) |
| Race | |||
| Black | 73 (29.8) | 72 (30.0) | 55 (25.2) |
| White | 82 (33.5) | 82 (34.2) | 83 (38.1) |
| Hispanic | 90 (36.7) | 86 (35.8) | 80 (36.7) |
| Current smoker | 57 (23.3)a | 87 (36.3)b | 48 (22.0) |
| Weight-bearing exercise >120 min/wk | 104 (43.2) | 86 (36.3) | 80 (37.5) |
| History of previous DMPA injection | 63 (25.7) | 107 (44.6) | 84 (38.5) |
| Mean ± SD | |||
| Weight, kg | 73.3 ± 17.7 | 71.8 ± 19.2 | 73.2 ± 18.6 |
| BMI, kg/m2 | 27.9 ± 6.4 | 27.2 ± 6.9 | 28.3 ± 7.0 |
| Fat mass, kg | 27.0 ± 11.2 | 25.6 ± 12.1 | 27.2 ± 11.7 |
| Fat mass, % of total | 36.4 ± 7.4 | 34.8 ± 8.4 | 36.7 ± 7.5 |
| Trunk fat, kg | 12.5 ± 6.2 | 11.9 ± 6.6 | 12.9 ± 6.5 |
| Trunk fat limb fat ratio | 0.89 ± 0.23 | 0.89 ± 0.22 | 0.93 ± 0.25 |
| Lean mass, kg | 44.5 ± 7.3 | 44.4 ± 8.0 | 44.1 ± 7.7 |
| Age at menarche, y | 12.2 ± 1.5 | 12.5 ± 1.7 | 12.2 ± 1.6 |
| Parity | 0.86 ± 1.05c | 1.13 ± 1.17d | 1.56 ± 1.47 |
| Previous use of pill (months) | 21.9 ± 31.8 | 16.9 ± 29.6 | 17.7 ± 28.6 |
| Previous use of DMPA injection (#)† | 1.4 ± 3.5e | 3.5 ± 6.5f | 2.6 ± 5.2 |
| Alcohol use, gm/day | 1.6 ± 8.7 | 1.2 ± 6.1 | 2.3 ± 14.5 |
OC = oral contraceptive; DMPA = depot medroxyprogesterone acetate; NH = nonhormonal contraception; BMI = body mass index; SD = standard deviation.
P<.01 for OC vs. DMPA
P<.01 for DMPA vs. NH
P<.001 for OC vs. NH
P<.001 for DMPA vs. NH
P<.034 for OC vs. NH
P<.001 for DMPA vs. OC.
Overall mean duration of DMPA use was 4.2 months for OC users, 10.4 months for DMPA users (24 months for prior users) and 7.8 months for NH contraception users.
One-way analysis of variance with Bonferroni correction was used for continuous variables and chi-square tests were used for categorical variables. To identify specific pairwise differences for categorical variables, we created separate 2×2 tables for each of the pairs and used chi square tests. To adjust for multiple comparison, P<.017 (.05/3) was used to indicate the statistical significance between any two contraceptive groups.
Figure 2 shows the observed and estimated changes in weight and body composition by contraceptive method over 36 months. In most cases, the observed and estimated values were very close to each other indicating the good fit of the models. Over 36 months, DMPA users increased their weight (+5.1 kg), body fat (+4.1 kg), percent body fat (+3.4%), and central-to-peripheral fat ratio (+0.1) significantly more than OC and NH users (P<.01 for all models) (Table 2). OC users did not gain more weight than NH users, but did increase their fat mass and percent body fat. They also lost significantly more lean body mass than NH and DMPA users.
Figure 2.
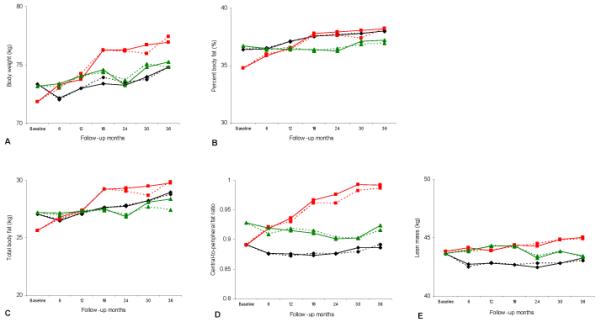
Changes in (A) body weight, (B) percent body fat, (C) total body fat, (D) central to peripheral fat ratio, and (E) lean mass by contraceptive method over 36 months of follow-up. Red squares = depot medroxyprogesterone acetate; green triangles = nonhormonal contraception; black diamonds = oral contraceptives. Solid lines = modeled change; dashed lines = observed change.
Table 2.
Estimated Changes in Weight, Body Fat, Percent Body Fat, Central-to-Peripheral Fat Ratio, and Total Body Lean Mass across 36 Months by Contraceptive Methoda,b,c
| OC | DMPA | NH | P value* | |
|---|---|---|---|---|
| Weight, kg |
NH vs. OC: = .168 NH vs DMPA: <.001 OC vs. DMPA: <.002 |
|||
| 6 mo | −1.17 | 1.48 | 0.19 | |
| 12 mo | −0.35 | 1.93 | 0.86 | |
| 18 mo | 0.07 | 4.43 | 1.37 | |
| 24 mo | −0.08 | 4.44 | 0.07 | |
| 30 mo | 0.65 | 4.87 | 1.62 | |
| 36 mo | 1.47 | 5.12 | 2.05 | |
| Total body fat, kg |
NH vs. OC: <.01 NH vs DMPA: <.001 OC vs. DMPA: <.001 |
|||
| 6 mo | −0.56 | 1.17 | −0.05 | |
| 12 mo | 0.15 | 1.78 | 0.09 | |
| 18 mo | 0.59 | 3.63 | 0.30 | |
| 24 mo | 0.67 | 3.72 | −0.37 | |
| 30 mo | 1.20 | 3.87 | 0.91 | |
| 36 mo | 1.90 | 4.14 | 1.17 | |
| Percent body fat, % |
NH vs. OC: <.01 NH vs DMPA: <.001 OC vs. DMPA: <.003 |
|||
| 6 mo | 0.02 | 1.07 | −0.23 | |
| 12 mo | 0.72 | 1.75 | −0.31 | |
| 18 mo | 1.14 | 3.02 | −0.31 | |
| 24 mo | 1.26 | 3.16 | −0.44 | |
| 30 mo | 1.38 | 3.27 | 0.42 | |
| 36 mo | 1.63 | 3.41 | 0.51 | |
| Central-to-peripheral fat ratio |
NH vs. OC: = .135 NH vs DMPA: <.001 OC vs. DMPA: <.001 |
|||
| 6 mo | −0.01 | 0.03 | −0.01 | |
| 12 mo | −0.02 | 0.05 | −0.01 | |
| 18 mo | −0.02 | 0.08 | −0.02 | |
| 24 mo | −0.01 | 0.09 | −0.03 | |
| 30 mo | 0.00 | 0.10 | −0.03 | |
| 36 mo | 0.00 | 0.10 | 0.00 | |
| Total body lean mass | NH vs. OC: <.026 NH vs DMPA: =.996 OC vs. DMPA: <.016 |
|||
| 6 mo | −0.89 | 0.30 | 0.25 | |
| 12 mo | −0.77 | 0.01 | 0.63 | |
| 18 mo | −0.92 | 0.50 | 0.67 | |
| 24 mo | −1.15 | 0.44 | −0.39 | |
| 30 mo | −0.78 | 1.00 | 0.17 | |
| 36 mo | −0.36 | 1.16 | −0.24 |
OC = oral contraceptive; DMPA = depot medroxyprogesterone acetate; NH = nonhormonal contraception.
Mean baseline value was subtracted from mean modeled value at each follow-up visit to generate the numbers in the table.
Adjusted by baseline values (baseline weight, total body fat, percent body fat, or baseline central-to-peripheral fat ratio), age (16–24 years vs. 25–33 years), age at menarche (years in continuous scale), race/ethnicity (black, white, and Hispanic), parity, weight-bearing exercise (≤120min/wk vs. >120min/wk), alcohol use (gm/day), smoking status (current smoker vs. not), months of pill use, and previous use of DMPA.
Linear mixed model was used for the adjustment, and P values are based on the main effect models.
P values indicate the difference between the methods across 36 months.
DMPA users had the highest weight gain during the first 18 months (4.4 kg) after which the gain slowed during the second 18 months (0.7 kg) (Table 2). A similar scenario was observed for total body fat (3.6 kg vs. 0.5 kg), percent body fat (3% vs. 0.4%), and central-to-peripheral fat ratio (0.08 vs. 0.02). OC users showed several ups and downs for total body weight with a final 1.5 kg gain vs. 2.1 kg in NH users at the end of the 36 month period. Gains in total and percent body fat in OC users were consistent over time, while almost no change was observed for central-to-peripheral fat ratio. Lean mass loss in OC users was mostly evident during the first 6 months (−0.9 kg) while a notable gain was observed in DMPA users after 30 months. NH users did not show any particular pattern.
At baseline, 469 (OC 161, DMPA 167, and NH 141) of the 703 women were classified as nonobese (BMI<30). Analysis based on a GEE model showed that compared with NH contraceptive users, DMPA users were 2.13 times more likely to exceed a BMI of 30 over the 36 month follow-up period [95% confidence interval (CI), 1.05–4.32] while OC users were not at increased risk (odds ratio 1.37, 95% CI, 0.67–2.80). In addition, method-specific linear mixed models showed that DMPA users who were nonobese at baseline gained more weight than obese women while no such relationship was observed in OC or NH users. The model with interaction terms between baseline obesity and race/ethnicity also showed that, among DMPA users, white nonobese women gained significantly more than white obese women (P=.011). Hispanic women showed a similar trend, although it did not achieve statistical significance (P=.099). In contrast, black women did not show any difference.
In addition to contraceptive method after adjusting for baseline weight, several other predictors were found to be significantly associated with changes in weight and body composition based on linear mixed models. With regard to race, white OC users gained more total [regression coefficient (rc) of the interaction term: 1.28, P=.049] and percent body fat (rc: 1.13, P=.019) than blacks, while Hispanic women were more likely to increase their central-to-peripheral fat ratio (rc: 0.012, P=.02) irrespective of contraceptive method. Prior DMPA users experienced lower total (rc: −0.016, P=.028) and percent body fat (rc: −0.011, P=.03) gain compared to new DMPA users. The rate of weight, fat, and percent fat gain by DMPA users was not linear as the interaction between the quadratic term of duration and DMPA use was significant. The same was true for percent body fat among OC users. Moreover, longer DMPA use was associated with greater weight gain and other body composition changes. A similar scenario was found for OC users with regard to body fat and percent body fat changes. Lean mass loss among OC users was not linear, while weight bearing exercise was protective (rc: 0.75, P=.013) against the loss irrespective of the contraceptive method. Alcohol use, smoking, age at baseline, age at menarche, marital status, income, education, prior breastfeeding, parity, and previous OC use were not significant predictors of change.
A linear mixed model based on 12-month follow-up data that included all main effects, total caloric intake, and amount of protein, fat, and carbohydrate consumed per day (with interaction terms) showed that an increase in protein intake was protective against gains in weight and body fat among DMPA (DMPA x protein in gm, rc: −0.02 for weight, −0.013 for body fat, P<.05 in both cases) and OC users (OC x protein in gm, rc: −0.026 for weight, −0.019 for body fat, P<.05 in both cases). In addition, it was also protective against a gain in percent body fat among OC users (rc: −0.009, P<.05). Other dietary variables did not have any effects on weight and body composition. Another similar model based on a subset of women, which included longitudinal data regarding changes in appetite, did not show any effect of appetite increase on weight and body composition changes.
After DMPA was discontinued, those who used NH contraception had an adjusted mean weight loss of 0.42 kg for each 6-month interval (1.68 kg/24 months). However, those who chose OC after DMPA discontinuation had an adjusted mean gain of 0.43 kg for each 6-month interval (1.72 kg/24 months). The respective changes for each 6-month interval for total body fat, percent body fat, and central-to-peripheral fat ratio in the DMPA to NH and DMPA to OC groups were −0.55 kg and +0.40 kg, −0.4% and +0.3%, and +0.005 and −0.006. Hispanic women lost more body weight, but increased central-to-peripheral fat ratio compared to blacks regardless of method. White women who chose NH after DMPA discontinuation were more likely to lose percent body fat than black women.
Over the 36 month follow up period, 257 women were lost to follow-up, 137 discontinued because they desired a different contraceptive method and 123 did not complete the study due to other reasons. We examined whether weight gain (>5% of the baseline value) was related to loss to follow-up or seeking a different contraceptive method. DMPA users who were observed to have a >5% increase of their total body weight at their 6-month visit were more likely to be lost to follow-up at the following visit than those who did not gain weight (32.6% vs. 12.5%, P=.003). No other relationships were found to be statistically significant.
Discussion
This prospective, controlled study demonstrated that DMPA use is associated with significant weight gain (4.4 kg after 24 months and 5.1 kg after 36 months). The increase in weight we observed is similar to that reported by the original manufacturer in their study of 3857 women.20 Other studies have demonstrated even greater gains.5,11,13 For example, Clark showed an increase of 6.1 kg after 30 months of use.5 In contrast, a recent study reported that there was no significant difference in mean weight gain between women using DMPA and NH contraception over 240 weeks (5.1 kg vs. 2.9 kg; P=.08).1 This study is somewhat limited, however, by the fact that only 17% of DMPA users completed the follow-up period. Since weight gain has been reported as a common reason for DMPA discontinuation, it is likely that women who gained weight while using this method did not complete the follow-up period and thus, were not included in the final analyses. This may also explain why the rate of weight gain associated with DMPA use has been demonstrated to slow over time in several studies, including our investigation.
We also demonstrated that DMPA-associated increases in weight are due to an increase in fat mass and not lean mass. Our finding that previous DMPA users experienced less total increase in fat than new users probably resulted from prior users having gained most of the DMPA-related increase in fat mass prior to enrolling in this study. Many women who selected DMPA had used this method previously for >18 months when gains in fat mass are greatest.
Similar to Clark’s study,5 we observed an increase in the central-to-peripheral fat among DMPA users, demonstrating an increase in visceral fat, one of the key components of metabolic syndrome. It is a concern that women who were not obese at the start of the study were twice as likely to become obese over the next 3 years if they selected DMPA over NH contraception. Women who develop metabolic syndrome are at increased risk for insulin resistance, diabetes, and cardiovascular complications. Thus, it is important to determine if DMPA use contributes to the development of these complications and places their overall health at risk.
The mechanism by which DMPA causes an increase in fat mass is not known. Our observations that caloric intake and fat consumption did not affect weight gain and that appetite was not related to body composition changes argue against the theory that DMPA-associated weight gain is due to its effects on the regulation of appetite and energy expenditure.25 Another possible mechanism for DMPA-associated weight gain is its glucocorticoid-like activity. It is also possible that the hypoestrogenic state induced by DMPA is responsible as it has been demonstrated that menopause is associated with an increase in fat mass that is independent of age and body weight. 26
We are unable to explain why non-obese white DMPA users are more likely to gain weight than their obese counterparts. This finding contrast to the those of Bonny et al in their study of predominantly black women.27 Another investigation of mostly white women observed that baseline weight status was not predictive of weight change after 30 months.5 Differences in the populations may explain the discrepancy in findings as both gynecologic age and race were predictive of weight gain in a portion of subjects in Bonny’s study. Variability in DMPA pharmacokinetics and increased availability of DMPA in the body circulation compared to their body weight in nonobese women may also explain the difference to some extent. Future studies are warranted to address these issues.
OC users did not gain more weight than NH users, but did increase their percent body fat and decrease their total lean body mass. This is similar to the findings of a previous study which attributed this change in body composition to normal growth.15 In our study, it is also possible that these changes were due to shifts in exercise patterns since exercise was noted to be protective of lean mass in all women. This could account for the loss of lean mass we observed among OC users as this group significantly decreased the amount of time they exercised over the course of the study (115 minutes at baseline vs. 63 minutes at 36 months, p < 0.05).
After DMPA was discontinued, those who used NH contraception had an adjusted mean weight loss of 1.7 kg after 24 months. In contrast, those who chose OC after DMPA discontinuation had an adjusted mean gain of 1.7 kg during the same time frame. Thus, DMPA-associated weight gain appears to be somewhat reversible if NH contraception is used after discontinuation, but not if OC is taken. This should be considered when counseling women who are overweight about their subsequent method of contraception.
This study has several limitations. First, we did not randomize women to one of the three contraceptive groups as these methods have different efficacies and randomization could have led to unintended pregnancies. Second, too few women were followed after DMPA discontinuation to stratify our analysis by race/ethnicity and other important variables. Third, DMPA users who gained weight at the initial follow-up visit were more likely to drop out at the following visit, thus, the amount of weight gain associated with long-term DMPA use may be greater than we were able to detect in this study. Fourth, we were not able to include women over 300 pounds, due to the weight limitations of the DXA equipment. Finally, we studied only one formulation of OC, so our findings cannot be generalized to other types of birth control pills with different amounts of estrogen or other progestins. Together, these limitations could impact the overall generalizability of our findings and selection bias cannot be ruled out.
In conclusion, body weight, total body fat, percent body fat, and central-to-peripheral fat ratio significantly increased with DMPA use. However, the degree of increase was dependent on the length of time DMPA was used. Furthermore, it is encouraging that women who used NH contraception after DMPA discontinuation experienced a decrease in weight, total body fat, and percent body fat. These observations must be balanced against DMPA’s low failure rate and ease of use. Only by providing a complete picture can care providers help patients determine the optimal method for their use.
Condensation.
Body weight and fat significantly increase with depot medroxyprogesterone acetate use; however, reduction in weight and fat mass may occur after discontinuation when nonhormonal contraception is used.
Acknowledgments
This work was supported by the National Institute of Child Health & Human Development grants R01HD39883 and K24HD043659 to ABB, and General Clinical Research Centers (GCRC) program, National Center for Research Resources, NIH, M01RR000073.
Footnotes
This research was presented at the 75th Annual Meeting of the Central Association of Obstetricians and Gynecologists, New Orleans LA, Oct. 22-25, 2008.
References
- 1.Kaunitz AM, Miller PD, Rice VM, Ross D, McClung MR. Bone mineral density in women aged 25–35 years receiving depot medroxyprogesterone acetate: recovery following discontinuation. Contraception. 2006;74:90–9. doi: 10.1016/j.contraception.2006.03.010. [DOI] [PubMed] [Google Scholar]
- 2.Polaneczky M, Liblanc M. Long-term depot medroxyprogesterone acetate (Depo-Provera) use in inner-city adolescents. J Adolesc Health. 1998;23:81–8. doi: 10.1016/s1054-139x(98)00014-7. [DOI] [PubMed] [Google Scholar]
- 3.Templeman C, Boyd H, Hertweck SP. Depomedroxyprogesterone acetate use and weight gain among adolescents. J Pediatr Adolesc Gynecol. 2000;13:45–6. doi: 10.1016/s1083-3188(99)00039-x. [DOI] [PubMed] [Google Scholar]
- 4.Bahamondes L, Del Castillo S, Tabares G, Arce XE, Perrotti M, Petta C. Comparison of weight increase in users of depot medroxyprogesterone acetate and copper IUD up to 5 years. Contraception. 2001;64:223–5. doi: 10.1016/s0010-7824(01)00255-4. [DOI] [PubMed] [Google Scholar]
- 5.Clark MK, Dillon JS, Sowers M, Nichols S. Weight, fat mass, and central distribution of fat increase when women use depot-medroxyprogesterone acetate for contraception. Int J Obes (Lond) 2005;29:1252–8. doi: 10.1038/sj.ijo.0803023. [DOI] [PubMed] [Google Scholar]
- 6.Mia AR, Siddiqui NI, Islam MN, Khan MR, Shampa SS, Rukunuzzaman M. Effects of prolonged use of injectable hormonal contraceptive on serum lipid profile. Mymensingh Med J. 2005;14:19–21. [PubMed] [Google Scholar]
- 7.Taneepanichskul S, Reinprayoon D, Khaosadad P. Comparative study of weight change between long-term DMPA and IUD acceptors. Contraception. 1998;58:149–51. [Google Scholar]
- 8.Tuchman LK, Huppert JS, Huang B, Slap GB. Adolescent use of the monthly contraceptive injection. J Pediatr Adolesc Gynecol. 2005;18:255–60. doi: 10.1016/j.jpag.2005.05.004. [DOI] [PubMed] [Google Scholar]
- 9.Mangan SA, Larsen PG, Hudson S. Overweight teens at increased risk for weight gain while using depot medroxyprogesterone acetate. J Pediatr Adolesc Gynecol. 2002;15:79–82. doi: 10.1016/s1083-3188(01)00147-4. [DOI] [PubMed] [Google Scholar]
- 10.Espey E, Steinhart J, Ogburn T, Qualls C. Depo-provera associated with weight gain in Navajo women. Contraception. 2000;62:55–8. doi: 10.1016/s0010-7824(00)00144-x. [DOI] [PubMed] [Google Scholar]
- 11.Moore LL, Valuck R, McDougall C, Fink W. A comparative study of one-year weight gain among users of medroxyprogesterone acetate, levonorgestrel implants, and oral contraceptives. Contraception. 1995;52:215–9. doi: 10.1016/0010-7824(95)00189-h. [DOI] [PubMed] [Google Scholar]
- 12.Mukherjea M, Mukherjee P, Biswas R. Long-term contraception with Depo-Provera: a clinical evaluation. Int J Fertil. 1980;25:122–6. [PubMed] [Google Scholar]
- 13.Coney P, Washenik K, Langley RGB, DiGiovanna JJ, Harrison DD. Weight change and adverse event incidence with a low-dose oral contraceptive: two randomized, placebo-controlled trials. Contraception. 2001;63:297–302. doi: 10.1016/s0010-7824(01)00208-6. [DOI] [PubMed] [Google Scholar]
- 14.de Melo NR, Aldrighi JM, Faggion D, Jr., Reyes VR, Souza JB, Fernandes CE, et al. A prospective open-label study to evaluate the effects of the oral contraceptive Harmonet (gestodene75/EE20) on body fat. Contraception. 2004;70:65–71. doi: 10.1016/j.contraception.2003.10.016. [DOI] [PubMed] [Google Scholar]
- 15.Lloyd T, Beck TJ, Lin HM, Tulchinsky M, Eggli DF, Oreskovic TL, et al. Modifiable determinants of bone status in young women. Bone. 2002;30:416–21. doi: 10.1016/s8756-3282(01)00675-5. [DOI] [PubMed] [Google Scholar]
- 16.O’Connell KJ, Osborne LM, Westhoff C. Measured and reported weight change for women using a vaginal contraceptive ring vs. a low-dose oral contraceptive. Contraception. 2005;72:323–7. doi: 10.1016/j.contraception.2005.05.008. [DOI] [PubMed] [Google Scholar]
- 17.Berenson AB, Rahman M, Radecki Breitkopf C, Bi LX. Effects of depot medroxyprogesterone acetate and 20-microgram oral contraceptives on bone mineral density. Obstet Gynecol. 2008;112:788–79. doi: 10.1097/AOG.0b013e3181875b78. [DOI] [PMC free article] [PubMed] [Google Scholar]
- 18.Litaker MS, Barbeau P, Humphries MC, Gutin B. Comparison of Hologic QDR-1000/W and 4500W DXA scanners in 13- to 18-year olds. Obesity Res. 2003;11:1545–52. doi: 10.1038/oby.2003.206. [DOI] [PubMed] [Google Scholar]
- 19.Novotny R, Daida YG, Grove JS, Le Marchand L, Vijayadeva V. Asian adolescents have a higher trunk:peripheral fat ratio than Whites. J Nutr. 2006;136:642–7. doi: 10.1093/jn/136.3.642. [DOI] [PMC free article] [PubMed] [Google Scholar]
- 20.Schakel SF, Sievert YA, Buzzard IM. Sources of data for developing and maintaining a nutrient database. J Am Diet Assoc. 1988;88:1268–71. [PubMed] [Google Scholar]
- 21.World Health Organization . Smoking Questionnaire. MONICA Manual (1998-1999), Part III, Section 1. The WHO MONICA (Multinational Monitoring Trends in Cardiovascular Disease) Project; 1999. [Google Scholar]
- 22.National Cancer Institute . Diet History Questionnaire (DHQ) National Institutes of Health; Jul 28, 2000. [Google Scholar]
- 23.Liang K, Zeger SL. Longitudinal data analysis using generalized linear models. Biometrika. 1986;73:13–22. [Google Scholar]
- 24.Schwallie PC, Assenzo JR. Contraceptive use—efficacy study utilizing medroxyprogesterone acetate administered as an intramuscular injection once every 90 days. Fertil Steril. 1973;24:331–9. doi: 10.1016/s0015-0282(16)39669-8. [DOI] [PubMed] [Google Scholar]
- 25.Grueso E, Rocha M, Puerta M. Plasma and cerebrospinal fluid leptin levels are maintained despite enhanced food intake in progesterone-treated rats. Eur J Endocrinol. 2001;144:659–65. doi: 10.1530/eje.0.1440659. [DOI] [PubMed] [Google Scholar]
- 26.Toth MJ, Tchernof A, Sites CK, Poehlman ET. Effect of menopausal status on body composition and abdominal fat distribution. Int J Obes Relat Metab Disord. 2000;24:226–31. doi: 10.1038/sj.ijo.0801118. [DOI] [PubMed] [Google Scholar]
- 27.Bonny AE, Ziegler J, Harvey R, Debanne SM, Secic M, Cromer BA. Weight gain in obese and nonobese girls initiating depot medroxyprogesterone, oral contraceptive pills, or no hormonal contraceptive method. Arch Pediatr Adolesc Med. 2006;160:4045. doi: 10.1001/archpedi.160.1.40. [DOI] [PubMed] [Google Scholar]