

Abstract
Context
Body dysmorphic disorder (BDD) is a psychiatric disorder in which individuals are preoccupied with perceived defects in their appearance, often related to their face. Little is known about its pathophysiology, although early research provides evidence of abnormal visual processing.
Objective
To determine whether patients with BDD have abnormal patterns of brain activation when visually processing their own face with high, low, or normal spatial resolution.
Design
Case-control study.
Setting
A university hospital.
Participants
Seventeen right-handed medication-free subjects with BDD and 16 matched healthy control subjects.
Intervention
Functional magnetic resonance imaging while viewing photographs of face stimuli. Stimuli were neutral-expression photographs of the patient’s own face and a familiar face (control stimuli) that were unaltered, altered to include only high spatial frequency (fine spatial resolution), or altered to include only low spatial frequency (low spatial resolution).
Main Outcome Measure
Blood oxygen level–dependent signal changes in the BDD and control groups during each stimulus type.
Results
Subjects with BDD showed relative hyperactivity in the left orbitofrontal cortex and bilateral head of the caudate for the unaltered own-face vs familiar-face condition. They showed relative hypoactivity in the left occipital cortex for the low spatial frequency faces. Differences in activity in frontostriatal systems but not visual cortex covaried with aversiveness ratings of the faces. Severity of BDD symptoms correlated with activity in frontostriatal systems and visual cortex.
Conclusions
These results suggest abnormalities in visual processing and frontostriatal systems in BDD. Hypoactivation in the occipital cortex for low spatial frequency faces may indicate either primary visual system abnormalities for configural face elements or top-down modulation of visual processing. Frontostriatal hyperactivity may be associated both with aversion and with symptoms of obsessive thoughts and compulsive behaviors.
Body dysmorphic disorder (BDD) is a psychiatric disorder in which individuals are preoccupied with perceived appearance defects. These individuals believe that they look disfigured and ugly, and they have significant distress and functional impairment. Body dysmorphic disorder affects approximately 1% to 2% of the population1–4 and is associated with high lifetime rates of hospitalization (48%)5 and suicide attempts (22%–27.5%).5–7 An estimated 27% to 39% are delusional in their beliefs.8
Despite its prevalence and severity, little is known of its pathophysiology. Because of the paucity of research, it is unclear how to best conceptualize BDD. A leading hypothesis is that it is an obsessive-compulsive spectrum disorder,9 although there is also evidence that it may be related to social phobia, eating disorders, or delusional disorder.8,10–12 A better understanding of the neurobiology will shed light on how to conceptualize BDD and subsequently guide interventions.
Thus far, clinical observation and neuropsychological data suggest that abnormal information processing may underscore the perceptual and visuospatial abnormalities in BDD. Clinically, these individuals focus primarily on details of their appearance at the expense of global or configural aspects. A neuropsychological study using the Rey-Osterrieth Complex Figure Test demonstrated that patients with BDD performed poorly relative to control subjects owing to differences in organizational strategies, including selective recall of details instead of larger organizational design features.13 Individuals with BDD may also have abnormalities in own-face processing as evidenced by a study in which they perceived distortions that were not actually present.14
We previously performed a functional magnetic resonance imaging (fMRI) study in BDD that examined visual processing of others’ faces to investigate general face-processing abnormalities.15 Individuals with BDD as compared with healthy control subjects demonstrated abnormal left hemisphere hyperactivity in an extended face-processing network including temporal, parietal, and inferior frontal gyrus regions as well as abnormal amygdala activation. Predominant left hemisphere activity suggests greater detail encoding and analysis relative to holistic and configural processing. This supports the hypothesis that patients with BDD have aberrant visual information processing, which may represent a core pathophysiological process contributing to the symptoms. These verity of reported perceptual distortions for their own appearance would suggest that similar or more severe visual processing abnormalities might be present. However, to our knowledge no imaging study has examined own-face processing in BDD.
The objective of the current study was to determine whether individuals with BDD have abnormal patterns of brain activation relative to healthy control subjects when viewing their face. Although BDD can involve concerns about any appearance feature, most individuals with BDD have concerns involving the face or head area.16
We designed 3 types of own-face stimuli to parse out different elements of visual processing. Detailed analysis of facial traits (eg, blemishes, hairs, or edges of the nose or eyes) relies on fine visual resolution, which is conveyed by high spatial frequency (HSF) information.17,18 Configural aspects of faces (ie, spatial relationships between facial features and general shape of the face19) are primarily conveyed by low spatial frequency (LSF) information.20,21 Matching tasks with faces digitally filtered to produce HSF or LSF have been previously used to investigate visual processing in healthy control subjects22,23 and to identify abnormalities in configural processing in autism.24 We therefore used photographs of faces that were either unaltered/normal spatial frequency (NSF) or altered to include only HSF or LSF information in order to functionally dissect visual processing elements. Analyzing visual processing in relation to frequency domains is relevant given evidence from the previous fMRI study and neuropsychological testing showing imbalances for detail vs holistic/configural processing in BDD. Using own-face stimuli adds the potentially important factor of emotional arousal, which in turn may influence visual processing systems, particularly in the ventral visual stream.25–28
We hypothesized that this paradigm would elicit different patterns of brain activation in the BDD group relative to control subjects within visual processing regions, most likely in the posterior ventral visual stream. In the previous fMRI study with others’ faces using a similar paradigm, the greater activity in the BDD group was more pronounced for the NSF and LSF faces. In the current study, we similarly expected greater activity in the BDD group for the NSF and LSF faces but not the HSF faces. We also predicted that subjective aversiveness of the faces would contribute to these differences in brain activation patterns between groups. In addition to a whole-brain analysis, we performed anatomical region-of-interest (ROI) analyses. These were to test our hypotheses of hyperactivity in the inferior frontal gyrus, which is important for own-face processing (and was found to be hyperactive in the previous study), and in emotional processing regions of the amygdala and insula owing to the likely distressing experience of viewing one’s face.
METHODS
SUBJECTS
The University of California, Los Angeles Institutional Review Board approved the protocol for the study. Seventeen subjects with BDD and 16 healthy control subjects, aged 20 to 48 years, provided informed consent. One subject with BDD and 1 control subject had participated in the previous BDD study.15 Subjects with BDD and control subjects were recruited from the community and matched by sex, age, and level of education. All were right-handed as determined by the Edinburgh Handedness Inventory.29 Subjects with BDD met DSM-IV criteria for BDD, diagnosed by one of us (J.D.F.) with clinical expertise with this population. Diagnoses were made using the Body Dysmorphic Disorder Module,30 a reliable diagnostic module modeled after the Structured Clinical Interview for DSM Disorders. In addition, we performed a clinical psychiatric evaluation and screened participants with the Mini-International Neuropsychiatric Interview.31 All subjects with BDD were required to have a score of 20 or higher on the BDD version of the Yale-Brown Obsessive Compulsive Scale (BDD-YBOCS).32 We allowed subjects with delusional beliefs.
Exclusion criteria included substance abuse, neurological disorder, pregnancy, or any current medical disorder that may affect cerebral metabolism. We excluded subjects with any concurrent Axis I disorder besides dysthymia, major depressive disorder, or generalized anxiety disorder. As depression and anxiety are so frequently comorbid in this population, we believed that a sample excluding these would not be representative. We excluded subjects whom the investigator (J.D.F.) judged were suicidal. In addition to the BDD-YBOCS, we also administered the 17-item Hamilton Depression Rating Scale33 and the Hamilton Anxiety Rating Scale.34
Participants were free from psychoactive medications for 8 weeks or longer prior to the study and were not receiving cognitive behavioral therapy. We only included participants with normal or corrected vision as verified by the Snellen eye chart.
STIMULI
We acquired digital photographs of participants’ faces from a frontal view with neutral expression, and we used Adobe Photoshop CS3 software (Adobe Systems Inc, San Jose, California) to create standard black backgrounds for the face and neck and to convert to grayscale. We created HSF and LSF images as previously described15 and normalized luminosity across stimuli (Figure 1). In addition, we used unaltered photographs (NSF). A photograph of a familiar famous male actor was used as a control condition, matched for size and luminosity. We chose the particular actor’s photograph based on 100% familiarity and a medium degree of attractiveness (mean [SD] rating of 4.25 [1.75] out of 10) as tested prior to the experiment in 10 healthy volunteers. Three different categories of own faces and familiar faces composed the tasks: (1) NSF, (2) HSF, or (3) LSF. A baseline control condition consisted of gray ovals approximately the same size as the faces and of the same luminosity. Subjects wore fMRI-compatible goggles to view the stimuli. If subjects wore eyeglasses, appropriate corrective goggle lenses were used. We used MacStim version 3.0 software (White Ant Occasional Publishing, Melbourne, Australia) to present stimuli and record responses.
Figure 1.
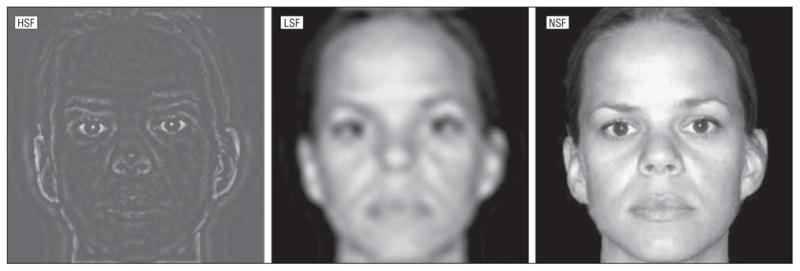
Example of own-face stimuli. HSF indicates high spatial frequency; LSF, low spatial frequency; and NSF, normal spatial frequency.
TASKS
Subjects viewed own-face, familiar-face, and oval images while in the MRI scanner. They were instructed to push the button on the button box with their right index finger when the face or oval image disappeared from the goggles’ screen to ensure that they attended to the image for its full duration.
Faces appeared for 3 seconds, followed by a 1-second interstimulus interval. Stimuli were arranged in clusters of NSF, HSF, and LSF, counterbalanced between subjects. Within each cluster, 12 of each of the same own-face, familiar-face, and oval images were presented in an event-related design. The order of the own-face and familiar-face stimuli was randomized and jittered with respect to the oval within each cluster; the oval randomly occurred for either 3, 6, or 9 seconds, while the faces all appeared for 3 seconds. This was to minimize anticipation of and habituation to the stimuli. We used Optseq (http://surfer.nmr.mgh.harvard.edu/optseq/), a genetic algorithm, to create jittered presentation timing with the highest efficiency. The total time for each run was 7 minutes. There were 2 runs, the second presented in a different order.
EMOTIONAL ASSESSMENTS
To assess elements of subjects’ emotional experience, we obtained subjective ratings of the aversiveness of the face stimuli. We obtained these after the experiment because of the possibility of modulation of arousal as a result of labeling of emotions during the experiment.35 Subjects rated NSF, HSF, and LSF photographs of own and familiar faces in terms of aversiveness on a Likert scale from 0 to 10. They were instructed as follows: “Please rate each face on a scale of 0 to 10 in terms of aversiveness, that is, to what degree you feel a sense of disgust or repulsion when you view it.”
FUNCTIONAL MRI
We used a 3-T Allegra MRI scanner (Siemens Medical Solutions USA, Inc, Malvern, Pennsylvania) to evaluate blood oxygen level–dependent contrast using T2*-weighted echo planar imaging gradient-echo pulse sequence (repetition time, 2.0 seconds; echo time, 35 milliseconds; flip angle, 90°; matrix, 64 × 64; field of view, 24 × 24 cm; in-plane voxel size, 3.125 × 3.125 mm; slice thickness, 3 mm; 1-mm intervening spaces; and 28 total slices). We obtained matched-bandwidth T1-weighted images to provide detailed anatomy during structural image acquisition.
Image processing included motion correction, skull stripping, spatial smoothing of a 5-mm full-width half-maximum gaussian kernel, mean-based intensity normalization of all volumes by the same factor, and high-pass temporal filtering. We coregistered functional images of each subject to corresponding structural images in native space and registered structural images to structural standard images, defined by the Montreal Neurological Institute average of 152 standard brains.
STATISTICAL ANALYSIS
Behavioral Data
We used a 2-sample t test to compare response rates between groups, defined as the number of times subjects pushed the button after face or oval stimuli divided by the total number of stimuli. A 2-way repeated-measures analysis of variance was used to compare aversiveness ratings, with group as the between-subjects factor and NSF, HSF, or LSF faces as the within-subjects factor.
Functional Neuroimaging Data
We used FMRI Expert Analysis Tool version 5.4 software, part of the Oxford Centre for Functional Magnetic Resonance Imaging of the Brain (FMRIB) Software Library (http://www.fmrib.ox.ac.uk/fsl). For within-group analyses, we performed a random-effects analysis with subject as the random factor. We modeled the hemodynamic response function using a convolution of the experimental paradigms of each condition vs control task with the canonical hemodynamic response function and its temporal derivative.36 We analyzed the normalized data with multiple regression by using 6 regressors to model hemodynamic changes associated with the HSF, LSF, and NSF tasks, each contrasted to the familiar-face task and the oval task.
Contrasts
The following contrasts were used: (1) NSF own face vs familiar face; (2) HSF own face vs familiar face; (3) LSF own face vs familiar face; (4) NSF own face vs ovals; (5) HSF own face vs ovals; and (6) LSF own face vs ovals.
Model fitting generated whole-brain images in native space of parameter estimates and corresponding variance, representing average signal change during each contrast. We used the FMRIB Improved Linear Model for time-series statistical analysis with local autocorrelation correction.37 We thresholded Z statistic images using clusters determined by Z > 2.0 and a (corrected) cluster significance threshold of P=.05.38
For between-group analyses, we directly compared subjects with BDD and control subjects using a voxelwise mixed-effects analysis. After the within-group analyses, we used the FMRIB Local Analysis of Mixed Effects stage 1 only.39,40 We thresholded Z statistic images using clusters determined by Z > 2.0 and a (corrected) cluster significance threshold of P=.05.38 A 2-sample t test identified group mean differences in activity at each voxel.
To investigate the relationship between symptom severity and regional brain activation, we entered results from the within-group analysis into a higher-level analysis with de-meaned BDD-YBOCS scores as a separate covariate of interest. This produced a voxelwise map of regions whose activity positively correlated with BDD symptom severity. Further, we used the significant regions to create scatter plots of blood oxygen level–dependent signal change percentage as a function of BDD-YBOCS scores. These were to determine more specifically the relationship between severity of BDD symptoms and regional brain activation and whether outliers whose effects could bias these estimates were present.
To investigate how subjects’ experiences of aversion related to patterns of brain activation for between-group differences, we entered de-meaned aversiveness ratings for each face type for all subjects into the general linear model as covariates in addition to investigating the ratings as covariates of interest.
ROI Analyses
To test our a priori hypotheses in the amygdala, insula, and left inferior frontal gyrus, we performed anatomical ROI analyses with the FMRIB Software Library. Masks for these regions were obtained from the Harvard-Oxford probabilistic structural atlases supplied with the FMRIB Software Library. We calculated the mean signal change percentage in each region and compared between groups using 2-sample t tests. For post hoc signal change percentage analyses, we created a set of spherical ROIs (6-mm radii) at the local maxima for significant clusters from the between-group analyses. Parameter estimate data were then extracted from each ROI for each subject using FMRIB Software Library command line tools.41
RESULTS
Table 1 summarizes demographic and psychometric data. One subject with BDD had comorbid major depressive disorder, 1 had dysthymic disorder, 2 had generalized anxiety disorder, 4 had both major depressive disorder and generalized anxiety disorder, and 1 had both dysthymic disorder and generalized anxiety disorder. The BDD symptoms were the primary concern in every subject. All subjects had preoccupations with perceived facial defects.
Table 1.
Demographic Characteristics and Psychometric Scores
| Characteristic | BDD Group (n=17) | Control Group (n=16) | P Valuea |
|---|---|---|---|
| Age, mean (SD), y | 29.18 (7.4) | 27.38 (5.3) | .43 |
| Female/male, No. | 9/8 | 8/8 | >.99 |
| Right-handedness, No. | 17 | 16 | >.99 |
| Education, mean (SD), y | 15.35 (2.7) | 16.94 (2.3) | .08 |
| BDD-YBOCS score, mean (SD) | 28.82 (5.1) | NA | NA |
| HDRS-17 score, mean (SD) | 10.88 (7.5) | 1.44 (1.5) | <.001 |
| HARS score, mean (SD) | 12.94 (8.0) | 1.56 (1.4) | <.001 |
Abbreviations: BDD, body dysmorphic disorder; BDD-YBOCS, BDD version of the Yale-Brown Obsessive Compulsive Scale; HARS, Hamilton Anxiety Rating Scale; HDRS-17, 17-item Hamilton Depression Rating Scale; NA, not applicable.
From t test for all comparisons except sex and right-handedness (χ2 test).
BEHAVIORAL DATA
Response rates were high in both groups and were not significantly different: 98.5% for the BDD group and 97.1% for the control group (t31=1.48; P =.15).
Mean (SD) aversiveness ratings across all own-face stimuli were higher in the subjects with BDD (5.41 [1.97]) than in the healthy control subjects (2.15 [1.43]) (F1,31=29.24; P < .001). There were no statistically significant face stimulus type effects across participants (F2,62=0.15; P =.86) or group × face stimulus type interaction (F2,62=2.41; P =.10) (Figure 2).
Figure 2.

Mean aversiveness ratings of own-face stimuli on a Likert scale of 0 to 10. There was a significant group effect (F1,31=29.24; P < .001) but a nonsignificant stimulus type effect (F2,62=0.15; P =.86) and a nonsignificant group × stimulus interaction effect (F2,62=2.41; P =.10). Error bars indicate standard errors of the mean; BDD, body dysmorphic disorder; NSF, normal spatial frequency; HSF, high spatial frequency; and LSF, low spatial frequency.
FUNCTIONAL MRI
Voxelwise Analyses
Within Groups
For all tasks, the subjects with BDD and healthy control subjects activated the bilateral extrastriate visual cortex (Brodmann area 18) and bilateral fusiform gyrus.
Between Groups
There were significant between-group activations for NSF own-face vs familiar-face and LSF own-face vs oval contrasts only.
The BDD group demonstrated greater activation than the control group for the NSF own-face vs familiar-face contrast in the left orbitofrontal cortex (OFC) and the bilateral head of the caudate (Figure 3A and Table 2). Using Hamilton Anxiety Rating Scale or 17-item Hamilton Depression Rating Scale scores as covariates did not change the activation patterns in these regions, although Z scores were lowered slightly.
Figure 3.
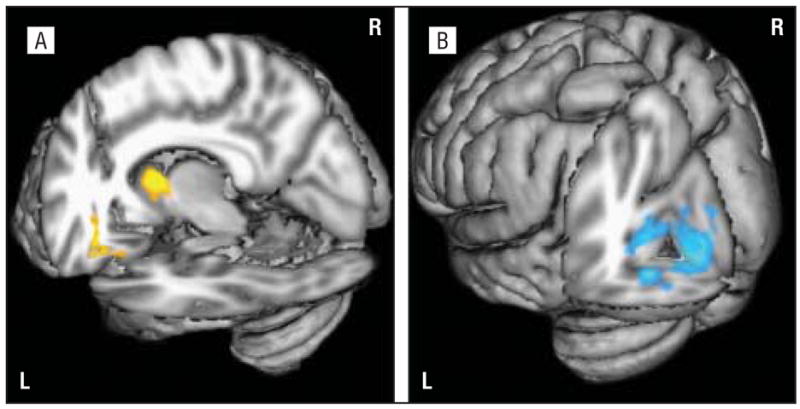
Significant differences in regional brain activity between groups. A, Regional brain activity is greater for subjects with body dysmorphic disorder than for control subjects for normal spatial frequency own-face vs familiar-face contrast in the caudate and left orbitofrontal cortex. B, Regional brain activity is greater for control subjects than for subjects with body dysmorphic disorder for low spatial frequency own-face vs oval contrast in the left visual cortex. L indicates left; R, right.
Table 2.
Local Maxima for Significant Between-Group Activations
| Contrast and Region | Z Score | x, y, z Coordinates |
|---|---|---|
| NSF own-face vs familiar-face stimulia | ||
| Right caudate | 3.63 | 12, 8, 4 |
| Left caudate | 2.80 | −10, 16, 2 |
| Left orbitofrontal cortex | 3.29 | −26, 28, −18 |
| LSF own-face vs oval stimulib | ||
| Left lingual gyrus | 3.97 | −6, −88, −4 |
| Left occipital pole | 3.64 | −10, −90, −2 |
| Left occipital fusiform gyrus | 3.45 | −22, −78, −8 |
Abbreviations: LSF, low spatial frequency; NSF, normal spatial frequency.
Regional brain activity is greater for subjects with body dysmorphic disorder than for control subjects.
Regional brain activity is greater for control subjects than for subjects with body dysmorphic disorder.
The control group demonstrated greater activation than the BDD group for the LSF own-face vs oval contrast in the left occipital cortex (Figure 3B and Table 2). Specifically, there were local maxima of activation in the left intracalcarine cortex and occipital pole (Brodmann areas 17 and 18), left lingual gyrus (Brodmann area 18), and left occipital fusiform gyrus (Brodmann area 18).
To understand how familiar-face processing contributed to the own-face vs familiar-face contrast findings, we analyzed familiar-face vs oval contrasts in the regions found to be significantly different from the voxel-wise analysis. There were nonsignificant differences in mean signal change percentages between groups for NSF faces (significant differences were only evident for the own-face vs familiar-face contrast) (Figure 4A). For LSF own-face vs oval and familiar-face vs oval contrasts, mean signal change percentages were significantly greater in the control group than in the BDD group (Figure 4B).
Figure 4.

Signal change percentages for normal spatial frequency (A) and low spatial frequency (B) own-face and familiar-face stimuli in brain regions found to be different between groups, each contrasted to the low-level baseline (oval). P values indicate significant differences between groups, which were evident for own-face vs familiar-face contrasts (A) and own-face vs oval contrasts (B). *P<.005; †P<.05. A, Effect sizes for significant normal spatial frequency own-face vs familiar-face contrasts are as follows: right caudate, 0.40; left caudate, 0.11; and left orbitofrontal cortex (OFC), 0.16. B, Effect sizes for significant low spatial frequency own-face vs oval contrasts are as follows: left lingual gyrus, −1.37; left occipital pole, −1.45; and left occipital fusiform gyrus, −1.37. Error bars indicate standard errors of the mean; BDD, body dysmorphic disorder.
Whole-Brain Regression Analysis With BDD-YBOCS
Severity of BDD symptoms was positively associated with activation in the right OFC, right head of the caudate, right precentral and postcentral gyri, and right dorsal occipital cortex for the NSF own-face vs familiar-face contrast (Figure 5). Symptom severity was negatively associated with activity in the left dorsal occipital cortex and the right lateral occipital cortex for the LSF own-face vs oval contrast. Using regions that were significantly different between groups from the NSF own-face vs familiar-face contrast as a mask for the regression analysis (Z statistic images thresholded at P=.05, uncorrected), symptom severity was positively associated with activity in the bilateral head of the caudate and the left OFC.
Figure 5.
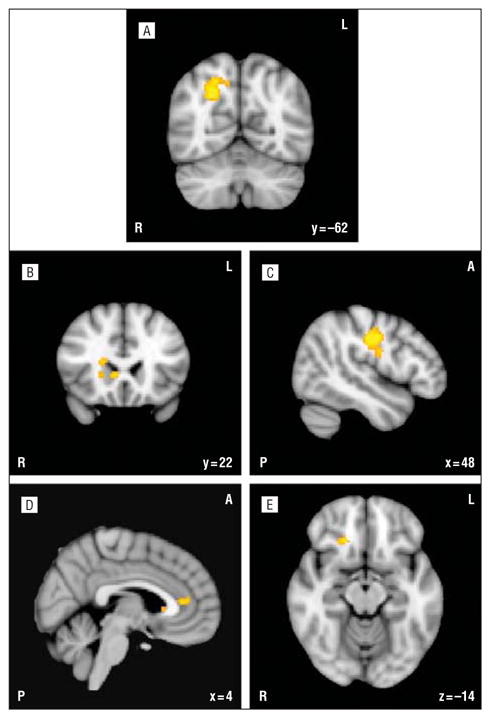
Regions positively correlated with body dysmorphic disorder symptom severity as measured by the body dysmorphic disorder version of the Yale-Brown Obsessive Compulsive Scale. Representative slices depict activations in the right visual cortex (A), right caudate (B), right precentral and postcentral gyri (C), right anterior cingulate gyrus (D), and right orbitofrontal cortex (E). R indicates right; L, left; P, posterior; and A, anterior.
For these regions found to be positively correlated with symptom severity from the whole-brain regression analysis, we plotted blood oxygen level–dependent signal change percentages against individual BDD-YBOCS scores (Figure 6). All regions demonstrated monotonic relationships between signal change percentages and BDD-YBOCS scores, with no obvious outliers. The BDD-YBOCS scores explained the most variability in brain signal in the right occipital lobe (R2=0.69; F1,15=34.00; P < .001), followed by the precentral and postcentral gyri (R2=0.58; F1,15=21.01; P < .001), caudate (R2=0.50; F1,15=14.84; P=.002), OFC (R2=0.46; F1,15=12.72; P =.003), and anterior cingulate gyrus (R2=0.29; F1,15=6.21; P =.02).
Figure 6.

Scatter plots representing signal change percentage as a function of scores on the body dysmorphic disorder version of the Yale-Brown Obsessive Compulsive Scale (BDD-YBOCS) in regions found to be positively correlated with symptom severity (normal spatial frequency own-face vs familiar-face contrast). OFC indicates orbitofrontal cortex.
Regression Analyses With Aversiveness Ratings
For the NSF own-face vs familiar-face contrast, using aversiveness as a covariate for the between-group comparison resulted in there no longer being significant differences between groups in the OFC or caudate, and relative hypoactivation for the BDD group in the right visual cortex (precuneus and cuneus) emerged. When aversiveness ratings were covaried in the LSF own-face vs oval contrast, the findings of hypoactivation in the occipital cortex for the BDD group were unchanged. There were still no significant differences between groups for the other contrasts.
When directly examining the relationship between aversiveness ratings and brain activity within the BDD group, there were significant results only for the LSF own-face vs oval contrast. These results suggested inverse relationships between degree of aversiveness and activity in the bilateral superior lateral occipital cortex, left superior parietal lobule, bilateral precuneus, and right postcentral gyrus.
A Priori ROI Analyses
There were no significant differences in signal change percentage between groups in the amygdala, inferior frontal gyrus, or insula.
COMMENT
Individuals with BDD have abnormal brain activation patterns when viewing their own face, showing hypoactivity in primary and secondary visual processing regions for LSF faces and hyperactivity in frontostriatal systems for NSF faces. Similarly, severity of BDD symptoms correlated with activity in frontostriatal and visual processing systems. Subjective aversiveness ratings of faces appeared to explain between-group differences in frontostriatal but not visual processing regions.
VISUAL PROCESSING IN BDD
As hypothesized, individuals with BDD demonstrated abnormal brain activity in visual processing regions when viewing their own face (although not exclusively in the ventral visual stream). This occurred for the LSF faces, which may indicate aberrant processing specifically for this type of spatial frequency information.
Abnormal activation in primary and secondary visual cortical regions suggests aberrant processing of configural and holistic information, which the LSF images convey. This may indicate a relative deficit of dorsal-stream magnocellular pathway42 activity, which normally provides a low-resolution template of the visual image.43–45 Clinically this may account for the impaired ability to perceive the visual gestalt, contributing to distorted perceptions of the individuals’ appearance when viewing their face. The individuals may primarily perceive details and are impaired in their ability to contextualize them configurally or holistically. The fact that patterns of hypoactivation relative to healthy control subjects for the familiar-face vs oval contrast were similar to those for the own-face vs oval contrast suggests aberrant activity patterns for faces in general.
These findings may represent primary visual processing abnormalities or may be the result of top-down modulation. The limited temporal resolution of fMRI prohibits certainty about which is the case. However, in general, primary visual cortical regions (ie, the intracalcarine cortex and occipital pole) are less prone to top-down modulation than secondary visual processing regions.46 In addition, the emotional experience of aversion to the faces did not explain the group differences in visual cortical regions for LSF images, and when controlled for, right occipital hypoactivation emerged for NSF images. These both suggest primary rather than top-down influences. Of course, it is possible that both may be operating in BDD.
To our knowledge, the only other study to examine the neurobiology of visual processing in BDD was the previous study of other-face processing.15 In that study, the BDD group similarly demonstrated relative hypoactivation in the left occipital cortex. However, it occurred for NSF faces, with local maxima in the bilateral cuneus and left middle occipital gyrus.15 In the current study, relative hypoactivation in the cuneus and precuneus emerged when controlling for aversiveness, although on the right. Left hemispheric dominance observed in the other-face study was not evident in this study, which could be owing to the fact that, in general, recognition of one’s own face compared with unfamiliar faces primarily activates right hemispheric regions.47,48
FRONTOSTRIATAL ABNORMALITIES
Significant group differences in the OFC and caudate suggest frontostriatal hyperactivity in BDD. Frontostriatal circuits mediate inhibitory control, mediate flexibility in response, and guide behavior based on action-outcome associations.49–51 Multiple baseline and symptom provocation functional neuroimaging studies have demonstrated that the OFC and head of the caudate are hyperactive in subjects with obsessive-compulsive disorder relative to control subjects.52–55 In a meta-analysis addressing this, the OFC and bilateral head of the caudate in subjects with obsessive-compulsive disorder were the only regions that significantly differed from those in control subjects. Moreover, this pattern has not been found in symptom provocation studies of other disorders such as posttraumatic stress disorder or simple phobia or in healthy control subjects.56–58 In conjunction with these studies, the results of the current study are therefore preliminary evidence of a possible similarity in functional neuroanatomy between BDD and obsessive-compulsive disorder. However, future studies of brain pathophysiology that directly compare BDD and obsessive-compulsive disorder groups are needed to further investigate this relationship.
In subjects with BDD, the pattern of obsessive thoughts and compulsive behaviors is often triggered by viewing their reflection or as a result of internally generated thoughts of their appearance. Hyperactivity in the OFC and caudate in this study was significant between groups for the unaltered (NSF) faces but not for the LSF or HSF faces. That this specific stimulus type triggered activity in orbitofrontal-striatal circuits (positively correlated with symptom severity) may be due to the fact that the NSF face as opposed to the altered ones most resembles the individual’s own reflected image, which typically triggers obsessive thoughts and compulsive behaviors. (It is not clear why subjects with BDD and control subjects demonstrated decreased activation in the caudate for own and familiar faces relative to the oval control task; although speculative, it is possible that the relatively low visual content of the oval allowed the subjects to allocate more attention to the motor aspects of the task.)
Whole-brain regression analyses with BDD symptom ratings revealed associations with activity in similar frontostriatal and visual processing systems, which monotonically increased with increasing symptom severity. The strength of the correlations in these regions and the fact that there were neither strong outliers nor clusters of individuals with similar activation values support the conceptualization of BDD as a dimensional construct. In fact, individuals with BDD in the lower range of BDD-YBOCS scores appear to show patterns of minimal activation or deactivation relative to the control task, similar to what was observed in the healthy control subjects (Figure 6).
EMOTIONAL REACTION TO FACES
Subjects’ aversiveness ratings of faces allowed inferences about emotional arousal during the scan. As a covariate of noninterest, aversiveness appeared to explain between-group differences in frontostriatal regions for the NSF faces. This suggests that frontostriatal hyperactivity may be associated both with more enduring symptoms as measured by the BDD-YBOCS and with more immediate emotional reactions as measured by the face aversiveness ratings.
When examined as a covariate of interest, aversiveness was associated with decreased activity in dorsal occipital regions for the LSF own-face vs oval task. This suggests that greater emotional arousal (aversion) is associated with lesser activity in the dorsal visual stream, which is responsible for configural and holistic processing. Surprisingly, aversiveness was not significantly associated with activity in the insula or amygdala, nor was insula or amygdala hyperactivity evident in the BDD group as we hypothesized.
LIMITATIONS
The sample size may have resulted in insufficient power to detect smaller-magnitude differences in activations. Using anatomically defined regions for the a priori ROI analyses may have resulted in decreased ability to detect small differences because these relatively large regions are heterogeneous in function and likely contain subregions not activated by the stimuli. Signal dropout due to susceptibility artifacts was low by visual inspection, although it nevertheless may have reduced the blood oxygen level–dependent signal in regions such as the amygdala and OFC. Because the design of the study was event related (to minimize anticipation and habituation) and because of the fact that self-emotional labeling can itself influence brain activation patterns,35 we did not acquire a measure of subjective anxiety for each stimulus type. It is therefore unclear whether anxiety contributed to differences in brain activation between groups. The fact that the familiar-face control stimulus was of a single gender and not matched to each subject’s gender could have presented a confound if there was a groupwise differential response depending on gender in subjects with BDD vs control subjects.59 Last, effect sizes for one of the main contrasts of interest, the NSF own-face vs familiar-face contrast, were small.
CONCLUSIONS
Individuals with BDD demonstrate visual processing and frontostriatal abnormalities when viewing their own face. Moreover, brain activity in these systems correlates with symptom severity. The frontostriatal system findings, especially OFC and caudate hyperactivity, suggest possible similar neural pathophysiology to obsessive-compulsive disorder. They also suggest at least a 2-part model. Abnormalities in visual processing systems may contribute distorted perceptual input to frontostriatal systems, which may be associated with the experience of aversion, and that may subsequently mediate obsessive thought patterns and urges to perform compulsive behaviors. This preliminary model needs to be further tested in future studies.
Acknowledgments
Funding/Support: This work was supported by grant K23 MH079212-01A1 from the National Institute of Mental Health (Dr Feusner), a grant from the Obsessive Compulsive Foundation (Dr Feusner), a faculty research grant from the University of California, Los Angeles (Dr Feusner), grants RR12169, RR13642, and RR00865 from the National Center for Research Resources, National Institutes of Health, and grants from the Brain Mapping Medical Research Organization, Brain Mapping Support Foundation, Pierson-Lovelace Foundation, The Ahmanson Foundation, William M. and Linda R. Dietel Philanthropic Fund at the Northern Piedmont Community Foundation, Tamkin Foundation, Jennifer Jones-Simon Foundation, Capital Group Companies Charitable Foundation, Robson Family, and Northstar Fund.
Role of the Sponsor: The contents of this article are solely the responsibility of the authors and do not necessarily represent the official views of the National Center for Research Resources or the National Institutes of Health.
Footnotes
Author Contributions: Dr Feusner had full access to all of the data in the study and takes responsibility for the integrity of the data and the accuracy of the data analysis.
Financial Disclosure: None reported.
Previous Presentation: This paper was presented in part at the 2008 Annual Meeting of the American College of Neuropsychopharmacology; December 8, 2008; Scottsdale, Arizona.
References
- 1.Otto MW, Wilhelm S, Cohen LS, Harlow BL. Prevalence of body dysmorphic disorder in a community sample of women. Am J Psychiatry. 2001;158(12):2061–2063. doi: 10.1176/appi.ajp.158.12.2061. [DOI] [PubMed] [Google Scholar]
- 2.Faravelli C, Salvatori S, Galassi F, Aiazzi L, Drei C, Cabras P. Epidemiology of somatoform disorders: a community survey in Florence. Soc Psychiatry Psychiatr Epidemiol. 1997;32(1):24–29. doi: 10.1007/BF00800664. [DOI] [PubMed] [Google Scholar]
- 3.Rief W, Buhlmann U, Wilhelm S, Borkenhagen A, Brahler E. The prevalence of body dysmorphic disorder: a population-based survey. Psychol Med. 2006;36(6):877–885. doi: 10.1017/S0033291706007264. [DOI] [PubMed] [Google Scholar]
- 4.Koran LM, Abujaoude E, Large MD, Serpe RT. The prevalence of body dysmorphic disorder in the United States adult population. CNS Spectr. 2008;13(4):316–322. doi: 10.1017/s1092852900016436. [DOI] [PubMed] [Google Scholar]
- 5.Phillips KA, Diaz SF. Gender differences in body dysmorphic disorder. J Nerv Ment Dis. 1997;185(9):570–577. doi: 10.1097/00005053-199709000-00006. [DOI] [PubMed] [Google Scholar]
- 6.Phillips KA, Coles ME, Menard W, Yen S, Fay C, Weisberg RB. Suicidal ideation and suicide attempts in body dysmorphic disorder. J Clin Psychiatry. 2005;66(6):717–725. doi: 10.4088/jcp.v66n0607. [DOI] [PubMed] [Google Scholar]
- 7.Veale D, Boocock A, Gournay K, Dryden W, Shah F, Willson R, Walburn J. Body dysmorphic disorder: a survey of fifty cases. Br J Psychiatry. 1996;169(2):196–201. doi: 10.1192/bjp.169.2.196. [DOI] [PubMed] [Google Scholar]
- 8.Phillips KA. Psychosis in body dysmorphic disorder. J Psychiatr Res. 2004;38(1):63–72. doi: 10.1016/s0022-3956(03)00098-0. [DOI] [PubMed] [Google Scholar]
- 9.Hollander E, Wong C. Obsessive-compulsive spectrum disorders. J Clin Psychiatry. 1995;56(suppl 4):3–6. [PubMed] [Google Scholar]
- 10.Wilhelm S, Otto MW, Zucker BG, Pollack MH. Prevalence of body dysmorphic disorder in patients with anxiety disorders. J Anxiety Disord. 1997;11(5):499–502. doi: 10.1016/s0887-6185(97)00026-1. [DOI] [PubMed] [Google Scholar]
- 11.Pinto A, Phillips KA. Social anxiety in body dysmorphic disorder. Body Image. 2005;2(4):401–405. doi: 10.1016/j.bodyim.2005.10.003. [DOI] [PMC free article] [PubMed] [Google Scholar]
- 12.Rabe-Jablonska Jolanta J, Sobow Tomasz M. The links between body dysmorphic disorder and eating disorders. Eur Psychiatry. 2000;15(5):302–305. doi: 10.1016/s0924-9338(00)00398-9. [DOI] [PubMed] [Google Scholar]
- 13.Deckersbach T, Savage C, Phillips K, Wilhelm S, Buhlmann U, Rauch SL, Baer L, Jenike MA. Characteristics of memory dysfunction in body dysmorphic disorder. J Int Neuropsychol Soc. 2000;6(6):673–681. doi: 10.1017/s1355617700666055. [DOI] [PubMed] [Google Scholar]
- 14.Yaryura-Tobias JA, Neziroglu F, Chang R, Lee S, Pinto A, Donohue L. Computerized perceptual analysis of patients with body dysmorphic disorder: a pilot study. CNS Spectr. 2002;7(6):444–446. doi: 10.1017/s1092852900017958. [DOI] [PubMed] [Google Scholar]
- 15.Feusner JD, Townsend J, Bystritsky A, Bookheimer S. Visual information processing of faces in body dysmorphic disorder. Arch Gen Psychiatry. 2007;64(12):1417–1425. doi: 10.1001/archpsyc.64.12.1417. [DOI] [PubMed] [Google Scholar]
- 16.Phillips KA. The Broken Mirror. New York, NY: Oxford University Press; 2005. [Google Scholar]
- 17.Schyns PG, Oliva A. Dr Angry and Mr Smile: when categorization flexibly modifies the perception of faces in rapid visual presentations. Cognition. 1999;69(3):243–265. doi: 10.1016/s0010-0277(98)00069-9. [DOI] [PubMed] [Google Scholar]
- 18.Norman J, Ehrlich S. Spatial frequency filtering and target identification. Vision Res. 1987;27(1):87–96. doi: 10.1016/0042-6989(87)90145-3. [DOI] [PubMed] [Google Scholar]
- 19.Carey S, Diamond R. Are faces perceived as configurations more by adults than by children? Vis Cogn. 1994;1(2–3):253–274. [Google Scholar]
- 20.Sergent J. Influence of task and input factors on hemispheric involvement in face processing. J Exp Psychol Hum Percept Perform. 1985;11(6):846–861. doi: 10.1037//0096-1523.11.6.846. [DOI] [PubMed] [Google Scholar]
- 21.Costen NP, Parker DM, Craw I. Effects of high-pass and low-pass spatial filtering on face identification. Percept Psychophys. 1996;58(4):602–612. doi: 10.3758/bf03213093. [DOI] [PubMed] [Google Scholar]
- 22.Collin CA, Therrien M, Martin C, Rainville S. Spatial frequency thresholds for face recognition when comparison faces are filtered and unfiltered. Percept Psychophys. 2006;68(6):879–889. doi: 10.3758/bf03193351. [DOI] [PubMed] [Google Scholar]
- 23.Liu CH, Collin CA, Rainville SJ, Chaudhuri A. The effects of spatial frequency overlap on face recognition. J Exp Psychol Hum Percept Perform. 2000;26(3):956–979. doi: 10.1037//0096-1523.26.3.956. [DOI] [PubMed] [Google Scholar]
- 24.Deruelle C, Rondan C, Gepner B, Tardif C. Spatial frequency and face processing in children with autism and Asperger syndrome. J Autism Dev Disord. 2004;34(2):199–210. doi: 10.1023/b:jadd.0000022610.09668.4c. [DOI] [PubMed] [Google Scholar]
- 25.Sabatinelli D, Bradley MM, Fitzsimmons JR, Lang PJ. Parallel amygdala and inferotemporal activation reflect emotional intensity and fear relevance. Neuroimage. 2005;24(4):1265–1270. doi: 10.1016/j.neuroimage.2004.12.015. [DOI] [PubMed] [Google Scholar]
- 26.Rudrauf D, David O, Lachaux JP, Kovach CK, Martinerie J, Renault B, Damasio A. Rapid interactions between the ventral visual stream and emotion-related structures rely on a two-pathway architecture. J Neurosci. 2008;28(11):2793–2803. doi: 10.1523/JNEUROSCI.3476-07.2008. [DOI] [PMC free article] [PubMed] [Google Scholar]
- 27.Pessoa L, McKenna M, Gutierrez E, Ungerleider LG. Neural processing of emotional faces requires attention. Proc Natl Acad Sci U S A. 2002;99(17):11458–11463. doi: 10.1073/pnas.172403899. [DOI] [PMC free article] [PubMed] [Google Scholar]
- 28.Morris JS, Friston KJ, Buchel C, Frith CD, Young AW, Calder AJ, Dolan RJ. A neuromodulatory role for the human amygdala in processing emotional facial expressions. Brain. 1998;121(pt 1):47–57. doi: 10.1093/brain/121.1.47. [DOI] [PubMed] [Google Scholar]
- 29.Oldfield RC. The assessment and analysis of handedness: the Edinburgh inventory. Neuropsychologia. 1971;9(1):97–113. doi: 10.1016/0028-3932(71)90067-4. [DOI] [PubMed] [Google Scholar]
- 30.Phillips K, Atala K, Pope H. Diagnostic instruments for body dysmorphic disorder. Paper presented at: 148th Annual Meeting of the American Psychiatric Association; May 20–25, 1995; Miami, FL. [Google Scholar]
- 31.Sheehan DV, Lecrubier Y, Sheehan KH, Amorim P, Janavs J, Weiller E, Hergueta T, Baker R, Dunbar GC. The Mini-International Neuropsychiatric Interview (MINI): the development and validation of a structured diagnostic psychiatric interview for DSM-IV and ICD-10. J Clin Psychiatry. 1998;59(suppl 20):22–33. [PubMed] [Google Scholar]
- 32.Phillips KA, Hollander E, Rasmussen SA, Aronowitz BR, DeCaria C, Goodman WK. A severity rating scale for body dysmorphic disorder: development, reliability, and validity of a modified version of the Yale-Brown Obsessive Compulsive Scale. Psychopharmacol Bull. 1997;33(1):17–22. [PubMed] [Google Scholar]
- 33.Hamilton M. A rating scale for depression. J Neurol Neurosurg Psychiatry. 1960;23:56–62. doi: 10.1136/jnnp.23.1.56. [DOI] [PMC free article] [PubMed] [Google Scholar]
- 34.Hamilton M. Diagnosis and rating of anxiety. Br J Psychiatry. 1969;3(special issue):76–79. [Google Scholar]
- 35.Lane RD, Fink GR, Chau PM, Dolan RJ. Neural activation during selective attention to subjective emotional responses. Neuroreport. 1997;8(18):3969–3972. doi: 10.1097/00001756-199712220-00024. [DOI] [PubMed] [Google Scholar]
- 36.Aguirre GK, Zarahn E, D’Esposito M. The variability of human, BOLD hemodynamic responses. Neuroimage. 1998;8(4):360–369. doi: 10.1006/nimg.1998.0369. [DOI] [PubMed] [Google Scholar]
- 37.Woolrich M, Brady M, Smith S. Hierarchical fully Bayesian spatio-temporal analysis of FMRI data. Poster presented at: Seventh International Conference on Functional Mapping of the Human Brain; June 10–14, 2001; Brighton, England. [Google Scholar]
- 38.Worsley KJ, Evans AC, Marrett S, Neelin P. A three-dimensional statistical analysis for CBF activation studies in human brain. J Cereb Blood Flow Metab. 1992;12(6):900–918. doi: 10.1038/jcbfm.1992.127. [DOI] [PubMed] [Google Scholar]
- 39.Woolrich MW, Behrens TE, Beckmann CF, Jenkinson M, Smith SM. Multi-level linear modeling for FMRI group analysis using Bayesian inference. Neuroimage. 2004;21(4):1732–1747. doi: 10.1016/j.neuroimage.2003.12.023. [DOI] [PubMed] [Google Scholar]
- 40.Beckmann CF, Jenkinson M, Smith SM. General multi-level linear modeling for group analysis in FMRI. Neuroimage. 2003;20(2):1052–1063. doi: 10.1016/S1053-8119(03)00435-X. [DOI] [PubMed] [Google Scholar]
- 41.Poldrack RA. Region of interest analysis for fMRI. Soc Cogn Affect Neurosci. 2007;2(1):67–70. doi: 10.1093/scan/nsm006. [DOI] [PMC free article] [PubMed] [Google Scholar]
- 42.Berson DM. Retinal and cortical inputs to cat superior colliculus: composition, convergence and laminar specificity. Prog Brain Res. 1988;75:17–26. doi: 10.1016/s0079-6123(08)60462-8. [DOI] [PubMed] [Google Scholar]
- 43.Laycock R, Crewther SG, Crewther DP. A role for the “magnocellular advantage” in visual impairments in neurodevelopmental and psychiatric disorders. Neurosci Biobehav Rev. 2007;31(3):363–376. doi: 10.1016/j.neubiorev.2006.10.003. [DOI] [PubMed] [Google Scholar]
- 44.Bullier J. Integrated model of visual processing. Brain Res Brain Res Rev. 2001;36(2–3):96–107. doi: 10.1016/s0165-0173(01)00085-6. [DOI] [PubMed] [Google Scholar]
- 45.Oliva A, Schyns PG. Coarse blobs or fine edges? evidence that information diagnosticity changes the perception of complex visual stimuli. Cogn Psychol. 1997;34(1):72–107. doi: 10.1006/cogp.1997.0667. [DOI] [PubMed] [Google Scholar]
- 46.Kastner S, Ungerleider LG. Mechanisms of visual attention in the human cortex. Annu Rev Neurosci. 2000;23:315–341. doi: 10.1146/annurev.neuro.23.1.315. [DOI] [PubMed] [Google Scholar]
- 47.Sugiura M, Watanabe J, Maeda Y, Matsue Y, Fukuda H, Kawashima R. Cortical mechanisms of visual self-recognition. Neuroimage. 2005;24(1):143–149. doi: 10.1016/j.neuroimage.2004.07.063. [DOI] [PubMed] [Google Scholar]
- 48.Uddin LQ, Kaplan JT, Molnar-Szakacs I, Zaidel E, Iacoboni M. Self-face recognition activates a frontoparietal “mirror” network in the right hemisphere: an event-related fMRI study. Neuroimage. 2005;25(3):926–935. doi: 10.1016/j.neuroimage.2004.12.018. [DOI] [PubMed] [Google Scholar]
- 49.Menzies L, Chamberlain SR, Laird AR, Thelen SM, Sahakian BJ, Bullmore ET. Integrating evidence from neuroimaging and neuropsychological studies of obsessive-compulsive disorder: the orbitofrontostriatal model revisited. Neurosci Biobehav Rev. 2008;32(3):525–549. doi: 10.1016/j.neubiorev.2007.09.005. [DOI] [PMC free article] [PubMed] [Google Scholar]
- 50.Chamberlain SR, Blackwell AD, Fineberg NA, Robbins TW, Sahakian BJ. The neuropsychology of obsessive compulsive disorder: the importance of failures in cognitive and behavioural inhibition as candidate endophenotypic markers. Neurosci Biobehav Rev. 2005;29(3):399–419. doi: 10.1016/j.neubiorev.2004.11.006. [DOI] [PubMed] [Google Scholar]
- 51.Murray EA, O’Doherty JP, Schoenbaum G. What we know and do not know about the functions of the orbitofrontal cortex after 20 years of cross-species studies. J Neurosci. 2007;27(31):8166–8169. doi: 10.1523/JNEUROSCI.1556-07.2007. [DOI] [PMC free article] [PubMed] [Google Scholar]
- 52.Whiteside SP, Port JD, Abramowitz JS. A meta-analysis of functional neuroimaging in obsessive-compulsive disorder. Psychiatry Res. 2004;132(1):69–79. doi: 10.1016/j.pscychresns.2004.07.001. [DOI] [PubMed] [Google Scholar]
- 53.Rauch SL, Jenike MA, Alpert NM, Baer L, Breiter HC, Savage CR, Fischman AJ. Regional cerebral blood flow measured during symptom provocation in obsessive-compulsive disorder using oxygen 15–labeled carbon dioxide and positron emission tomography. Arch Gen Psychiatry. 1994;51(1):62–70. doi: 10.1001/archpsyc.1994.03950010062008. [DOI] [PubMed] [Google Scholar]
- 54.McGuire PK, Bench CJ, Frith CD, Marks IM, Frackowiak RS, Dolan RJ. Functional anatomy of obsessive-compulsive phenomena. Br J Psychiatry. 1994;164(4):459–468. doi: 10.1192/bjp.164.4.459. [DOI] [PubMed] [Google Scholar]
- 55.Breiter HC, Rauch SL, Kwong KK, Baker JR, Weisskoff RM, Kennedy DN, Kendrick AD, Davis TL, Jiang A, Cohen MS, Stern CE, Belliveau JW, Baer L, O’Sullivan RL, Savage CR, Jenike MA, Rosen BR. Functional magnetic resonance imaging of symptom provocation in obsessive-compulsive disorder. Arch Gen Psychiatry. 1996;53(7):595–606. doi: 10.1001/archpsyc.1996.01830070041008. [DOI] [PubMed] [Google Scholar]
- 56.Rauch SL, van der Kolk BA, Fisler RE, Alpert NM, Orr SP, Savage CR, Fischman AJ, Jenike MA, Pitman RK. A symptom provocation study of posttraumatic stress disorder using positron emission tomography and script-driven imagery. Arch Gen Psychiatry. 1996;53(5):380–387. doi: 10.1001/archpsyc.1996.01830050014003. [DOI] [PubMed] [Google Scholar]
- 57.Rauch SL, Savage CR, Alpert NM, Miguel EC, Baer L, Breiter HC, Fischman AJ, Manzo PA, Moretti C, Jenike MA. A positron emission tomographic study of simple phobic symptom provocation. Arch Gen Psychiatry. 1995;52(1):20–28. doi: 10.1001/archpsyc.1995.03950130020003. [DOI] [PubMed] [Google Scholar]
- 58.Benkelfat C, Bradwejn J, Meyer E, Ellenbogen M, Milot S, Gjedde A, Evans A. Functional neuroanatomy of CCK4-induced anxiety in normal healthy volunteers. Am J Psychiatry. 1995;152(8):1180–1184. doi: 10.1176/ajp.152.8.1180. [DOI] [PubMed] [Google Scholar]
- 59.Kranz F, Ishai A. Face perception is modulated by sexual preference. Curr Biol. 2006;16(1):63–68. doi: 10.1016/j.cub.2005.10.070. [DOI] [PubMed] [Google Scholar]