

Abstract
Regulation of sphingosine and sphingosine-1-phosphate concentrations is of growing interest due to their importance in cellular signal transduction. Furthermore, new pharmaceutical agents moderating the intracellular and extracellular levels of sphingosine metabolites are showing promise in preclinical and clinical trials. In the present work, a quantitative assay relying on capillary electrophoresis with laser-induced fluorescence detection was developed to measure the interconversion of sphingosine and sphingosine-1-phosphate. The assay was demonstrated to be capable of determining the in vitro activity of both kinase and phosphatase using purified enzymes. The KM of sphingosine kinase for its fluorescently labeled substrate was 38 ± 18 μM with a Vmax of 0.4 ± 0.2 μM/min and a kcat of 3900 s−1. Pharmacologic inhibition of sphingosine kinase in a concentration-dependent manner was also demonstrated. Moreover, the fluorescent substrate was shown to be readily taken up by mammalian cells making it possible to study the endogenous activity of sphingosine kinase activity in living cells. The method was readily adaptable to the use of either bulk cell lysates or very small numbers of intact cells. This new methodology provides enhancements over standard methods in sensitivity, quantification, and manpower for both in vitro and cell-based assays.
The sphingolipids sphingosine and sphingosine-1-phosphate (S1P) play crucial roles as signal transduction molecules involved in cell survival and migration.1–6 These second messengers along with the sphingolipid metabolite ceramide are interconvertible, and their dynamic equilibrium is believed to be a determining factor in whether cells will live or die.7 In addition to its role as an intracellular second messenger, S1P also acts as an extracellular ligand making it a pleiotropic signaling molecule with wide-ranging function from calcium homeostasis to chemotaxis.4,7–9 S1P is produced by phosphorylation of sphingosine by sphingosine kinase 1 and 2 (SK1 and SK2) and is reversibly dephosphorylated by two known mammalian phosphatases SPP1 and SPP2.6,9–11 In addition, S1P can be irreversibly degraded by a pyridoxylphosphate-dependent S1P lyase to hexadecenal and phosphoethanolamine.6,12 The balance and interplay of these metabolic pathways remain to be fully elucidated. SK1 is thought to be oncogenic, and inhibitors of SK1 appear to act as effective chemotherapeutic agents in animal studies.7,10,13,14 SK2 is involved in the immune response, and compounds directed at extracellular S1P signaling are showing great promise in clinical trials for autoimmune diseases.10,15–18 Thus, sphingosine signaling is proving to be extremely important in clinical medicine.17–21
Although S1P plays a major role as an extracellular signaling molecule, it is predominately synthesized by SK within cells.6 The precise mechanism and control of S1P cellular export is not clearly understood, although sphingosine and sphingosine derivatives do appear to readily enter and exit living cells.22,23 Recently, the primary reservoir for S1P acting to influence the immune system has been shown to reside in erythrocytes (red blood cells). It remains unclear whether the intracellular pool of S1P is from endogenous kinase activity or from uptake and storage of exogenous S1P.23,24 These studies have been hampered by the inability to quantitatively measure SK activity in cells.
The traditional assay for S1P requires a two-step CHCl3 extraction followed by 9-fluorenylmethyl chloroformiate derivatization of the extracts and analysis by HPLC.23 However, these steps reduce the accuracy of quantitative measurements such that only large changes in S1P concentration in the biological sample can be identified.25 Another common method for the determination of SK activity is by radiometric assay.26–28 There are two widely used protocols. The first protocol involves incubation of the purified enzyme or cell lysate with sphingosine and [γ−32P]ATP. Organic solvents are used to extract the sphingoid base 1-phosphates under acidic conditions with recoveries of at best 50%.25,28 The products are separated by thin-layer chromatography (TLC), and [32P]S1P is identified by autoradiography or phosphorimaging.28 An alternative, albeit even less sensitive, assay uses 3H-labeled sphingosine followed by extraction in CHCl3 under basic conditions.26,27 The reaction product [3H]S1P is recovered in an aqueous phase and separated by TLC or directly quantified using liquid-scintillation counting. Major drawbacks of radiometric assays for SK are their very limited sensitivity, semiquantitative results, use of organic solvent extraction, poor resolution of structurally similar radiolabeled species, and intense investment of time and labor.25 Other techniques developed for determination of SK activity include HPLC and mass spectrometry (MS).29–32 To detect endogenous SK activity in cell and tissue extracts, these techniques still require nonquantitative extraction techniques to remove interference from cellular proteins, and their sensitivity remains limited.29 In addition, MS is an expensive technique which may not be readily available to many biology laboratories. Newly developed fluorescence-based assays for the determination of SK activity appear promising.33–35 These nonradioactive assays are simpler, faster, and more amenable to high-throughput analyses. For biological samples, the assays still require organic solvent extractions and are more suited for quantifying the activity of enzymes in purified state or in bulk cell lysates. All of the current platforms lack the sensitivity for analysis of cellular samples on the order of tens to hundreds of cells. A direct approach for measurement of the interconversion of sphingosine and S1P in cells would be of benefit, particularly if a highly sensitive means with the potential for single-cell analysis could be achieved.36
Chemical cytometry, the application of high-sensitivity chemical separations to characterize single or small numbers of cells, is emerging as an important approach for biochemical studies.37 A number of techniques including MS, electrochemistry, and capillary electrophoresis (CE) are the fundamental analytical tools for such studies. CE using laser-induced fluorescence detection (LIF) is the most sensitive of these techniques, and numerous groups have used this separation technique for a variety of biochemical studies in single cells, including assays of enzymatic activity.37 The objective of the current work was to develop a sensitive, fluorescent CE-based assay for SK and sphingoid phosphatase activity in small numbers of cells. To achieve this goal, a CE-based separation of fluorescein-labeled sphingosine (SphFl) and the phosphorylated product fluorescein-labeled sphingosine-1-phosphate (SphFl-1-P) was used to measure the activity of purified enzyme. These results demonstrated the utility of this technique for in vitro biochemical determination of kinase and phosphatase activity. Furthermore, it was demonstrated that SphFl was readily taken up by mammalian cells without the need for rigorous loading protocols. The technique was then applied to study endogenous SK activity in erythrocytes using both bulk cell lysates and very small numbers of whole cells. The highly sensitive and quantitative method was fast, simple, and robust for both in vitro and cell-based assays. The methodology described should prove to be a valuable analytical tool for quantitative cellular studies of the sphingosine kinases and phosphatases, enzymes of intense interest in both cell biology and clinical medicine.
EXPERIMENTAL SECTION
Materials
Sodium deoxycholate (SDC), 1-propanol, adenosine triphosphate (ATP), sodium orthovanadate (Na3VO4), 4-(2-hydroxyethyl) piperazine-1-ethanesulfonic acid (Hepes), trypan blue, poly-L-lysine, and alkaline phosphatase (AP) were purchased from Sigma-Aldrich Inc. (St. Louis, MO). Sphingosine fluorescein (SphFl) and sphingosine 1-phosphate fluorescein (SphFl-1-P) labeled with the 5′ and 6′ isomers of fluorescein were purchased from Echelon Biosciences Inc. (Salt Lake City, UT) and were greater than 95% pure. Recombinant human sphingosine kinase 1 (SK1) was purchased from BPS Biosciences Inc. (San Diego, CA). Methanol, sodium chloride, magnesium chloride, and tris-(hydroxymethyl)aminomethane (Tris) were purchased from Fisher Scientific (Fair Lawn, NJ). Bodipy-(4,4-difluoro-3a,4a-diaza-s-in-dacene)-fluorescein (Bodipy-Fl), 4,4-difluoro-5,7-dimethyl-4-bora-3a,4a-diaza-s-indacene-3-hexadecanoic acid (Bodipy-FlC16), RPMI media, and all other tissue culture reagents were purchased from Invitrogen (Carlsbad, CA). N,N-dimethylsphingosine (DMS) was purchased from Avanti Polar Lipids (Alabaster, AL). Fatty-acid free bovine serum albumin (BSA) was purchased from EMD Chemicals Inc. (San Diego, CA). EOTrol LR (low reverse) polymer solution was purchased from Target Discovery (Palo Alto, CA). Cell-Tak cell and tissue adhesive was purchased from BD Biosciences (San Jose, CA). LavaCell was purchased from Active Motif (Carlsbad, CA). Chemicals were of analytical reagent grade and used as received.
Capillary Electrophoresis
CE analyses were performed using custom-built CE instrumentation.38 Fused-silica capillaries (50 μm i.d., 360 μm o.d., Polymicro Technologies, Phoenix, AZ) were used for the analyte separations. The capillary length was 18 cm from the inlet to the optical window with a total length of 41 cm. The inlet reservoir was held at ground potential, while the outlet reservoir was held at a positive voltage of 20 kV. Sample volumes (2 nL) were loaded by hydrodynamic injection. The volume injected was estimated as described previously.39 All CE runs were performed at 20 °C. LIF detection was performed as previously described.39 Separation of Sph-Fl at 8.5 × 10⁻⁹ M and SphFl-1-P at 4.3 × 10⁻⁹ M was performed using Bodipy-Fl at 5.1 × 10⁻⁹ M or Bodipy-FlC16 at 2.9 × 10⁻⁹ M as an internal standard. SphFl and SphFl-1-P were dissolved in methanol. The separation was done with an electrophoresis buffer consisting of 100 mM Tris, 10 mM SDC, 20% 1-propanol, and 5% EOTrol LR, at pH 8.5 with an electric field strength of 488 V/cm. Prior to each run, the capillary was flushed with 1 M NaOH for 5 min, distilled H2O for 3 min, and the separation buffer for 3 min using a pressurized washing system at 20 psi. EOTrol LR was used as a dynamic capillary coating by 1:20 dilution in electrophoresis buffer per the manufacturer’s protocol. The identity and elution order of the peaks were determined by spiking SphFl or SphFl-1-P into the solution mixture and repeating the separation. The number of theoretical plates (N) was determined using the initial of the paired peaks that resulted from the mixed isomer labeling (see Results and Discussion). The value was calculated using the equation N = 5.54(tm/W1/2)2 where tm is the migration time and W is the peak width at half-height.40 The resolution was calculated as described by Baker and Skoog.41,42 The SphFl and SphFl-1-P peaks were normalized against the Bodipy-Fl internal standard. At least nine measurements were made for each experimental condition for which the relative standard deviation (RSD) was calculated. The limits of detection for SphFl and SphFl-1-P were defined as the number of moles which yielded a signal-to-noise ratio of 3.
Sphingosine Kinase Assay
The assays were performed with an SK1 concentration of 0.8 μg/mL (17 nM) and an SphFl concentration of 0.4 μM in assay buffer (50 mM Hepes, 150 mM NaCl, and 5 mM MgCl2 at pH 7.4) in a total reaction volume of 100 μL. The SK1 used in these studies was a human, recombinant, N-terminal His-tagged protein (MW = 46.9 kDa) expressed in a baculovirus infected Sf9 cell expression system. The specific activity of the SK1 used in the current study was reported by the supplier as 20 U/μg total protein. The assay was performed in the absence or presence of 0.5 mM ATP. The reaction mixture also contained 0.3 mM Na3VO4 and 0.026 μM Bodipy-Fl. In some experiments, DMS was added to the reaction mixture at 6 or 12 μM to inhibit SK1. In these experiments, DMS was added to the reaction mixture simultaneously with the substrate at the start of the experiment. The assay was performed at 37 °C in a water bath. Sample volumes (10 μL) were taken from the reaction mixture at 0, 5, 15, 30, 45, and 60 min time points. The reaction was stopped by diluting the sample volumes 10-fold in the electrophoresis buffer without the EOTrol LR coating reagent followed by flash freezing in liquid nitrogen. Samples were thawed just prior to analysis. The percentage of phosphorylation was determined by CE analysis taking the ratio of the SphFl-1-P peak area to the combined SphFl-1-P and SphFl peak areas from the electropherogram.
Phosphatase Assay
The kinetics of SphFl-1-P dephosphorylation were determined using AP (0.085 μg/mL) in assay buffer (same composition as above). The initial SphFl-1-P concentration was 4.3 × 10⁻⁸ M. The reaction was performed at 30 °C in a water bath. The percentage of dephosphorylation was determined by CE analysis taking the ratio of the SphFl peak area to the combined SphFl-1-P and SphFl peak areas from the electropherogram.
Measurement of Michaelis–Menten Kinetics
The KM and Vmax for sphingosine kinase were obtained by plotting a curve of the average of three determinations of SphFl concentration versus the initial reaction velocity. The SphFl concentrations used were 2.5, 5, 10, 15, 20, 30, 40, and 60 μM, using 2% fatty-acid free BSA as a carrier for SphFl. The KM and Vmax were determined assuming Michaelis–Menten kinetics and fitting the data points in Origin (OriginLab Corporation, Northampton, MA).
Cell Culture
BA/F3 cell cultures were grown in RPMI media containing 25 mM Hepes, L-glutamine, 1% penicillin/streptomycin, and 10% fetal bovine serum. The cells were maintained at 37 °C in a humidified 5% CO2 atmosphere. Sheep red blood cells (Innovative Research, Southfield, MI) were obtained from the vendor in saline solution as a 10% packed red blood cell suspension. The suspension was stored under sterile conditions at 4 °C per the vendor’s specifications.
Cell Loading with Fluorescent Reagents
To prepare BA/F3 cells for loading of fluorescent reagents, cells were centrifuged at 800g for 3 min. The supernatant was removed, and the cells were washed with extracellular buffer (ECB: 135 mM NaCl, 5 mM KCl, 1 mM MgCl2, 1 mM CaCl2, 10 mM Hepes, pH 7.4). The cells were loaded by incubation in the presence of SphFl (2.2 μM) in ECB for 20 min at 37 °C. Cells were then washed × 5 with ECB and used immediately. For colocalization experiments, the BA/F3 cells were simultaneously loaded with LavaCell (2.4 μM) along with SphFl as above.
For sheep erythrocytes (red blood cells [RBCs]), a volume of suspension (1–100 μL) was removed depending on the number of cells desired for the final sample. This volume was added to a modified ECB containing 10 mM glucose and 10% fetal bovine serum to bring the total volume of the suspension to 1 mL. The RBCs were then washed by centrifugation at 3000g with resuspension in the modified ECB. For microscopic imaging, RBCs were incubated for 15 min in the presence of 42 μM SphFl at 37 °C. After loading, the cells were washed × 5 with the ECB and placed on a 0.1% poly-L-lysine-coated chamber before imaging. For CE analyses, the RBCs were incubated in the presence of SphFl (20 μM) for 15 min. This step was followed by 5 min of incubation with the internal standard Bodipy-FlC16 (14 μM). After loading, the RBCs were washed × 5 with the ECB and used as described below.
CE Analysis of Cell Lysates
To prepare the RBC lysates for CE, RBCs (3 × 10⁴ cells in 100 μL) were loaded as described in the previous paragraph. After loading and washing, the cells were pelleted by centrifugation at 3000g for 3 min followed by lysis of the cells by the addition of 300 μL of electrophoresis buffer to the cell pellet with vortexing. A sample of this lysate was loaded into the capillary by gravity and electrophoresed. Peaks of fluorescent cellular analytes were detected by LIF and recorded as electropherograms. The electropherograms were compared to standards composed of a sample of known concentration and volume.43
CE Analysis of Intact Cells
For whole-cell experiments, RBCs were loaded as above, then were diluted 100-fold and plated as a cell suspension in a custom-made cell chamber and allowed to settle.38 The cell chamber was precoated with Cell-Tak (7.7 μg/mL) to enhance adhesion of the cells to the glass coverslip that formed the base of the chamber. Cell chambers were placed on an inverted microscope and imaged using an oil immersion 100× objective. To sample intact cells, the inlet of the capillary was positioned over a group of intact RBCs which were then aspirated into the capillary by gravitational fluid flow. The capillary was moved to the electrophoretic buffer and electrophoresis initiated. Lysis of the RBCs occurred when the cells suspended in ECB admixed with the electrophoresis buffer in the capillary. Peaks of fluorescent cellular analytes were detected by LIF and recorded as electropherograms. The electropherograms of cells were compared to standards as described above.
Fluorescence Microscopy and Image Analysis
For quantitative studies, fluorescence imaging was performed using a 40×, 0.75 N.A., Fluor, air objective on an inverted epifluorescence microscope (Nikon TE2000, Melville, NY) and standard FITC filter set (488 nm exc/535 nm em). Transmitted light and fluorescence images were obtained with a cooled CCD camera (Photometrix, Phoenix, AZ) using Metafluor image acquisition software (Molecular Devices, Sunnyvale, CA). The freeware image analysis program Image J (http://rsb.info.nih.gov/ij/) was used for quantifying cellular fluorescence. Regions of interest (i.e., cells) were defined by hand using Image J. All images were corrected for background by subtracting the average background fluorescence (areas within the field of view not containing cells) from the region of interest. Confocal imaging was performed in the Michael Hooker Microscopy Facility at the University of North Carolina using an inverted laser scanning microscope (Zeiss 510 Meta, Thornwood, NY). Imaging was performed using a 40×, 1.3 N.A., Plan-NeoFluor, oil immersion objective. The two-channel fluorescence excitation/emission ratios were 488 nm/518 nm for fluorescein-labeled peptides and 543 nm/585 nm for the LavaCell dye. LavaCell is a hydrophobic dye which partitions into cellular membranes.44
RESULTS AND DISCUSSION
Separation of the Phosphorylated and Nonphosphorylated Forms of Fluorescein-Labeled Sphingosine
The molecular structures of the fluorescently tagged species of sphingosine used in this study are shown in Figure 1, parts A and B. To determine whether SphFl and SphFl-1-P could be separated by CE, SphFl and SphFl-1-P standards were loaded into a capillary in a buffer containing 100 mM Tris (pH 8.5), 20% 1-propanol, and 5% EOTrol LR and electrophoresed (Figure 1C). The two major peaks observed were identified by spiking SphFl or SphFl-1-P into the solution mixture and repeating the separation. SphFl-1-P migrated toward the positively charged outlet more rapidly than SphFl which is consistent with the principle mechanism of separation being the charge difference between the analytes as SphFl-1-P is the more negatively charged species. The major peaks representing SphFl and SphFl-1-P were composed of two partially resolved peaks. These split peaks are most likely due to the mixed isomers of fluorescein (~1:1 ratio of 5′ and 6′ isomers) used to label the sphingolipid. Similar peak splitting has been observed in previous work in which mixed isomers of fluorescein were used to label peptides.45
Figure 1.

Chemical structures of (A) fluorescein-labeled sphingosine (SphFl) and (B) fluorescein-labeled sphingosine 1-phosphate (SphFl-1-P). (C) Electropherogram of the separation of SphFl-1-P (7.2 × 10⁻⁹ M) and SphFl (1.4 × 10⁻⁸ M) in a nonmicellar buffer (100 mM Tris, 20% 1-propanol, 5% EOTrol LR at pH 8.5). (D) Separation of SphFl-1-P (4.3 × 10⁻⁹ M) and SphFl (8.5 × 10⁻⁹ M) including an internal standard (Int Std) of Bodipy-Fl (5.1 × 10⁻⁹ M) with the addition of 10 mM SDC to the electrophoresis buffer.
Although electrophoresis of SphFl and SphFl-1-P under these conditions resolved the two major peaks, the use of a surfactant was expected to further improve the separation of the lipids as well as enhance separation of analytes obtained from cell samples. For these reasons, SDC was added to the separation buffer at 10 mM which improved the efficiency (N = 1.85 × 10⁵ theoretical plates, Figure 1D), although resolution of the major peaks was slightly diminished (13 vs 10).46 Notably, the addition of SDC improved the resolution of the SphFl isomers to near baseline. Under these conditions, elution time was shortened to less than 10 min likely as a result of reduced wall interactions due to the presence of SDC in the electrophoretic buffer.46 The efficiency and resolution of the separation of SphFl and SphFl-1-P were similar to those of other CE separations of lipids.47–49
Reproducibility and Stability
Despite optimization of run conditions, persistent deviations in peak areas and heights of the fluorescent analytes were noted (see the Supporting Information). Due to these variations, an internal standard was employed. Two such standards, Bodipy-FlC16 and Bodipy-Fl, were used, and both were found to elute between the SphFl-1-P and SphFl peaks (see, for example, Figure 1D and Figure 2 of the Supporting Information). The RSDs for the peak area and peak height for SphFl and SphFl-1-P were improved by normalization of the peak area and height to that of the internal standard (Table 1). The analytes’ poor solubility and ready adsorption to storage vessels required meticulous attention to sample handling protocols. Care was taken to store stock solutions in methanol at −70 °C and to use fresh aliquots of the stock for each day’s experiment. Samples prepared from stock were prepared immediately prior to use with minimization of transfers and pipeting to prevent loss of sample during preparation. The majority of the variation in the peak heights and areas were likely the result of minor differences in analyte concentration due to these challenges in sample preparation. Under the conditions used, the limits of detection for SphFl and SphFl-1-P were 6 × 10⁻¹⁹ and 7 × 10⁻¹⁹ mol, respectively. The mass detection of these analytes was found to be linear over a sample concentration range of 200 pM to 5 nM corresponding to 6 × 10⁻¹⁹ to 15 × 10−18 mol.
Table 1.
| analyte | efficiency (× 105 theoretical plates) | peak height (av ± SD)b | peak area (av ± SD)c | elution time(s) (av ± SD)d |
|---|---|---|---|---|
| SphFl | 1.9 | 0.80 ± 0.02 | 2.94 ± 0.05 | 320 ± 14 |
| SphFl-1-P | 1.8 | 0.40 ± 0.03 | 1.04 ± 0.07 | 246 ± 8 |
The average ± standard deviations (n = 9) are given for the normalized peak heights, peak areas, and elution times using Bodipy-Fl as the internal standard.
The peak height was that of the second isomer peak.
The peak area was calculated for both of the isomer peaks.
The migration time was the average migration time of the two isomer peaks.
Phosphorylation of SphFl by Sphingosine Kinase
To determine whether the activity of SK1 could be measured by CE, purified SK1 was mixed with SphFl and ATP (0 or 0.5 mM) in an assay buffer which included 0.03 μM of the internal standard Bodipy-Fl. The conversion of the substrate to product was followed by CE analysis of aliquots from the reaction mixture at various time points (Figure 2A). Under the conditions used, 85% of the SphFl was phosphorylated over 60 min. These data demonstrate that SphFl serves as an effective substrate for SK1. An advantage to this assay methodology is that quantitative determinations of both substrate and product can be readily measured in contrast to many of the traditional assays where only S1P is measured. Furthermore, no radioactivity is used and the approach reduces time and manpower requirements as sample extraction in organic solvent is not required.
Figure 2.
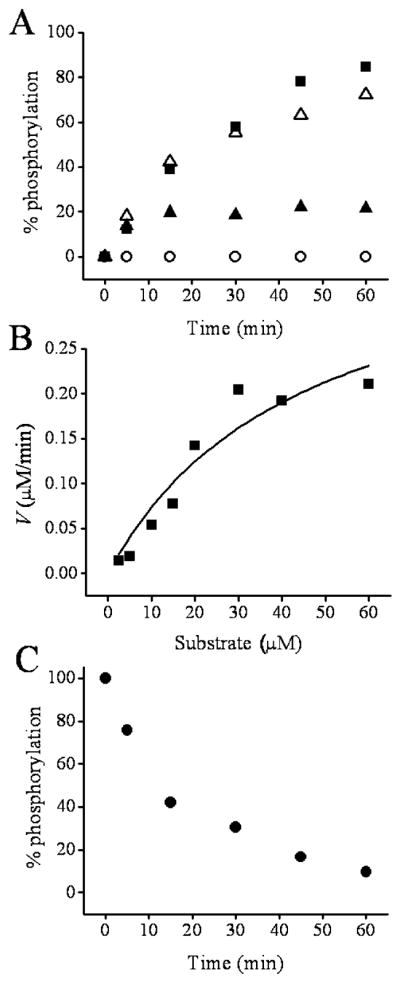
Assay of SphFl phosphorylation and dephosphorylation in vitro. (A) The time course of SphFl phosphorylation is shown. The SK concentration was 0.8 μg/mL, while the initial SphFl concentration was 0.04 μM. The closed squares and open circles are the percent of SphFl present as SphFl-1-P in the presence and absence of ATP (0.5 mM), respectively. The open triangles and closed triangles are the percent phosphorylation in the presence of ATP (0.5 mM) and the SK inhibitor DMS at 6 and 12 μM, respectively. (B) SphFl concentration plotted against the initial velocity of phosphorylation. The squares represent the actual data points, whereas the solid line is a fit to the Michaelis–Menten equation. (C) The time course for dephosphorylation of SphFl-1-P is shown for 8.5 μg/mL AP. The initial SphFl-1-P concentration was 4.3 × 10⁻⁸ M.
To further characterize the assay for in vitro SK activity, the Michaelis–Menten kinetic constants KM and Vmax and the turnover number (kcat) were determined using purified SK1. The KM and Vmax were obtained by measuring the initial velocity at varying substrate concentrations (Figure 2B). Roberts et al. measured the Michaelis–Menten reaction constants for biotinylated sphingosine using BSA as a lipid carrier.34 With the use of these conditions in the current assay, the KM of SK1 for SphFl was 38 ± 18 μM with a Vmax of 0.4 ± 0.2 μM/min. This corresponds to a turnover number of (kcat = 3900 s−1) for SphFl which compares favorably with that reported for sphingosine without the added fluorescein (kcat = 1265 s−1).50 Prior studies of recombinant human SK1 report a KM value of 5 μM using unlabeled D-erythro-sphingosine and 15 μM using biotinylated sphingosine.34,51 It is likely that the presence of the fluorescein label explains the increase in the KM seen using SphFl.
Inhibition of Sphingosine Kinase
N,N-Dimethylsphingosine (DMS) is a competitive inhibitor of SK.52 DMS (6–12 μM) was added to the reaction mixture at time zero simultaneously with the addition of the substrate SphFl (0.4 μM). In the presence of 6 μM DMS, phosphorylation of the SphFl substrate was only modestly reduced to 86% of that seen in the absence of the inhibitor after 60 min incubation (Figure 2A). However, at a DMS concentration of 12 μM, phosphorylation of SphFl was reduced to 51% of that seen without inhibitor by 15 min and to 26% by 60 min incubation (Figure 2A). These data demonstrate that this fluorescence-based CE assay can be used to assess the in vitro pharmacologic inhibition of the kinase. Furthermore, the observed concentration-dependent inhibition is consistent with previous cell-based studies in which DMS at 10 μM has been shown to increase the chemotherapeutic efficacy of the anticancer drug doxorubicin in tumor cell lines.52
Dephosphorylation of Fluorescein-Labeled Sphingosine-1-phosphate
To determine whether phosphorylated SphFl could undergo dephosphorylation, SphFl-1-P was incubated with AP. SphFl-1-P was added at time zero to the AP reaction buffer (see the Experimental Section), and the conversion of the phosphorylated to the nonphosphorylated form was followed by CE analysis over 60 min (Figure 2C). Under the conditions used, 58% of the SphFl-1-P was dephosphorylated by 15 min, whereas 93% dephosphorylation was achieved after 60 min. These data demonstrate that SphFl-1-P can be readily converted back to the SphFl substrate. This property will be important for the use of this fluorescent reporter in cell-based assays where the dynamic balance of the kinase and phosphatases is of fundamental importance.53
Loading Sphingosine Fluorescein into Living Cells
For SphFl to be useful in cell-based biochemical studies of sphingosine kinase activity, the molecule must be loaded into live cells. It was reasoned that the hydrophobic nature of this molecule might confer membrane permeability, thus permitting its translocation across the cell membrane to the interior of the cell.54 To determine if SphFl could be loaded into living cells, the two cell types BA/F3, a murine lymphocyte cell line, and sheep erythrocytes were incubated with SphFl, washed, and imaged by fluorescence microscopy. Confocal images of BA/F3 cells coloaded with the membrane specific dye LavaCell demonstrated that the SphFl fluorescence was present in the cytosol and colocalized with the internal cell membranes but was excluded from the nucleus (Figure 3A–C). These data clearly demonstrate cellular internalization of the SphFl. Under standard epifluorescence imaging, BA/F3 cells not exposed to SphFl demonstrated only the low-level autofluorescence typically seen as a result of naturally occurring fluorescent molecules.55 BA/F3 cells incubated in the presence of SphFl (2 μM) possessed an average fluorescence intensity 5.8-fold that of unloaded cells (Figure 3D, 517 ± 74 RFU vs 90 ± 23 RFU [RFU = relative fluorescence units]). The sheep RBCs also possessed increased fluorescence intensity (51-fold) compared with unloaded erythrocytes (26 ± 8 RFU vs 0.5 ± 3.8 RFU); however, the RBCs required higher concentrations of SphFl (42 μM) in order to detect intracellular uptake using fluorescence microscopy. The need for 20-fold greater loading concentration for these imaging experiments is likely due to the presence of hemoglobin within the erythrocyte. Oxygenated hemoglobin has absorption bands near the peak emission wavelength of fluorescein (518 nm) with millimolar absorptivities over the range of 500–540 nm between 5 and 14 L·mmol−1·cm−1.56 These spectral properties of hemoglobin dramatically reduce the emission intensity of fluorescein within the erythrocytes and likely account for the absolute reduction in fluorescence intensity of SphFl-exposed erythrocytes in comparison to BA/F3 cells.
Figure 3.

Internalization of SphFl in live cells. (A–C) Confocal images of BA/F3 cells loaded with SphFl and the LavaCell. Panels A and B were obtained at excitation/emission wavelengths of 488 nm/518 nm and 543 nm/585 nm, respectively. Panel C is the overlay of the images in panels A and B. Regions of colocalized SphFl and LavaCell appear yellow. (D) Fluorescence intensities measured for loaded and unloaded (control) BA/F3 cells and sheep erythrocytes. The fluorescence intensities of a minimum of 33 individual cells were averaged for each histogram.
Detection of Enzymatic Activity in Cells
To demonstrate that the activity of SK could be assayed in live cells, sheep RBCs were incubated with SphFl (20 μM) followed by Bodipy-FlC16 (14 μM). The cells were lysed in the electrophoresis buffer, and a sample of the lysate was analyzed by CE. The resulting electropherogram revealed that 60% of the fluorescent analyte comigrated with the SphFl-1-P peak and 40% comigrated with the SphFl peak (Figure 4A). It is known that erythrocytes avidly take up extracellular sphingosine, while storing and actively releasing S1P.23,57 This release of S1P appears to be in response to an as yet unidentified plasma factor.23 Consistent with our findings, it has been shown in other bulk cell studies of erythrocytes that the majority of intracellular sphingosine is in the phosphorylated form.23,24,57 No other major fluorescent peaks except the internal standard were observed suggesting that under these conditions neither ceramide nor hexadecenal were formed in substantial quantities (Figure 2 in the Supporting Information). This experiment demonstrated that SK activity could readily be detected in a cell lysate. Furthermore, the ratio of the peak areas of the phosphorylated and nonphosphorylated peak provided a quantitative measure of SK activity in the cells.53 In experiments performed during subsequent weeks, the average amount of SphFl phosphorylated under identical experimental conditions decreased in proportion to the storage time of the cells. For RBCs used within 1 week of receipt from the supplier, 64% ± 3% (n = 4) of the SphFl was phosphorylated. When cells were maintained in storage for more than a week prior to use, only 32% ± 7% (n = 3) phosphorylation was observed. This decrease in SK activity is likely the result of the aging of the RBCs or loss of enzymatic activity due to storage conditions.58 Prior reports in the literature suggest that lymphocytes display minimal or no SK activity under basal conditions.23,24 Consistent with these reports, assay of SK activity did not reveal production of SphFl-1-P in lysates of BA/F3 cells treated identically as the RBCs above (data not shown).
Figure 4.
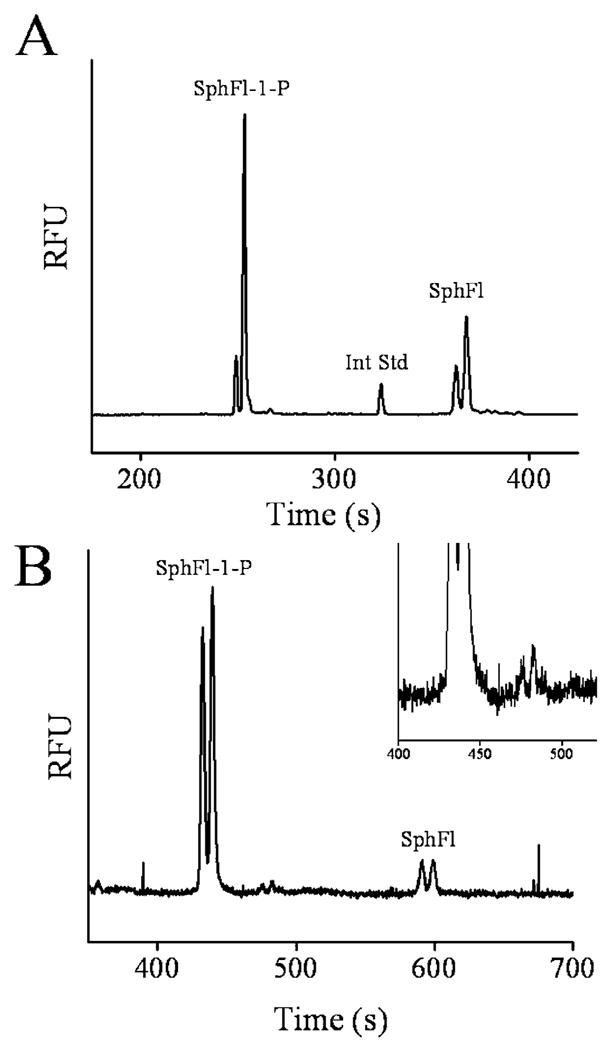
Shown are electropherograms obtained from sheep erythrocytes after incubation with SphFl. (A) Analysis of a bulk cell lysate generated after incubation of cells with SphFl (20 μM) and Bodipy-FlC16 (14 μM) followed by lysis. (B) Electropherogram obtained after intact erythrocytes were incubated with Sph-Fl (20 μM) for 15 min followed by aspiration of 10 cells into the capillary. The inset shows a blow up view of baseline in region of the SphFl-1-P peak. A small unidentified peak pair is seen.
Measurement of Enzymatic Activity in 10 RBCs
The ability to assay SK activity directly from very small numbers of intact cells was also investigated. To perform these experiments, sheep RBCs were incubated with SphFl (20 μM) followed by washing and placing into Cell-Tak-coated glass-bottom cell chambers. A group of 10 intact RBCs were aspirated into the capillary by gravitational fluid flow and electrophoresed. Similar to the findings with bulk cell lysates, the electropherogram displayed a predominant peak comigrating with the SphFl-1-P standard and a smaller peak comigrating with the SphFl standard (Figure 4B). In these experiments, 82% ± 8% (n = 3) of the SphFl was found to be phosphorylated. A minor split peak was also observed between the SphFl and SphFl-1-P peaks which may correspond to ceramide or hexadecenal. These results suggested that with only minor improvements in sensitivity, it will be possible to assay single RBCs for SK activity in future studies. This ability will be important for providing increased insight into cellular signaling mechanisms.
CONCLUSIONS
The assay described for monitoring sphingosine kinase and phosphatase activity provides enhancements over conventional methods, particularly for cell-based assays. The system is sufficiently flexible to study purified enzymes, cell lysates, or whole cells. Although erythrocytes are constitutive producers of S1P, this approach should be applicable to measurements in almost any mammalian cell type. This flexibility will be valuable in the study of the regulation of sphingosine metabolism in cells of the immune system or those involved in tumorigenesis. Important in this regard is the finding that BA/F3 cells, a B-lymphocyte cell line, are successfully loaded with SphFl. Lymphocytes are notoriously difficult to load with exogenous molecules, and their ready uptake of the labeled sphingosine suggests that most cell types will uptake the fluorescently labeled sphingoid substrates.59 Importantly, the chemical separation step enables the quantitative determination of both substrate and product. In fact, the resolving power of CE is such that it may be possible not only to determine the amounts of sphingosine and sphingosine-1-P but also that of multiple metabolic products such as ceramide and hexadecenal simultaneously in the same sample. Moreover, with the sensitivity limits made possible by LIF detection in a capillary, analysis of these metabolites in single cells should be achievable. With the increasing interest in biochemical measurements of the sphingosine pathway for cellular signal transduction, this assay can be expected to find broad application in biological and biomedical investigations. Information-rich cell-based assays of pharmaceutical compounds targeting this pathway can now be readily performed. Furthermore, the small sample size needed in this method opens up the possibility of performing drug assays directly on samples of patient cells.
Supplementary Material
Acknowledgments
This work was supported by funding from the NIH (C.E.S and N.L.A). BA/F3 cell cultures were the kind gift of Junia Melo.
Footnotes
SUPPORTING INFORMATION AVAILABLE
Additional information as noted in text. This material is available free of charge via the Internet at http://pubs.acs.org.
References
- 1.Merrill AH, Schmelz EM, Dillehay DL, Spiegel S, Shayman JA, Schroeder JJ, Riley RT, Voss KA, Wang E. Toxicol Appl Pharmacol. 1997;142:208–225. doi: 10.1006/taap.1996.8029. [DOI] [PubMed] [Google Scholar]
- 2.Kolesnick R, Hannun YA. Trends Biochem Sci. 1999;24:224–225. doi: 10.1016/s0968-0004(99)01408-5. [DOI] [PubMed] [Google Scholar]
- 3.Pyne S, Pyne NJ. Biochem J. 2000;349:385–402. doi: 10.1042/0264-6021:3490385. [DOI] [PMC free article] [PubMed] [Google Scholar]
- 4.Hla T. Pharmacol Res. 2003;47:401–407. doi: 10.1016/s1043-6618(03)00046-x. [DOI] [PubMed] [Google Scholar]
- 5.Saba JD, Hla T. Circ Res. 2004;94:724–734. doi: 10.1161/01.RES.0000122383.60368.24. [DOI] [PubMed] [Google Scholar]
- 6.Taha TA, Hannun YA, Obeid LM. J Biochem Mol Biol. 2006;39:113–131. doi: 10.5483/bmbrep.2006.39.2.113. [DOI] [PubMed] [Google Scholar]
- 7.Milstien S, Spiegel S. Cancer Cell. 2006;9:148–150. doi: 10.1016/j.ccr.2006.02.025. [DOI] [PubMed] [Google Scholar]
- 8.Payne SG, Milstien S, Spiegel S. FEBS Lett. 2002;531:54–57. doi: 10.1016/s0014-5793(02)03480-4. [DOI] [PubMed] [Google Scholar]
- 9.Spiegel S, Milstien S. Nat Rev Mol Cell Biol. 2003;4:397–407. doi: 10.1038/nrm1103. [DOI] [PubMed] [Google Scholar]
- 10.Maceyka M, Sankala H, Hait NC, Le Stunff H, Liu H, Toman R, Collier C, Zhang M, Satin LS, Merrill AH, Milstien S, Spiegel S. J Biol Chem. 2005;280:37118–37129. doi: 10.1074/jbc.M502207200. [DOI] [PubMed] [Google Scholar]
- 11.Spiegel S, Milstien S. J Biol Chem. 2007;282:2125–2129. doi: 10.1074/jbc.R600028200. [DOI] [PubMed] [Google Scholar]
- 12.Van Veldhoven PP. Methods Enzymol. 1999;311:244–254. doi: 10.1016/s0076-6879(00)11087-0. [DOI] [PubMed] [Google Scholar]
- 13.Xia P, Gamble JR, Wang L, Pitson SM, Moretti PAB, Wattenberg BW, D’Andrea RJ, Vadas MA. Curr Biol. 2000;10:1527–1530. doi: 10.1016/s0960-9822(00)00834-4. [DOI] [PubMed] [Google Scholar]
- 14.French KJ, Schrecengost RS, Lee BD, Zhuang Y, Smith SN, Eberly JL, Yun JK, Smith CD. Cancer Res. 2003;63:5962–5969. [PubMed] [Google Scholar]
- 15.Yoshimoto T, Furuhata M, Kamiya S, Hisada M, Miyaji H, Magami Y, Yamamoto K, Fujiwara H, Mizuguchi J. J Immunol. 2003;171:1352–1359. doi: 10.4049/jimmunol.171.3.1352. [DOI] [PubMed] [Google Scholar]
- 16.Hait NC, Sarkar S, Le Stunff H, Mikami A, Maceyka M, Milstien S, Spiegel S. J Biol Chem. 2005;280:29462–29469. doi: 10.1074/jbc.M502922200. [DOI] [PubMed] [Google Scholar]
- 17.Chun J. Science. 2007;316:208–210. doi: 10.1126/science.1142239. [DOI] [PubMed] [Google Scholar]
- 18.Gardell SE, Dubin AE, Chun J. Trends Mol Med. 2006;12:65–75. doi: 10.1016/j.molmed.2005.12.001. [DOI] [PubMed] [Google Scholar]
- 19.Morales A, Fernandez-Checa JC. Mini-Rev Med Chem. 2007;7:371–382. doi: 10.2174/138955707780363792. [DOI] [PubMed] [Google Scholar]
- 20.Herr DR, Chun J. Curr Drug Targets. 2007;8:155–167. doi: 10.2174/138945007779315669. [DOI] [PubMed] [Google Scholar]
- 21.Maceyka M, Milstien S, Spiegel S. Circ Res. 2007;100:41–49. doi: 10.1161/01.RES.0000255895.19868.a3. [DOI] [PubMed] [Google Scholar]
- 22.Ettamayer P, Billich A, Baumruker T, Mechtcheriakova D, Schmid H, Nussbaumer P. Bioorg Med Chem Lett. 2004;14:1555–1558. doi: 10.1016/j.bmcl.2003.12.099. [DOI] [PubMed] [Google Scholar]
- 23.Hanel P, Andreani P, Graler MH. FASEB J. 2007;21:1202–1209. doi: 10.1096/fj.06-7433com. [DOI] [PubMed] [Google Scholar]
- 24.Pappu R, Schwab SR, Cornelissen I, Pereira JP, Regard JB, Xu Y, Camerer E, Zheng YW, Huang Y, Cyster JG, Coughlin SR. Science. 2007;316:295–298. doi: 10.1126/science.1139221. [DOI] [PubMed] [Google Scholar]
- 25.Olivera A, Kohama T, Edsall L, Nava V, Cuvillier O, Poulton S, Spiegel S. J Cell Biol. 1999;147:545–557. doi: 10.1083/jcb.147.3.545. [DOI] [PMC free article] [PubMed] [Google Scholar]
- 26.Louie D, Kisic A, Schroepfer GJ. J Biol Chem. 1976;251:4557–4564. [PubMed] [Google Scholar]
- 27.Kono K, Tanaka M, Ogita T, Hosoya T, Kohama T. J Antibiot. 2000;53:459–466. doi: 10.7164/antibiotics.53.459. [DOI] [PubMed] [Google Scholar]
- 28.Olivera A, Barlow KD, Spiegel S. Methods Enzymol. 2000;311:215–223. doi: 10.1016/s0076-6879(00)11084-5. [DOI] [PubMed] [Google Scholar]
- 29.Caligan TB, Peters K, Ou J, Wang E, Saba J, Merrill AH. Anal Biochem. 2000;281:36–44. doi: 10.1006/abio.2000.4555. [DOI] [PubMed] [Google Scholar]
- 30.Ruwisch L, Schafer-Korting M, Kleuser B. Naunyn-Schmiedeberg’s Arch Pharmacol. 2001;363:358–363. doi: 10.1007/s002100000365. [DOI] [PubMed] [Google Scholar]
- 31.Min JK, Yoo HS, Lee EY, Lee WJ, Lee YM. Anal Biochem. 2002;303:167–175. doi: 10.1006/abio.2002.5579. [DOI] [PubMed] [Google Scholar]
- 32.Van Veldhoven PP, De Ceuster P, Rozenberg R, Mannaerts GP, de Hoffmann E. FEBS Lett. 1994;350:91–95. doi: 10.1016/0014-5793(94)00739-x. [DOI] [PubMed] [Google Scholar]
- 33.Billich A, Ettmayer P. Anal Biochem. 2004;326:114–119. doi: 10.1016/j.ab.2003.11.018. [DOI] [PubMed] [Google Scholar]
- 34.Roberts JL, Moretti AB, Darrow AL, Derian CK, Vadas MA, Pitson SM. Anal Biochem. 2004;331:122–129. doi: 10.1016/j.ab.2004.03.030. [DOI] [PubMed] [Google Scholar]
- 35.Itatani J, Sportsman R, Boge A. Time-resolved fluorescence energy transfer detection for lipid kinases using the IMAP platform: non-radioactive and antibody independent assay for sphingosine kinase. [Accessed August 6, 2007];Echelon Biosciences Incorporated. 2006 http://echelon-inc.com/corp/IMAP_TR-FRETSphingosine.pdf.
- 36.Sims CE, Allbritton NL. Curr Opin Biotechnol. 2003;14:23–28. doi: 10.1016/s0958-1669(02)00002-2. [DOI] [PubMed] [Google Scholar]
- 37.Dovichi NJ, Hu S. Curr Opin Chem Biol. 2003;7:603–608. doi: 10.1016/j.cbpa.2003.08.012. [DOI] [PubMed] [Google Scholar]
- 38.Nelson AR, Allbritton NL, Sims CE. Methods Cell Biol. 2007;82:709–722. doi: 10.1016/S0091-679X(06)82026-1. [DOI] [PubMed] [Google Scholar]
- 39.Li H, Wu HY, Wang Y, Sims CE, Allbritton NL. J Chromatogr, B. 2001;757:79–88. doi: 10.1016/s0378-4347(01)00080-9. [DOI] [PubMed] [Google Scholar]
- 40.Weinberger R. Practical Capillary Electrophoresis. 2. Academic Press; San Diego, CA: 2000. [Google Scholar]
- 41.Baker DR. Capillary Electrophoresis. John Wiley & Sons, Inc; New York: 1995. [Google Scholar]
- 42.Skoog DA, Holler JF, Nieman TA. Principles of Instrumental Analysis. Brace College Publishers; Orlando, FL: 1998. [Google Scholar]
- 43.Sims CE, Meredith GD, Krasieva TB, Berns MW, Tromberg BJ, Allbritton NL. Anal Chem. 1998;70:4570–4577. doi: 10.1021/ac9802269. [DOI] [PubMed] [Google Scholar]
- 44.Choi HY, Veal DA, Karuso P. J Fluoresc. 2006;16:475–482. doi: 10.1007/s10895-005-0010-7. [DOI] [PubMed] [Google Scholar]
- 45.Lee CL, Linton J, Soughayer JS, Sims CE, Allbritton NL. Nat Biotechnol. 1999;17:759–762. doi: 10.1038/11691. [DOI] [PubMed] [Google Scholar]
- 46.Landers JP, editor. Handbook of Capillary Electrophoresis. 2. CRC Press; Boca Raton, FL: 1997. [Google Scholar]
- 47.Haddadian E, Shamsi SA, Schaeper JP, Danielson ND. J Chromatogr Sci. 1998;36:395–400. doi: 10.1093/chromsci/36.8.395. [DOI] [PubMed] [Google Scholar]
- 48.Mwongela SM, Lee K, Sims CE, Allbritton NL. Electrophoresis. 2007;28:1235–1242. doi: 10.1002/elps.200600594. [DOI] [PubMed] [Google Scholar]
- 49.Zhang L, Krylov SN, Hu S, Dovichi NJ. J Chromatogr, A. 2000;894:129–134. doi: 10.1016/s0021-9673(00)00706-8. [DOI] [PubMed] [Google Scholar]
- 50.Pitson SM, Moretti PAB, Zebol JR, Lynn HE, Xia P, Vadas MA, Wattenberg BW. EMBO J. 2003;22:5491–5500. doi: 10.1093/emboj/cdg540. [DOI] [PMC free article] [PubMed] [Google Scholar]
- 51.Melendez AJ, Carlos-Dias E, Gosink M, Allen JM, Takas L. Gene. 2000;251:19–26. doi: 10.1016/s0378-1119(00)00205-5. [DOI] [PubMed] [Google Scholar]
- 52.Nava VE, Hobson JP, Murthy S, Milstien S, Spiegel S. Exp Cell Res. 2002;281:115–127. doi: 10.1006/excr.2002.5658. [DOI] [PubMed] [Google Scholar]
- 53.Li H, Sims CE, Kaluzova M, Stanbridge EJ, Allbritton NL. Biochemistry. 2004;43:1599–1608. doi: 10.1021/bi035597k. [DOI] [PubMed] [Google Scholar]
- 54.Stephens DJ, Pepperkok R. Proc Natl Acad Sci USA. 2001;98:4295–4298. doi: 10.1073/pnas.081065198. [DOI] [PMC free article] [PubMed] [Google Scholar]
- 55.Palero JA, de Bruijn HS, van der Ploeg van den Heuvel A, Sterenborg HJ, Gerritsen HC. Biophys J. 2007;93:992–1007. doi: 10.1529/biophysj.106.099457. [DOI] [PMC free article] [PubMed] [Google Scholar]
- 56.Zijistra WG, Buursma A, Meeuwsen-van der Roest WP. Clin Chem. 1991;37:1633–1638. [PubMed] [Google Scholar]
- 57.Yang L, Yatomi Y, Miura Y, Satoh K, Ozaki Y. Br J Hematol. 1999;107:282–293. doi: 10.1046/j.1365-2141.1999.01697.x. [DOI] [PubMed] [Google Scholar]
- 58.Tinmouth A, Fergusson D, Yee IC. Transfusion. 2006;46:2014–2027. doi: 10.1111/j.1537-2995.2006.01026.x. [DOI] [PubMed] [Google Scholar]
- 59.Fenton M, Bone N, Sinclair AJ. J Immunol Methods. 1998;212:41–48. doi: 10.1016/s0022-1759(97)00208-1. [DOI] [PubMed] [Google Scholar]
Associated Data
This section collects any data citations, data availability statements, or supplementary materials included in this article.