

Abstract
MEK partner 1 (MP1) and P14 are small proteins that modulate the Raf-MKK1/2-ERK1/2 pathway. To examine the biochemical basis for their function a fluorescent form of MP1 was prepared by labeling Cys-74 with fluorescein. Using this protein it was shown that MP1 binds unactivated ERK1, ERK2 and a constitutively active form of MKK1 (MKK1G7B) with dissociation constants of 9.7 ± 1.6, 3.3 ± 0.6 and 2.2 ± 0.5 μM respectively. MP1 inhibits the ability of activated ERK2 to phosphorylate the transcription factor Ets-1. Both MP1 and the MP1•P14 complex inhibit the ability of activated ERK2 to phosphorylate MKK1G7B, thus impeding feedback inhibition. In contrast, MP1 and the P14•MP1 complex enhance the ability of MKK1G7B to phosphorylate ERK2, when ERK2 is present at a low concentration, but not when it is present at a high concentration. Thus, MP1 and the MP1•P14 complex have the potential to differentially modulate activating and inhibiting signals in the Raf-MKK1/2-ERK1/2 pathway.
Keywords: MAPK kinase, ERK2, Fluorescence, Anisotropy
Introduction
ERK2 is well known for its regulation of both the entry into the cell cycle as well as the progression of cells through the Rb restriction point of the G1 phase of the cell-cycle [1]. In cancerous cells, continuous ERK2 signaling is necessary for this progression, explaining its high profile as a target for the development of anti-cancer drugs [1-4]. In addition to its role in mitogenic signaling, ERK2 mediates a range of other cellular processes through its ability to communicate distinct messages within a single type of cell [5]. Reflecting this diversity, the Ras-Raf-MKK module, which regulates ERK2, is controlled through the involvement of numerous receptors, channels and protein kinases that are associated with the cell membrane. A major question concerns the types of mechanisms that ensure the precise funneling and regulation of signals through this module. A popular hypothesis is that extracellular signals channel through multi-protein complexes, which somehow confer specificity on the signals [6], however a clear mechanistic model has not emerged in any specific case.
Two small proteins have been implicated as scaffolds in the Ras-Raf-MKK pathway, one called MKK partner 1 (MP1) is a 14.5 kDa protein that was first identified in a 2-hybrid screen and shown to bind an insert in the catalytic domain of MKK1, termed the proline rich sequence (residues 270-307) [7]. Notably, its over-expression was found to enhance the stimulation of ERK1 when COS cells are treated with fetal calf serum [7]. It was also found to promote the activation of MKK1 by B-raf in vitro and enhance the activation of ERK1 by a constitutively active form of MKK1, in the absence of B-raf, in vitro [7].
The second protein is called P14 which is structurally related to MP1 and of similar size (14 kDa). It interacts with MP1 on the cytoplasmic surface of late endosomes/lysosomes [8, 9] and when over-expressed in HeLa cells enhances the EGF-induced activation of both ERK1 and ERK2 [9]. Biochemical experiments also showed that the p14/MP1 complex enhanced the activation of ERK1/2 in a cell lysate from EGF-stimulated HeLa cells [10]. Interestingly, MP1 does not self-associate [11], but does form a high-affinity heterodimer (Kd = 13 nM) with P14 [10]. Recent structural studies of this heterodimer revealed that both proteins bear a remarkable structural similarity, featuring a central β-sheet flanked on both sides by α-helicies [10, 11]. Despite these similarities the proteins appear to serve different functions, because for example MP1 can bind ERK1/2 and MKK1 [7, 8], but P14 requires MP1 to associate with both MKK1 and ERK1/2 [8].
The available evidence supports the notion that MP1 and the MP1•P14 complex can bind both ERK1/2 and MKK1, but whether MKK2 can bind MP1 remains an unresolved question [7, 8]. Furthermore, both MP1 and MP1•P14 may facilitate the phosphorylation of MKK1 by Raf as well as the phosphorylation of ERK1/2 by MKK1[7, 8]. The influence that these proteins may have on the ability of ERK1/2 to phosphorylate MKK1 and other substrates remains to be determined.
A number of years ago ERK2 was found to phosphorylate MKK1 on Thr-292 and Thr-386 [12, 13] and a comparison between the activity of wild type MKK1 and a mutant, that could not be phosphorylated on these sites, suggested that these phosphorylations may represent a negative feedback control mechanism [13]. Further evidence for a physiological role for Thr-292 phosphorylation was presented recently by Elben et al. who showed that the phosphorylation of Thr-292 by ERK2, during cellular adhesion, diminished phosphorylation of Ser-218 and Ser-222, the MKK1 activating sites [14]. In addition, they also demonstrated that the phosphorylation of Thr-292 inhibits the phosphorylation of Ser-298 by PAK, which is required for the activation of MKK1/2 and ERK1/2 by integrins. As Thr-292 lies in the same proline rich sequence of MKK1/2 that interacts with MP1 we considered the possibility that MP1 may regulate the phosphorylation of MKK1/2 by ERK2. We also considered the possibility that MP1 inhibits the ability of ERK2 to phosphorylated other substrates.
Presented here are in vitro biochemical experiments that provide evidence that both MP1 and the MP1•P14 complex can promote the activity of a constitutively active form of MKK1, but inhibit the activity of ERK2. These results suggest that, MP1 and MP1•P14 could act as scaffold proteins that differentially regulate protein phosphorylation events within ERK1/2•MKK1 complexes.
Experimental Procedures
Buffers, Proteins and Reagents
Ultra pure grade Tris was obtained from ICN Biomedicals (Aurora, OH). 5′-Iodoacetamidofluorescein (5-IAF) was purchased from Molecular Probes (Eugene, OR). All other buffer components and chemicals were from Sigma (St. Louis, MO). Escherichia coli strain BL21 (DE3), used for recombinant protein expression, was purchased from Novagen (Madison, WI). Tryptone, yeast extract, and agar were obtained from US Biologicals (Swampscott, MA) and BD (Sparks, MD) respectively. The Mono-Q HR 10/10 anion exchange column and PD-10 desalting columns were purchased from Amersham Biosciences (Piscataway, NJ). Qiagen Inc. (Valencia, CA) supplied the Ni-NTA agarose and the Qiaprep Spin miniprep kit.
General Methods
Techniques for plasmid isolation, transformation and other standard molecular biology manipulations were based on methods described by the manufacturer. Ultraviolet-visible range absorbance readings were taken on a Varian Cary Model 50 spectrophotometer. FPLC was performed on a Pharmacia AKTA FPLC system. Proteins were analyzed by Tris glycine sodium dodecyl sulfate-polyacrylamide gel electrophoresis (SDS-PAGE) under denaturing conditions on 10-15% gels using the Bio-Rad Mini-protean III vertical gel electrophoresis apparatus. The extinction coefficients (ε) for proteins were determined from the primary sequence, according to ε = 5690 cm-1M-1 × (number of trp) + 1280 cm-1M-1 × (number of tyr) + 120 cm-1M-1 × (number of cys).
Expression and Purification of MP1
The c-DNA of mouse MP1 (403 bp) cloned into pGEM-T (Promega, WI) was a gift from Michael Sacher [11]. This expression vector was used to express MP1 as an N-terminal His6-tagged fusion protein, in Escherichia coli BL21 (DE3) cells. To begin expression, 10 mL of Luria broth containing 50 μg/mL of the antibiotic ampicillin was first inoculated with a single colony of freshly transformed cells and grown overnight at 30 °C. The culture was diluted 200-fold into LB medium, containing 50 μg/mL ampicillin, and incubated at 30 °C to an OD600 of 0.8. The expression of MP1 was induced by the addition of IPTG (0.5 mM) followed by further incubation, with shaking, for 5 h. The media was then centrifuged (7000 × g, 10 min), the supernatant removed, and the cell pellet frozen in liquid nitrogen. Within 24 hrs the pelleted cells (∼ 3.5 g wet cells from 1 liter of culture) were thawed on ice and resuspended in 30 mL of lysis buffer (20 mM Tris-HCl pH 8.0, 1% v/v Triton X-100, 0.1% v/v 2-mercaptoethanol, 0.03% Brij-30, 1 mM benzamidine, 0.1 mM PMSF, 0.1 mM TPCK, 500mM NaCl, 1 mM EDTA and 1 mM EGTA) containing 5 mM imidazole. The suspension was sonicated at 4 °C (30 s pulses) for 30 min, the lysate cleared (16000 × g, 30 min) and the supernatant gently shaken with 10 mL of Ni-NTA beads (Qiagen) for 2 h at 4 °C. The beads were washed in a 25 mL chromatography column (BioRad) with 100 mL of wash buffer (20 mM Tris-HCl pH 8.0, 0.1% v/v 2-mercaptoethanol, 0.03% Brij-30, 1 mM benzamidine, 0.1 mM PMSF, 0.1 mM TPCK, 500mM NaCl, 1 mM EDTA and 1 mM EGTA), followed by 100 mL of wash buffer containing 10 mM imidazole. The protein was then eluted with elution buffer (20 mM Tris-HCl pH 8.0, 0.1% v/v 2-mercaptoethanol and 200 mM imidazole). Fractions containing eluted protein from the Ni-NTA column were pooled and centrifuged at 13,000 × g for 5 min and applied directly to a Mono-Q HR 10/10 column (Pharmacia) which had been pre-equilibrated in buffer-A (20 mM Tris-HCl, pH 8.0; 0.1% 2-mercaptoethanol; 0.03% Brij-30). After equilibration (buffer A, 1.5 mL/min) the column was developed with a salt gradient (from 0 to 500 mM NaCl) at a flow rate of 1.5 mL/min. Fractions were analyzed for purity by 15% SDS-PAGE, and the fractions containing pure protein dialyzed against storage buffer (20mM Hepes, pH 7.5, 2mM DTT, 0.1 mM EDTA, 0.1 mM EGTA, 0.05 M KCl and 5% glycerol) overnight, then concentrated by an ultrafiltration cell (10 kDa cutoff) to 0.12 mM, frozen in liquid nitrogen and stored at -80 °C.
Expression and Purification of the MP1-P14 complex
The MP1•P14 complex was expressed using a dual MP1/P14 expression plasmid, which consists of the entire coding sequences of both MP1 and P14 with the addition of hexa-histitidine tags at each amino terminus [11]. The expression and purification of the complex was achieved following essentially the same protocol used to purify MP1. However, after Ni-NTA affinity chromatography the purity of the complex was confirmed by 15% SDS-PAGE before being dialyzed, concentrated and finally stored at -80°C in liquid nitrogen.
Expression and Purification of His6-Ets-1Δ1-138 [15], His6-ERK2 [16], and His6-MKK1G7B [16]
these were prepared as described previously. The expression of His6-ERK1, which is essentially the same as ERK2, will be described elsewhere.
Kinetic Methods
Protein kinase assays were conducted at 27 °C in buffer containing 50 mM HEPES, pH 7.4, 100 mM KCl, 2 mM DTT, 0.1 mM EDTA, and 0.1 mM EGTA with 2 nM ERK2, 0-200 μM EtsΔ138, 0.02-4.0 mM [γ32P] ATP (100-1000 cpm/pmol), 0.5 μg/mL BSA, and 10 mM MgCl2 in a final volume of 50-100 μl. The reaction mixture was incubated for 15 min before the reaction was initiated by the addition of ATP. Aliquots (5-10 μl) were taken at set time points and then applied to 2 × 2 cm P81 cellulose paper. The papers were washed (3 × 10 min) in 50 mM phosphoric acid, then in acetone (3 × 10 min), and dried, and the amount of labeled protein was determined by counting the associated c.p.m. on a Packard 1500 scintillation counter at a σ value of 2.
| Eqn. 1 |
| Eqn. 2 |
Data Analysis
Reciprocal plots of 1/v against 1/s were checked for linearity, before the data were fitted to eqn. 1 using a non-linear least squares approach, assuming equal variance for velocities, using the program Kaleidagraph 3.5 (Synergy software). Values for kinetic constants were obtained using the program Scientist (Micromath) by fitting the kinetic data to the relevant over-all equation. Data conforming to linear competitive inhibition were fitted to eqn. 2.
Preparation of Fluorescein-labeled MP1
Using 5′-iodoacetamidofluorescein (5-IAF), a fluorescein moiety was covalently linked to cysteine 74 of MP1 through a thioether linkage as follows: MP1 was dialyzed overnight at 4 °C into 2 L of Labeling buffer (20 mM HEPES pH 7.3, 50 mM KCl, and 2 mM EDTA) to remove DTT. To initiate the labeling reaction, a 10-fold excess of 5-IAF (10 mM in DMF) was added dropwise to a solution of the protein in Labeling buffer at 4 °C. After 15 h, the reaction was quenched by the addition of a 10-fold molar excess of β-mercaptoethanol. The sample was then concentrated to a volume of 2.5 mL and applied to a PD-10 desalting column (Amersham) to remove any unreacted 5-IAF. The labeled protein purified further by anion exchange chromatography using a Mono-Q HR 10/10 column. A gradient of 0-500 mM NaCl was applied and the fluorescein-labeled protein, MP1*, recovered and dialyzed overnight at 4°C in dialysis buffer.
Examining the Fluorescence Properties of Fluorescein-Labeled Proteins
To investigate the spectral properties of the MP1*, 100 nM of the protein was examined in 25 mM HEPES pH 7.5, 50 mM KCl, 40 μg/mL BSA, 0.1 mM EDTA, 0.1 mM EGTA, 1.3% glycerol, and 2 mM DTT in a final volume of 60 μl. Fluorescence measurements were made at 27 °C using a Fluorolog Model FL3-11 fluorometer (Jobin Yvon, Edison, NJ) using three-window fluorescence grade quartz cuvettes with a 1.0 cm path length and 55 μL aqueous volume purchased from Helma (Plainview, NY). In order to determine the excitation maximum, an excitation scan was performed from 450-500 nm. Slit widths were set to 2.5 nm, the integration time for each reading was 500 msec, and the emission was monitored at 517 nm. For determination of the emission maximum, fluorescein-labeled proteins were excited with light at 492 nm and an emission scan was performed from 500-600 nm. Slit widths were set to 2.5 nm and the integration time for each reading was 500 msec.
To determine the effect of binding on the fluorescent yield, the fluorescence emission was examined in the absence and presence of 20 μM ERK2. Assays were performed in 25 mM HEPES pH 7.5, 50 mM KCl, 40 μg/mL BSA, 0.1 mM EDTA, 0.1 mM EGTA, 1.3% glycerol, and 2 mM DTT containing 100 nM MP1* in a final volume of 60 μl. The protein was excited with polarized light at 492 nm and an emission scan was performed from 500-600 nm. Slit widths were set to 2.5 nm and the integration time for each reading was 500 msec. The resulting peaks on the emission scans were then integrated to determine the ratio of the fluorescence yield of the bound fluorophore to the free fluorophore, R. R was also calculated from the anisotropy experiments by measuring the polarized intensities for the free and bound form of the fluorophore, according to the following eqn.
| Eqn. 3 |
where IV and IH are the intensity of the emission at polarizations both parallel and perpendicular to the excitation source and G is a factor to correct for instrumental differences in detecting emission components. Specifically, the G factor is the ratio of the intensity of the vertically and horizontally polarized emission components when the sample is excited with horizontally polarized light.
Fluorescence Anisotropy Binding Assays
Assays were performed under the conditions described above. The program Instrument Control Center (Jobin Yvon, Edison, NJ) was used to collect data and to calculate the fluorescence anisotropy, r, which is defined as r = IV −GIH/IV + 2GIH. The protein was excited with polarized light at 492 nm and the horizontal and vertical components of the emitted light were detected at 515 nm. Excitation and emission slit widths were set to 2.5 nm and the integration time for each reading was 300 msec. Measurements were taken every 15 sec for a total of 3 min and the resulting anisotropy values were averaged. The dissociation constants were determined by fitting the average anisotropy values to eqn. 4 using Kaleidgraph 4.0 (Synergy software), where rf and rb are the anisotropies of the free and bound fluorescein-labeled protein, R is the ratio of fluorescent yields of the bound form and the free form, [St] and [Et] are the total concentration of the fluorescein-labeled protein and ERK2, and Kd is the dissociation constant.
| Eqn. 4 |
Measurement of band intensity
Proteins were fractionated by 10% SDS/PAGE. The gels were dried using Gel Dryer (Biorad) and exposed on image plates (Amersham Pharmacia) for 0.5-12 h depending on radioactivity. The gels were quantitated on a PhosphorImager (Molecular Dynamics) and analyzed using ImageQuant software. Data obtained from the gel analysis were fitted to the second exponential decay curve.
Results
MP1 forms a weak complex with ERK1, ERK2 and MKK1G7B1
To investigate the mechanism by which MP1 recognizes the protein kinases ERK1, ERK2 and a constitutively active form of MKK1 called MKK1G7B [17] we developed a fluorescence-binding assay by specifically labeling Cys-74 of MP1 with fluorescein. Relative to the protein kinases, MP1 is a small 14 kDa protein and therefore when labeled with a suitable flurophore it is predicted to furnish an observable change in fluorescence anisotropy upon binding the larger kinases. In order to examine the binding of MP1 to ERK1, ERK2 and MKK1G7B, a 100 nM solution (final concentration) of labeled MP1 (MP1*) was added to varying concentrations of each kinase and the resulting anisotropy determined (Fig. 1A-C). Notably, the observed anisotropy increased in a hyperbolic manner upon the addition of each kinase, consistent with the formation of an MP1*•kinase complex. As both MP1 and ERK2 are monomeric under the conditions of the experiment [11, 18], the experimental data was analyzed in terms of the binding model shown in Scheme 1. Upon fitting the data to eqn. 4, dissociation constants of Kd = 9.7 ± 1.6, 3.3 ± 0.6 and 2.2 ± 0.5 μM were obtained for the binding of MP1* to unactivated ERK1, unactivated ERK2 and MKK1G7B respectively (Fig. 1A-C). This demonstrates that MP1 directly binds each kinase with dissociation constants in the low micromolar range.
Figure. 1. Fluorescence anisotropy binding assay to measure the binding of MP1 to ERK1, ERK2 and MKK1G7B.
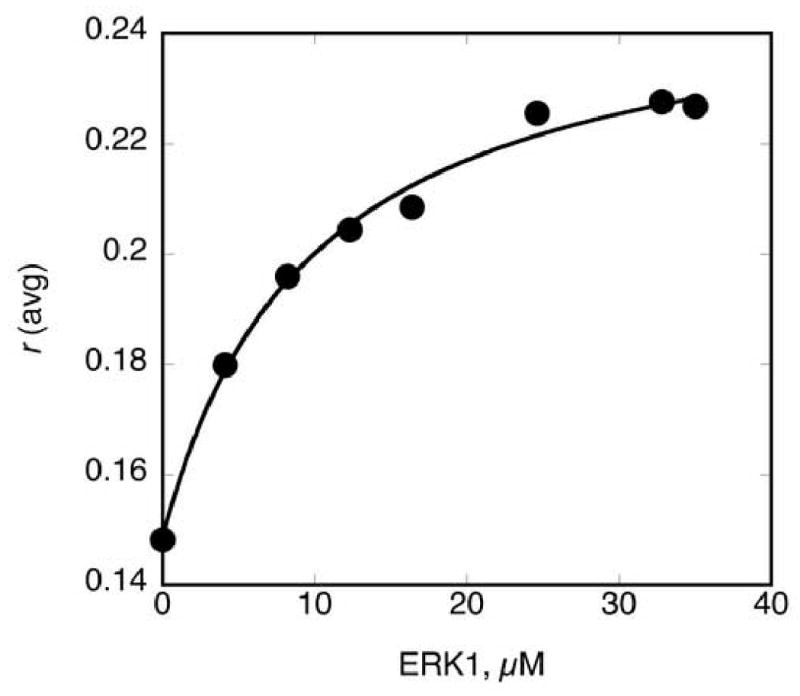


Each assay contained 100 nM MP1*, and a varied concentration of either A. unactivated ERK1, B) unactivated ERK2 and C) MKKG7B. Experimental data were plotted and fitted to eqn. 4 to furnish the dissociation constants, Kd.
Scheme 1.

Binding of a fluorescent MP1*, to ERK2.
MP1 is an inhibitor of ERK
The binding experiments in Fig 1A demonstrates that MP1 binds unactivated ERK2. As previous experiments suggested that MP1 also binds activated ERK2 its potential to inhibit ERK2 was tested. To test this, the ability of ERK2 to phosphorylate residues 1-138 of Ets-1, EtsΔ138, was determined using a standard steady state kinetic assay in the presence of three concentrations of MP1 (0, 25 and 50 μM). The rate of Ets-1 phosphorylation was found to decrease with increasing concentration of MP1 and an analysis of the inhibition kinetics suggested that MP1 competes with Ets-1 for ERK2 binding. A Lineweaver-Burk plot of the inhibition data (Fig. 2) reveals a point of covergence on the vertical axis, consistent with the notion that Ets-1 and MP1 compete for the same enzyme forms. The best fit of the data to a competitive mechanism of inhibition (eqn. 2) furnished an apparent inhibition constant of Ki= 10 μM for MP1, which is similar to the dissociation constant determined in the fluorescence binding assay for the binding of MP1 to unactivated ERK2. Thus, like the scaffold protein JIP, which can inhibit JNK [19], MP1 can inhibit the catalytic activity of ERK2.
Figure. 2. Competitive inhibition of MP1 towards EtsΔ138.

Initial velocity studies at 2 mM MgATP2- in the presence of three concentrations of MP1 (0, 25 and 50 μM) and varied concentrations of EtsΔ138 (25, 50, 100 and 200 μM). The data were fitted to eqn. 2 for competitive inhibition.
MP1 and the MP1•P14 complex inhibits the phosphorylation of MKK1G7B by ERK2
As MP1 inhibits the ability of ERK2 to phosphorylated Ets-1 and associates with both MKK1G7B and ERK2 we considered the possibility that MP1 could inhibit the ability of ERK2 to phosphorylate MKK1. This is significant because activated ERK2 phosphorylates MKK1 on Ser-292 and Thr-386 and inhibits it [12, 13]. Therefore, the ability of ERK2 (0.2 μM) to phosphorylate MKK1G7B (1 μM) in the presence and absence of saturating MP1 (66.5 μM) was assessed in the presence of 2 mM ATP (Fig 3A). Aliquots were taken at 0, 15, 30 and 60 min intervals and the reaction terminated by the addition of SDS sample buffer, followed by boiling. The proteins were then fractionated on a 15% SDS-PAGE gel before the gel was soaked in 10% TCA, to fix the proteins, and washed in phosphoric acid to remove excess ATP (Fig. 3C). The incorporation of radioactivity into MKK1G7B was determined using a phosphorimager and analyzed using the imaging software Imagequant. The extent of phosphorylation is plotted below the gel image (Fig 3C) and shows that saturating MP1 severely impedes the ability of ERK2 to phosphorylate MKK1G7B. As P14 binds MP1 to form a high affinity heterodimer [10], the ability of the complex to inhibit ERK2 was compared to MP1. Fig. 3B shows that 100 μM of the MP1•P14 complex also impedes the ability of ERK2 to phosphorylate MKK1. Note that phosphorylated MKK1G7B fractionates as two closely migrating bands on the gel.
Figure. 3.
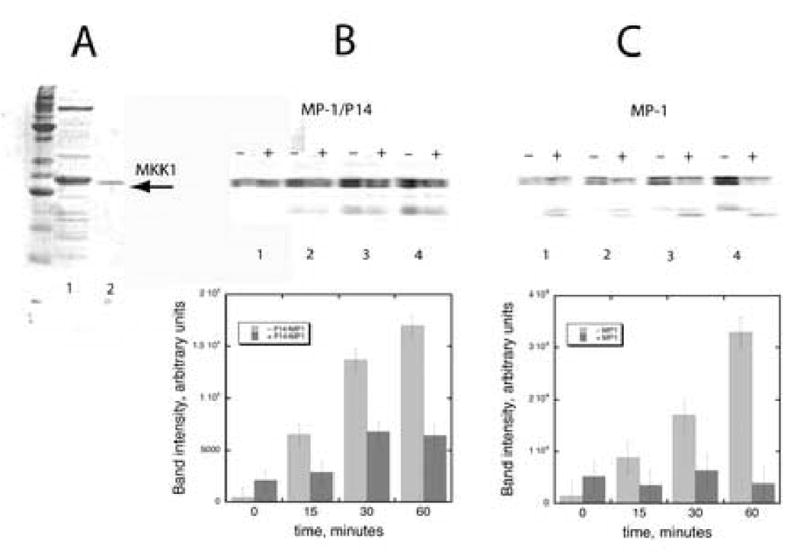
A. MKK1G7B—was expressed as a His6-tagged fusion protein in E.coli BL21(DE3) pLysS following induction at an OD600 of 0.8 with 0.5 mM IPTG. The protein was purified by Ni-NTA affinity chromatography (lane 1), followed by a Mono-Q HR5/5 purification step using a 0 to 500 mM NaCl gradient over the course of 20 min at 1 ml/min (lane 3). The protein eluted as a peak centered at 255 mM NaCl. Pooled protein fractions were dialyzed at 4°C into buffer containing 20 mM HEPES, pH 7.5; 2 mM DTT, 0.1 mM EDTA, 0.1 mM EGTA, 0.05 M KCl and 5% (v/v) glycerol, then concentrated in a Centricon-10 spin column (Amicon, Bedford, MA) at 4°C at 2.5 mg/ml, aliquoted, and stored at -80°C. B) Effect of MP1•P14 complex on the phosphorylation of MKK1G7B by active ERK2—1 μM MKK1G7B and 0.2 μM ERK2 were incubated with (+) or without (–) 100 μM MP1•P14. The reactions were performed in activation buffer at 27 °C as described in the method section. Aliquots were taken at 0, 15, 30 and 60 min intervals and the reaction terminated by the addition of SDS sample buffer followed by boiling and loaded to a 15% SDS-PAGE. After the gel was soaked in 10% TCA and washed in phosphoric acid to remove excess ATP it was subjected to phosphorimager analysis. A plot of the experimental data is shown below the gel. C) Effect of MP1 on the phosphorylation of MKK1G7B by active ERK2—1 μM MKK1G7B and 0.2 μM ERK2 were incubated with (+) or without (–) 66.5 μM MP1 and assayed as above. A plot of the experimental data is shown below the gel.
MP1 and MP1•P14 promote the phosphorylation of ERK2 by MKK1G7B
As MP1 was found to bind ERK2 and prevent it from phosphorylating MKK1G7B (Fig. 3C) it was next determined whether MP1 affects the ability of MKK1G7B to phosphorylate ERK2 under the same experimental conditions. MP1 was originally reported to promote the phosphorylation of ERK1 by a constitutively active form of MKK1 in vitro, but no effect on ERK2 was reported [20]. To examine the effect of MP1 on the phosphorylation of ERK2 by MKK1G7B, 0.2 μM MKK1G7B was incubated with 50 nM ERK2 at 27°C and aliquots were taken from the reaction mixture at 0, 30, 60, and 120 minute intervals. The reaction was then stopped and analyzed in an identical manner to the experiments described above. Fig. 4A shows a clear increase in the rate of ERK2 phosphorylation in the presence of MP1, indicating that MP1 promotes the phosphorylation. When the same experiment was performed using a 60-fold higher concentration of ERK2 (3 μM) no affect of MP1 on the rate of ERK2 phosphorylation was observed (data not shown). Similar results were obtained when the effect of the MP1-P14 complex on ERK2 phosphorylation was examined (Fig 4B).
Figure. 4.

A) Effect of MP1 on the phosphorylation of ERK2 by MKK1G7B —0.2 μM MKK1G7B and 50 nM ERK2 were incubated with (+) or without (–) 66.5 μM MP1. The reaction was performed in activation buffer at 27 °C as described in the text. Aliquots were taken at 0, 15, 30 and 60 min intervals and the reaction terminated by the addition of SDS sample buffer followed by boiling and loaded to a 15% SDS-PAGE. After the gel was soaked in 10% TCA and washed in phosphoric acid to remove excess ATP it was subjected to phosphorimager analysis. A plot of the experimental data is shown below the gel. B) Effect of MP1•P14 complex on the phosphorylation of MKK1G7B by active ERK2. A plot of the experimental data is shown below the gel.
Discussion
Taking advantage of the single cysteine in MP1, a fluorescently labeled form was prepared and subsequently used in fluorescence binding experiments to demonstrate that MP1 binds ERK1, ERK2 and MKK1G7B with similar low micromolar dissociation constants in vitro (Fig. 1).
Fig. 2 shows a Lineweaver-Burk plot for the inhibition of ERK2 by MP1, which supports the notion that MP1 inhibits the catalytic activity of ERK2 by binding competing with Ets-1 and preventing it from binding instead (Scheme 2). The inhibition constant of Ki = 10 μM that was derived from the fit in Fig. 2 suggests that MP1 binds activated and unactivated ERK2 with similar affinity. An alternative model where MP1 binds Ets-1 instead of ERK2 is not consistent with the observed competitive inhibition pattern. A competitive inhibition mechanism would account for the ability of MP1 to prevent ERK2 from phosphorylating MKK1 (Fig 3). However, MP1 binds both MKK1G7B and ERK2 (Fig 1), suggesting that the mechanism of inhibition is more complex. Remarkably, MP1 also promotes the phosphorylation of unactivated ERK2 by MKK1G7B when ERK2 is present at a low concentration (Fig. 4) where kcat/Km is the predominant term in the rate equation that governs the rate of phosphorylation (eqn. 1). Significantly, when ERK2 is present at a 60-fold higher concentration, where kcat is likely to be the predominant term, MP1 has no effect on the rate of ERK2 phosphorylation (data not shown).
Scheme 2.
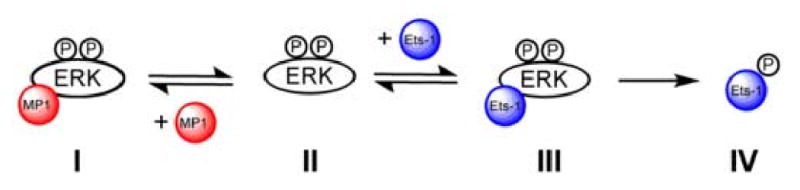
Competitive of inhibition ERK2 by MP1.
The models depicted in Schemes 3 and 4 may help explain these observations. By promoting the formation of complex VI between unactivated ERK2 and activated MKK1, which can undergo phosphoryl transfer to activate ERK2, MP1 may facilitate ERK2 activation in vivo (Scheme 3). Under conditions where the formation of complex V is favorable (e.g high concentration of ERK2) MP1 will have no catalytic effect, because, according to the model, it does not influence the rate of ERK phosphorylation within the complex (i.e. kp=k'p). A similar mechanism may underlie the ability of MP1 to promote the activation of MKK1 by B-raf [20]. In contrast, MP1 may bind complex VIII and inhibit the phosphorylation of MKK1 (Scheme 4). Further work is necessary to determine the exact stoichiometry of these complexes as MP1 has the ability to bind both ERK2 and MKK1 (Fig. 1). The data in Fig 3 and 4 suggest that the MP1•P14 complex appears to serve a similar role to MP1.
Scheme 3.
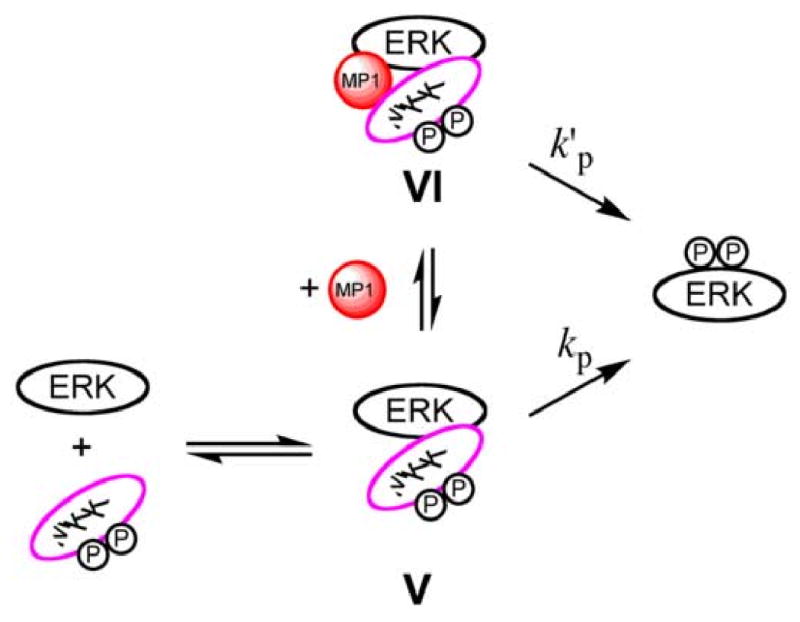
Simplified model to explain how MP1 stimulates ERK phosphorylation at low concentrations of ERK. Phosphorylation of ERK occurs within complexes V and VI with similar efficiency (kp=k'p). By stabilizing the interaction of MKK and ERK to form complex VI at low concentrations of either protein, MP1 can offer a catalytic advantage. Although only one molecule of MP1 is shown bound, the binding of two MP1 molecules cannot be ruled out.
Scheme 4.
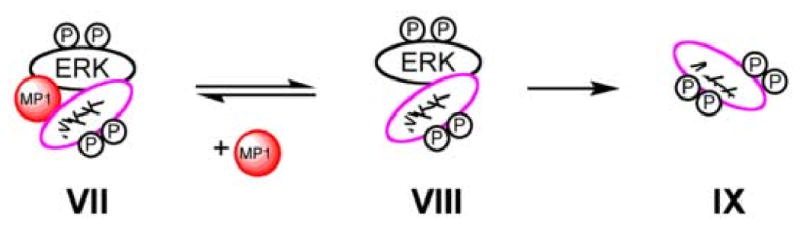
Simplified model of how MP1 binds prevents the feedback phosphorylation of MKK1 by ERK1/2. Complex VIII is catalytically competent with respect to the phosphorylation of MKK by ERK. The binding of MP1 to VIII to form VII inhibits the phosphorylation of MKK. Although only one molecule of MP1 is shown bound, the binding of two MP1 molecules cannot be ruled out.
In summary, MP1 may serve to promote the correct orientation of catalytic complexes in vivo, such as B-raf•MKK1 [20] and MKK1•ERK1/2 to promote the activation of ERK1/2, but inhibit the ability of the MKK1•ERK1/2 complex to down regulate ERK1/2.
Acknowledgments
This research was supported in part by the Welch Foundation (F-1390) and the NIH (GM59802).
Footnotes
MKK1G7B, constitutively active recombinant human mitogen-activated protein kinase kinase 1 (ΔN4/S218D/M219D/N221D/S222D) where ΔN4 indicates a deletion of residues 32–43
Publisher's Disclaimer: This is a PDF file of an unedited manuscript that has been accepted for publication. As a service to our customers we are providing this early version of the manuscript. The manuscript will undergo copyediting, typesetting, and review of the resulting proof before it is published in its final citable form. Please note that during the production process errors may be discovered which could affect the content, and all legal disclaimers that apply to the journal pertain.
References
- 1.Torii S, Yamamoto T, Tsuchiya Y, Nishida E. Cancer Sci. 2006;97:697–702. doi: 10.1111/j.1349-7006.2006.00244.x. [DOI] [PMC free article] [PubMed] [Google Scholar]
- 2.Bianco R, Melisi D, Ciardiello F, Tortora G. Eur J Cancer. 2006;42:290–294. doi: 10.1016/j.ejca.2005.07.034. [DOI] [PubMed] [Google Scholar]
- 3.Panka DJ, Atkins MB, Mier JW. Clin Cancer Res. 2006;12:2371s–2375s. doi: 10.1158/1078-0432.CCR-05-2539. [DOI] [PubMed] [Google Scholar]
- 4.Kohno M, Pouyssegur J. Prog Cell Cycle Res. 2003;5:219–224. [PubMed] [Google Scholar]
- 5.Pearson G, et al. Endocr Rev. 2001:153–183. doi: 10.1210/edrv.22.2.0428. [DOI] [PubMed] [Google Scholar]
- 6.Kolch W. Nat Rev Mol Cell Biol. 2005;6:827–837. doi: 10.1038/nrm1743. [DOI] [PubMed] [Google Scholar]
- 7.Schaeffer HJ, et al. Science. 1998;281:1668–1671. doi: 10.1126/science.281.5383.1668. [DOI] [PubMed] [Google Scholar]
- 8.Wunderlich W, et al. J Cell Biol. 2001;152:765–776. doi: 10.1083/jcb.152.4.765. [DOI] [PMC free article] [PubMed] [Google Scholar]
- 9.Teis D, Wunderlich W, Huber LA. Dev Cell. 2002;3:803–814. doi: 10.1016/s1534-5807(02)00364-7. [DOI] [PubMed] [Google Scholar]
- 10.Kurzbauer R, et al. Proc Natl Acad Sci U S A. 2004;101:10984–10989. doi: 10.1073/pnas.0403435101. [DOI] [PMC free article] [PubMed] [Google Scholar]
- 11.Lunin VV, et al. J Biol Chem. 2004;279:23422–23430. doi: 10.1074/jbc.M401648200. [DOI] [PubMed] [Google Scholar]
- 12.Saito Y, et al. FEBS Lett. 1994;341:119–124. doi: 10.1016/0014-5793(94)80252-1. [DOI] [PubMed] [Google Scholar]
- 13.Brunet A, Pages G, Pouyssegur J. FEBS Lett. 1994;346:299–303. doi: 10.1016/0014-5793(94)00475-7. [DOI] [PubMed] [Google Scholar]
- 14.Eblen ST, et al. Mol Cell Biol. 2004;24:2308–2317. doi: 10.1128/MCB.24.6.2308-2317.2004. [DOI] [PMC free article] [PubMed] [Google Scholar]
- 15.Waas WF, Dalby KN. Protein Expr Purif. 2001;23:191–197. doi: 10.1006/prep.2001.1491. [DOI] [PubMed] [Google Scholar]
- 16.Waas WF, Dalby KN. J Biol Chem. 2002;277:12532–12540. doi: 10.1074/jbc.M110523200. [DOI] [PubMed] [Google Scholar]
- 17.Mansour SJ, Candia JM, Matsuura JE, Manning MC, Ahn NG. Biochemistry. 1996;35:15529–15536. doi: 10.1021/bi961854s. [DOI] [PubMed] [Google Scholar]
- 18.Callaway KA, et al. Biochemistry. in press. [Google Scholar]
- 19.Dickens M, et al. Science. 1997;277:693–696. doi: 10.1126/science.277.5326.693. [DOI] [PubMed] [Google Scholar]
- 20.Catling AD, Schaeffer HJ, Reuter CW, Reddy GR, Weber MJ. Mol Cell Biol. 1995;15:5214–5225. doi: 10.1128/mcb.15.10.5214. [DOI] [PMC free article] [PubMed] [Google Scholar]