Abstract
Although paranoid personality is one of the most commonly diagnosed personality disorders and is associated with numerous negative life consequences, relatively little is known about the structural properties of this condition. This study examines whether paranoid personality traits represent a latent dimension or a discrete class (i.e., taxon). In study 1, we conducted taxometric analyses of paranoid personality disorder criteria in a sample of 731 patients participating in the Collaborative Longitudinal Study of Personality Disorders (CLPS) project who had been administered a semi-structured diagnostic interview for DSM-IV Personality Disorders. In study 2, we conducted parallel analyses of the Paranoia (PAR) scale of the Personality Assessment Inventory (PAI), using data from the PAI community and clinical normative data bases. Analyses across both self-report and interview-based indicators offered compelling support for a dimensional structure. Additionally, analyses of external correlates in these data sets suggested that dimensional models demonstrated stronger validity coefficients with criterion measures than dichotomous models.
Paranoid personality disorder (PPD) is characterized by a pervasive pattern of mistrust of other people (American Psychiatric Association, 2000; Bernstein & Useda, 2007), frequently occurring in conjunction with a hostile interpersonal style, emotional coldness, hypersensitivity to criticism, and rigidly held maladaptive beliefs about others’ motives. Prevalence estimates suggest it is one of the more commonly diagnosed personality disorders in the general population and in clinical settings (e.g., Grant et al., 2004; Torgersen, Kringlen, & Cramer, 2001). Moreover, it is characterized by significant impairment/dysfunction across multiple domains, such as increased risk for depression and anxiety disorders (Johnson, Cohen, Kasen, & Brook, 2005); violence and other criminal behavior (Johnson et al., 2000); suicide attempts (Overholser, Stockmeier, & Dilley, 2002); and global reductions in quality of life (Cramer, Torgersen, & Kringlen, 2006).
Despite the accumulated data on the prevalence and correlates of PPD, numerous questions remain unaddressed. For example, many questions remain about co-morbidity and differential diagnosis, both in relation to other Axis II disorders that share certain diagnostic features and in relation to psychotic disorders (e.g., paranoid schizophrenia) that also show signs of paranoia. As well, questions exist regarding the relative contribution of genetic and environmental factors in the etiology of paranoid personality, and the extent to which there is a shared genetic liability across other Cluster A PDs and schizophrenia-spectrum disorders (Asarnow et al., 2001; Kendler et al., 2006; Kendler, Myers, Torgerson, Neale, & Reichborn-Kjennerud, 2007; Nicolson et al., 2003).
Another area of controversy concerning paranoid personality is the extent to which manifest paranoid traits are best conceptualized as indicators of an underlying class or category, or as indicators of a dimensional construct. That is, do paranoid traits represent a discrete entity or “natural class” with non-arbitrary boundaries, supporting dichotomous distinctions between those who are “paranoid” and those who are “non-paranoid?” Or do they represent a continuum of severity in which diagnostic thresholds represent arbitrary cut points based on convention or some other decision rule? Such questions are relevant to understanding the contours of the disorder; they may also (at least indirectly) inform etiological models. For example, a paranoia taxon might represent a group of individuals who subsequently are shown to be selectively predisposed to develop symptoms of paranoid schizophrenia, or who might share a common genetic liability with those diagnosed with delusional disorder, in much the same way that a schizotypy taxon may serve as a predisposition to schizophrenia (Lenzenweger, 2006; Lenzenweger, McLachlan, & Rubin, 2007).
Given impending revisions to the DSM, research addressing the underlying structural properties of PDs may be particularly informative at this time. Compelling arguments have been put forth for replacing Axis II PD categories with dimensional models, with a growing body of literature indicating that (a) these syndromes can be adequately represented using dimensional models (e.g., Lynam & Widiger, 2001) and (b) most PDs investigated to date appear dimensional rather than categorical (for a review, see Haslam, 2007). However, schizotypy, which is related to schizotypal personality disorder, may have a categorical structure (Lenzenweger et al., 2007; however, see Rawlings, Williams, Haslam, & Claridge, 2008a, for recent evidence that schizotypy may have a dimensional structure). As such, a systematic set of latent class analyses of each PD may help inform revisions of the DSM.
Despite the potential importance of this topic, to date only one study has examined the latent structure of paranoid personality traits. Using SCID-II (First et al., 1997) PPD criteria, Arntz et al. (in press) reported taxometric analyses for a sample of 1,879 individuals, the vast majority of whom were seeking treatment at various mental health centers in the Netherlands or Belgium. Across multiple taxometric procedures (described in detail below), their results were consistent with a dimensional structure for PPD (as well as several other PD diagnoses).
As the first study of its kind, the Arntz et al. (in press) findings concerning paranoid personality are noteworthy, but their generalizability is constrained somewhat by the reliance on only one operationalization of paranoia. Although evidence supporting the validity of the SCID-II is generally strong, there is no one “gold standard” for assessing personality disorders (Morey et al., 2007) and this instrument does not produce data that are interchangeable with other well-validated semi-structured diagnostic interviews (Clark, 1992); in fact, direct comparisons across interviews generally suggest only modest-to-moderate levels of correspondence (Oldham et al., 1992). Ideally, taxometric analyses should be performed on various indicators drawn from multiple assessment domains (e.g., interview, self-report) to provide the most rigorous test of the underlying structure of the construct of interest. Another limitation of the Arntz et al. study—common to most taxometric research—is that it did not go beyond structural analyses of PPD to examine any particular implications of dimensional versus categorical findings. As noted by Watson (2006), the theoretical and pragmatic contribution of taxometric studies can be increased by comparing “the heuristic value and predictive power of categorical versus dimensional conceptualizations of the construct” (p. 3).
Given the limited research conducted to date on the taxon versus dimension issue in relation to paranoid traits, we examine this understudied issue using indicators drawn from two different assessment methodologies (self-report and structured interview). In study 1, we report taxometric analyses based on PPD criteria from a sample of patients from the Collaborative Longitudinal Study of Personality Disorders (CLPS) project who had been administered the Diagnostic Interview for DSM-IV Personality Disorders (DIPD-IV; Zanarini, Frankenburg, Sickel, & Yong, 1996). In study 2, we conduct parallel analyses on a widely used and well validated self-report measure of paranoid features, the Paranoia (PAR) scale of the Personality Assessment Inventory (PAI; Morey, 2007), using data from the PAI community and clinical normative data bases. Additionally, in accord with Watson’s (2006) recommendations, in both studies we supplement taxometric findings by comparing the relative utility of dimensional versus categorical models of paranoia in terms of their associations with theoretically relevant criterion measures. In Study 1, we compare PPD symptom counts and dichotomized PPD criteria in the prediction of global assessment of functioning (GAF) scores at a ten year follow-up. In Study 2, we examine continuous scores on PAR in comparison to a dichotomous classification system in terms of the amount of variance they explain in known correlates of paranoia, including self-reported depression and anxiety (Johnson et al., 2005), aggression (Johnson et al., 2000), and suicidal ideation (Overholser et al. 2002).
Study 1
Method
Participants
Participants were 731 patients with personality disorders (n = 629) or major depressive disorder recruited from multiple clinical sites for the CLPS project (see McGlashan et al., 2000, for sample details). The original CLPS cohort initially consisted of 668 participants who were to be tracked over the course of the study, but this was supplemented with a second wave of recruitment to increase the number of minority participants. Most (75%) of the 731 patients did not evidence PPD, 12% demonstrated subclinical paranoid features, and 13% of the sample met the criteria for PPD according to the DIPD interview described below. The mean age of participants was 32.50 (sd = 8.11). Women represented 64% of the sample; 69% were white, 15% were black, and 13% were Hispanic (3% “other”).
Measures
Diagnostic Interview for DSM-IV Personality Disorders (DIPD-IV)
The DIPD-IV (Zanarini et al 1996) is a semi-structured interview that assesses personality disorder criteria, which must be present over at least the previous two years to count toward the diagnosis. Adequate inter-rater reliability was found for all disorders diagnosed five times or more in a baseline sub-sample (Zanarini et al., 2000). The DIPD-IV is widely used in research and considerable evidence has accumulated in support of its construct validity (e.g., Ansell et al., 2007; Morey et al., 2007).
The DIPD includes seven items corresponding to the DSM-IV PPD diagnosis. Each item was scored on a 3-point scale (0 = absent, 1 = subclinical, 2 = clinical). To provide sufficient range for the subsequent taxometric analyses, these items were combined to create composite indicators. Because the item concerning suspicious of the fidelity of spouse or partner had the lowest corrected item-total correlation (.38) and correlated the least strongly with any of the other items, it was not included in the composites. Items with the highest correlations were combined to form the three indicators: (a) “reluctant to confide” and “suspects being exploited,” (r = .55) (b) “doubts loyalty” and “reads hidden meanings,” (r = .44) and (c) “bears grudges” and “perceives character attacks.” (r = .38).
DSM-IV Global Assessment of Functioning (GAF)
In the CLPS study, the original 668 participants (Gunderson et al., 2000) were interviewed annually with diagnostic, personality, and functional measures. As part of the study, examiners rated DSM-IV Global Assessment of Functioning (GAF) scale at each time point. Follow-up GAF data were available for 430 of these original 668 participants at the 10 year follow-up (64%). Importantly, those with versus without follow-up data did not differ in terms of their mean PPD summed score (4.4 versus 4.5) or in terms of whether they met diagnostic criteria for PPD (12% versus 14%).
Taxometric Analyses
Two nonredundant taxometric procedures were used for the analyses: MAMBAC (Mean Above Minus Below A Cut; Meehl & Yonce, 1994) and MAXCOV (MAXimum COVariance; Meehl & Yonce, 1996).1 MAMBAC requires two indicators, the input indicator x and the output indicator y. Cuts are made at regular intervals along the input indicator (100 in the present study); at each cut the difference between the mean score on the output indicator for those cases above the cut and the mean scores for those cases below the cut is graphed on the y-axis. If the construct is taxonic, the graph should be convex. Dimensional constructs typically yield a concave graph.
MAXCOV requires three indicators. The input indicator is placed along the x axis, and the other two indicators are used as outputs. The sample is divided into a series of overlapping windows along the x axis. We grouped the data into 200 subsamples using windows with .90 overlap.2 The covariance between the two output indicators within each window is plotted as the y value for that window. When there is a taxon, relatively pure subsamples of taxon members (scoring high on each of the indicators) and complement members (scoring low on each of the indicators) yield weak associations between output indicators. In contrast, subsamples that contain a mixture of taxon and complement members yield large covariances. Therefore, taxonic data should yield curves that peak near the window containing a roughly equal mixture of taxon and complement members, whereas dimensional data tend to yield curves with no clear peak.
The shape of taxometric curves can be influenced by a variety of factors, such as the skew of the indicators and the base rate of the putative taxon. As a result, taxonic and dimensional data do not always yield the prototypical shapes described above. Simulated comparison data that reproduce many of the characteristics of the actual data, while varying the latent structure (taxonic or dimensional), can assist with the interpretation of taxometric graphs. For the present study, each procedure was accompanied by analyses of 100 samples apiece of taxonic and dimensional comparison data (Ruscio et al., 2007). Based on the number of participants who met the diagnostic criteria for PPD, the base rate for the simulated taxonic data was set at 13%. For descriptions of the generation and use of comparison data in taxometric research, see Ruscio et al. (2006), Ruscio and Kaczetow (2008), or Ruscio et al. (2007).
Once simulation data are created and graphed, an objective index to quantify the extent to which results for the actual data are more similar to the taxonic or dimensional comparison data may be calculated. The Comparison Curve Fit Index (CCFI) ranges from 0 (strong support for dimensional structure) to 1 (strong support for taxonic structure), with .5 indicating equivalent support for either structure. This approach permits researchers to test whether the data fit better with either a dimensional or taxonic model, so that dimensional findings are not merely null results (see Ruscio, 2007 for a detailed discussion of this issue). Several large studies show that across a wide range of data conditions, the CCFI distinguishes taxonic and dimensional data with an impressive degree of accuracy (Ruscio & Marcus, 2007; Ruscio et al., 2007), especially when the various taxometric procedures yield consistent CCFIs. For example, Ruscio (2007) generated 25,000 data sets that varied across a wide range of conditions and analyzed each using MAMBAC and MAXEIG (a multivariate extension of MAXCOV). When the two CCFI values were in agreement (either both above or both below .5), taxonic and dimensional data sets were identified correctly 99.0% of the time.
Results
Taxometric analyses require valid indicators that are capable of discriminating between the presumptive taxon and complement groups. These three composite indicators from the DIPD demonstrated strong validity; when the sample was divided into those who met the diagnostic criteria for PPD and those who did not, the three indicator validities were 1.58, 2.02, and 2.34 standard deviation units.
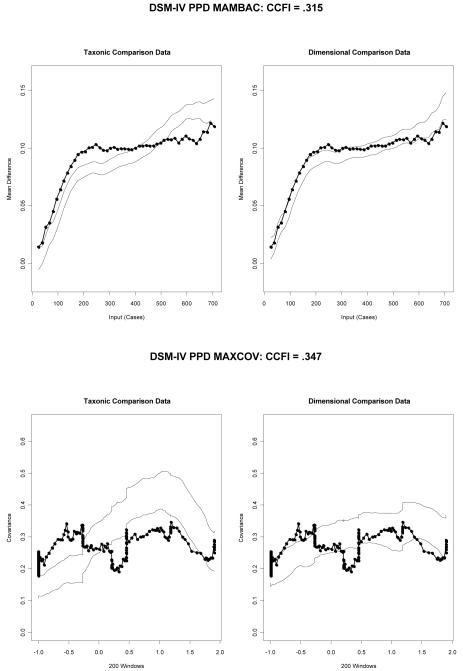
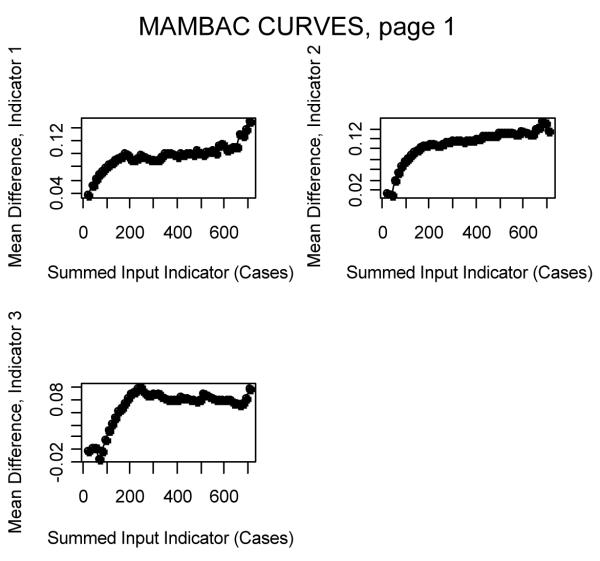
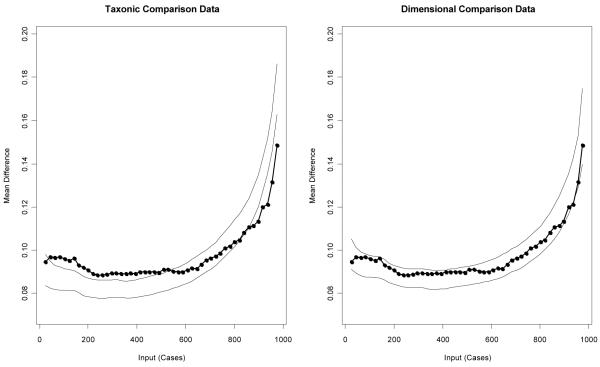
For the MAMBAC analyses, each composite indicator served as the output indicator for one graph, with the remaining two composite indicators summed to create the input indicator.3 None of the three curves exhibited an inverted-U shape that would be clearly indicative of a taxonic structure.4 The average of the three curves was more similar to the dimensional comparison data than to the taxonic comparison data (Figure 1, top graph), with a CCFI of .315.
Figure 1.
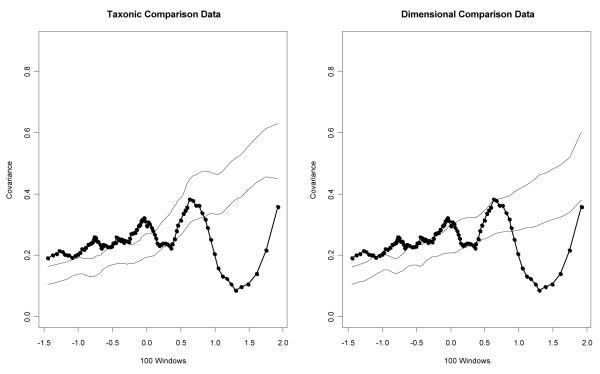
Average MAMBAC and MAXCOV curves for the research data along with taxonic and dimensional comparison data for the three DIPD composite indicators. To stabilize the shape of the curves, the analyses were replicated 10 times by randomly shuffling the cases with equal scores on the input indicator and recalculating the output indicator, with the average values across the 10 replications serving as the final results (Ruscio et al., 2006). Dark lines on the curves represent the actual data and the lighter lines represent one standard deviation above and below the average for each type of comparison data. CCFI = Comparison Curve Fit Index.
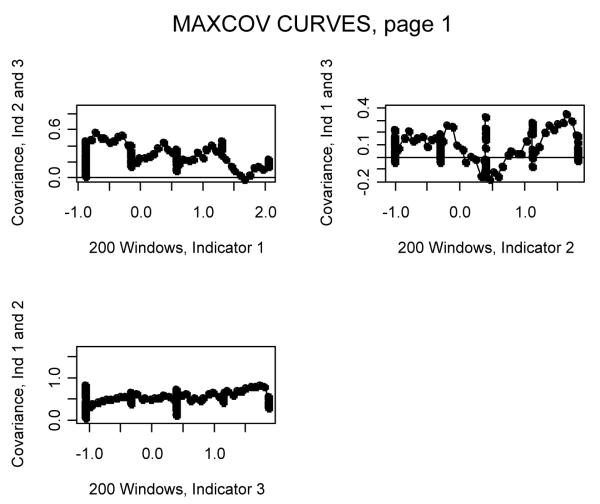
Two of the three MAXCOV curves were flat and the third had multiple peaks, none of which is consistent with a taxonic structure.5 Furthermore, the actual data were more similar to the dimensional comparison data than to the taxonic comparison data, with a CCFI of .347 (Figure 1, bottom graph).
Comparison of Dimensional and Dichotomous Models
To examine the relative utility of continuous versus categorical models, we next computed correlations between the GAF scores and (a) the summed PPD scores, and (b) a dichotomous PPD indicator, using the estimated base rate averaged across the two taxometric analyses (23%). Although there are various means by which participants can be classified into the taxon or the complement group (e.g., using Bayes’ theorem), extensive Monte Carlo evidence suggests that using the estimated base rate is at least as effective as more complicated procedures (Ruscio, 2009).
The GAF correlation for the summed PPD score was −.30 (p < .001). By comparison, it was only −.17 (p < .001) for the dichotomized score. As such, the summed PPD variable explained more than three times the amount of variance (r2 = .09) than did a taxometrically-derived categorical predictor (r2 = .029) for this criterion measure. Similar results were obtained if one were to use the established cut-off for the DIPD diagnosis of PPD, which resulted in the base rate of 13% noted earlier. The correlation with GAF scores was only −.15 (p < .01), indicating that the use of this diagnostic threshold explained slightly more than 2% of the variance (r2 = .023) in these scores.
Study 2
Method
Participants
The PAI protocols that were used in this study consisted of the community (n = 1,000) and clinical (n = 1,246) normative samples (Morey, 2007). Because separate taxometric analyses with each sample yielded similar dimensional results,6 the two samples were combined to form one large sample (N = 2,246). In the entire sample, 257 participants (11.4%) had PAR T-scores in the clinical range (≥ 70). Most of these cases (222) were drawn from the clinical sample.
Measure
PAI (Morey, 2007). The PAI is a 344-item self-report instrument containing 22 non-overlapping validity, clinical, treatment consideration, and interpersonal scales. The primary PAI scale of interest in this study, PAR, includes 24 items that are organized into three subscales: Hypervigilance (PAR-H), Persecution (PAR-P) and Resentment (PAR-R). The internal consistency for the PAR scale was .85 in the community sample and .89 in the clinical sample, whereas such estimates for the subscales ranged from .64 to .83 in the two samples. Supportive evidence for the validity of the PAR scale has been reported in a number of different correlational and criterion group studies. For example, PAR correlates highly with other self-report measures of paranoia (e.g., MMPI Pa and MCMI Paranoia scales) and elevated scores are associated with heightened rates of defiance, aggression, and paranoid delusions in institutional settings (see Morey, 2007, pp. 196-203, for a recent summary).
To compare the relative utility of PAR-based dimensional versus categorical models of paranoia, we selected several theoretically relevant scales from the PAI to examine in terms of the concurrent validity of each approach. These correlates consisted of measures of internalizing syndromes (i.e., PAI Depression, Anxiety, and Anxiety-Related Disorders scales), psychotic-spectrum symptomatology (Schizophrenia and Mania scales), and personality pathology (Antisocial and Borderline Features scales), as well as treatment consideration scales tapping constructs of theoretical interest (i.e., Suicidal Ideation, Nonsupport, Stress, Aggression, and Treatment Rejection). Evidence supporting the construct validity of each of these 12 PAI scales is summarized in the PAI manual (Morey, 2007). These scales were selected because they operationalize constructs that are either empirically demonstrated to be associated with paranoia (e.g., depressive and anxiety symptoms, aggression, other dysfunctional personality traits) or rationally/intuitively would be expected to co-occur with paranoid symptoms (e.g., perceptions of non-support, elevated stress, motivation for change).
Results
Taxometric Analyses
When the sample was divided into those likely to have or not have clinically significant paranoid symptoms (PAR T-scores above or below 70), the three PAR subscale indicator validities were 2.10, 2.22, and 2.61. Based on the number of participants with PAR T-scores ≥ 70, the base rate for the simulated taxonic data was set at 11%.
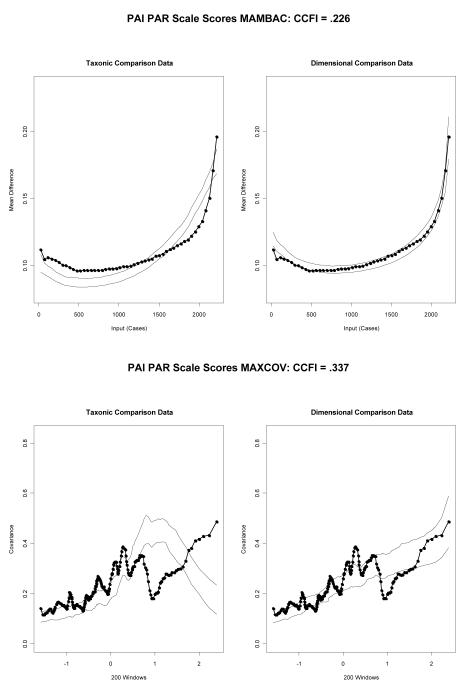
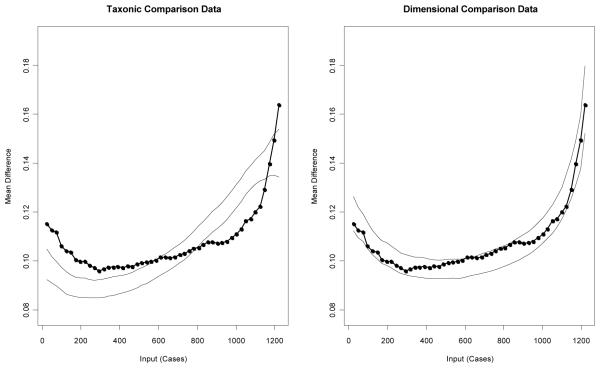
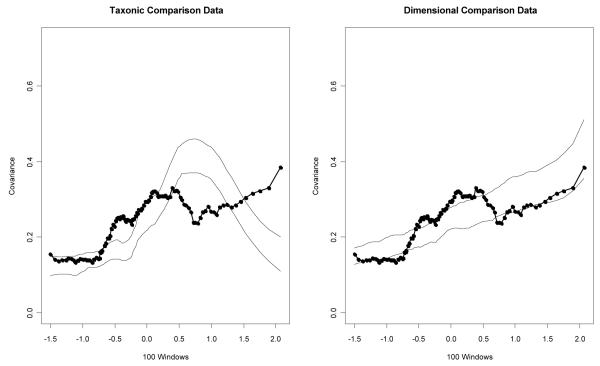
For the MAMBAC analyses, each PAR subscale served as both an input and output indicator, yielding six MAMBAC curves. None of the curves exhibited an inverted-U shape that would be clearly indicative of a taxonic structure.7 The average of the six curves was much more similar to the dimensional comparison data than to the taxonic comparison data (Figure 2, top graph), with a CCFI of .226.8
Figure 2.
Average MAMBAC and MAXCOV curves for the 3 PAR indicators.
Individually, the three MAXCOV curves each had multiple peaks, which is not consistent with a taxonic structure.9 Furthermore, the actual data were more similar to the dimensional comparison data than to the taxonic comparison data (Figure 2, bottom graph), with a CCFI of .337.10
Comparison of Dimensional and Dichotomous Models
To examine the relative utility of continuous versus categorical models, we next computed correlations between dimensional and dichotomous PAR scores and several theoretically relevant PAI scales (described in the Method) for the clinical normative group. Dichotomous PAR scores were based on a cut score (PAR > 61T) that split the sample into two groups matching the base rate of the putative taxon for the clinical sample across the two taxometric analyses (34%). In each instance, the association between continuous PAR scores and the criterion scale was stronger than the association between the dichotomous PAR scale and the criterion (Appendix 7). Not surprisingly, results of a sign test indicated this to be a significant difference in favor of continuous PAR scores, p < .001. Aggregating across the correlations, the magnitude of the difference in the amount of variance explained was fairly substantial: dimensional mean r = .53 (mean r2 = .28) versus dichotomous mean r = .44 (mean r2 = .19). Similar results were obtained if one were to use a cut score of 70T on PAR to create two groups: the mean r2 for these analyses was only .15.
Discussion
Prior to the present findings, only one study (Arntz et al., in press) using one measure of PPD (SCID-II) had examined whether this construct constitutes a discrete category or a dimension. The issue of latent structure is especially relevant to PPD, because a dimensional latent structure for paranoia may represent a spectrum that cuts across various other diagnostic categories (e.g., other personality disorders, delusional disorder, paranoid schizophrenia; Bernstein & Useda, 2007). The present findings, which were derived from both clinical and community samples and based on analyses of both self-report and interview-based indicators, offer compelling and uniform support for the position that paranoid traits are dimensional. These results, in conjunction with those of Arntz et al., are consistent with most—although not all—taxometric research on personality disorders (Haslam, 2007). As such, our data bolster recent arguments that DSM-V should move to a dimensional model of personality pathology.
Moreover, from a somewhat more pragmatic perspective, the correlations with theoretically relevant criterion variables (e.g., global functioning, depression, aggression) reported for the dimensional and categorical models of paranoia in Studies 1 and 2 support the argument that there are practical advantages to using continuous scores. Dimensional scores uniformly explained more variance in these correlates than did group classifications. These results are similar to those reported for other direct comparisons of the validity of dimensional versus categorical models of DIPD-IV personality disorders that have been reported for the CLPS data (see Morey et al., 2007, Table 1, p. 987). This supports the argument that validity coefficients most likely will be attenuated when forcing dimensions into discrete groups—as typically would be expected based on the statistical implications of dichotomizing what are inherently continuous constructs (McCallum, Zhang, Preacher, & Rucker, 2002). In fact, the reductions in the magnitude of the correlations obtained across our dimensional and dichotomous methods of scoring the predictor variables align quite closely with the types of decreases in magnitude that would be evident when bifurcating an otherwise dimensional distribution into an artificial dichotomy (see McCallum et al., formula 1, p. 24). Moreover, using Monte Carlo data, McCallum et al. also demonstrate that even when dichotomized variables do result in stronger effect sizes than continuous measures it is likely to be the result of sampling error rather than a reflection of the true population correlation.
The fact that dimensional results for paranoid traits emerged for both self-report and interview data is important on two fronts. Most obviously, convergence of dimensional findings across assessment modalities provides a more rigorous test of the consistency of a knowledge claim than does reliance on a single modality, particularly when correlations across those two assessment domains are not especially high. Somewhat more specific to PPD, behavioral genetics research has suggested that self-report and interview data may tap distinct aspects of the liability for PPD (Kendler et al., 2007), with interview data indexing a broader array of genetic risk factors. As such, inconsistencies in taxometric results across our instruments would have raised numerous complicated questions concerning etiological and measurement issues. Fortunately, such questions are obviated by convergent findings across our samples.
The results of our study raise various questions regarding the relationship between PPD and schizotypy. Our dimensional findings for PPD stand in contrast to research that has, until recently, uniformly demonstrated schizotypy to be taxonic. This is puzzling because PPD and schizotypal personality disorder typically demonstrate high rates of comorbidity at the overt symptom level (Morey, 1988) and, more importantly, behavioral genetic research suggests that the Cluster A personality disorders as a group share a sizeable portion of their environmental and genetic liability (Kendler et al., 2006).11 As such, it seems peculiar (though not impossible) that PPD would be dimensional whereas schizotypy would be a discrete class. One possible explanation for this finding is that the two conditions fall on the same spectrum, but that the specific indicators used to identify schizotypy are sufficiently similar with respect to their ICC parameters to result in an artifactual taxon (Morey, 1993). It is also worth noting that recent research has begun to question the taxonic status of schizotypy (Rawlings et al., 2008). Alternatively, it could be argued that schizotypy may have a taxonic latent structure, whereas the broader diagnosis of schizotypal personality disorder, which includes additional diagnostic criteria and is not entirely synonymous with schizotypy, may be dimensional.
Limitations of our research and qualifications to our conclusions should be briefly noted. First, although our results converge across instruments, they are based on only two measures of paranoid traits. Replication of our findings using other operationalizations of paranoid traits will be important in terms of confirming (or failing to confirm) our results. Related to this point, the DSM criteria reflected in the DIPD have been criticized (Bernstein & Useda, 2007) as insufficiently representative of affective, interpersonal and behavioral symptoms historically thought to be prototypical of PPD (e.g., introversion, rigidity). Although some of these features are incorporated into the item content of the PAR subscales, future research might benefit from the use of a broader collection of putative paranoid personality traits. Additionally, although our data suggest that the boundary between being “paranoid” and “not paranoid” is an arbitrary determination, the results of taxometric analyses should not be misinterpreted to suggest that paranoid traits lack any distinctiveness as a diagnostic condition per se. Paranoid traits may certainly exist as a distinctive syndrome that is separable from other personality disorders, even if those traits are distributed dimensionally within the population. Even here, however, research on the co-morbidity and underlying factor structure of personality disorders suggest that paranoid traits covary with other personality disorder criteria at an alarmingly high rate (e.g., Morey, 1988; Ullrich, & Marneros, 2004). Such heterogeneity does raise questions about the distinctiveness of PPD as a condition that is separable from other disorders, as opposed to a dimension that cuts across various other conditions.
Finally, although we believe our results and the convergent findings of Arntz et al. (in press) strongly support the existence of a dimensional structure for PPD, we should note that other researchers argue that the lack of taxonic findings should be construed as essentially null effects rather than as evidence of dimensional structure (e.g., Beauchaine, Lenzenweger, & Waller, 2008). We believe, as do various other researchers (e.g., Rawlings, Williams, Haslam, & Claridge, 2008b; Ruscio et al., 2006), that the results of studies such as ours provide compelling affirmative evidence of the dimensional status of a latent construct rather than simply evidence of a failure to demonstrate the existence of a taxon, but we acknowledge that this is a point of considerable debate in the field at the moment.
Appendix 1
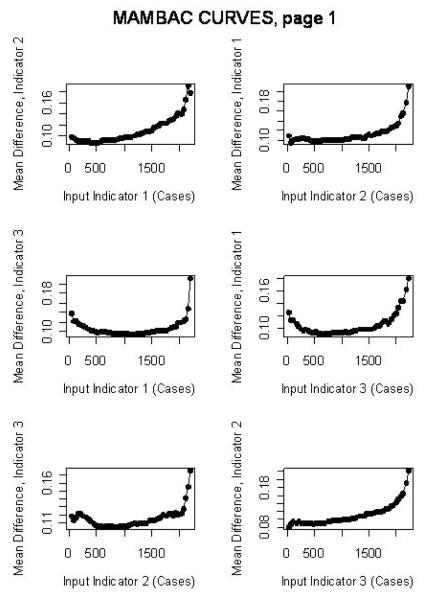
Individual MAMBAC Curves for Study 1
Appendix 2
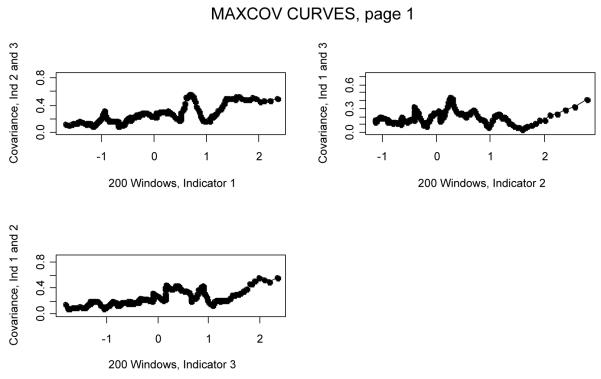
Individual MAXCOV Curves for Study 1
Appendix 3
Individual MAMBAC Curves for Study 2
Appendix 4
Study 2 PAI PAR Scores, Community Sample MAMBAC: CCFI = .285
Study 2 PAI PAR Scores, Clinical Sample MAMBAC: CCFI = .208
Appendix 5
Individual MAXCOV Curves for Study 2
Appendix 6
Study 2 PAI PAR Scores, Community Sample MAXCOV: CCFI = .441
Study 2 PAI PAR Scores, Clinical Sample MAXCOV: CCFI = .340
Appendix 7
Study 2 Correlations between Continuous and Dichotomous PAR Scores and Other Theoretically Relevant PAI Scales in the Clinical Normative Sample
| PAI Scale | PAR (Continuous) |
PAR > 61T (Dichotomous) |
|---|---|---|
| Depression | .57 | .48 |
| Anxiety | .53 | .45 |
| Anxiety-Related Disorders |
.58 | .47 |
| Mania | .41 | .34 |
| Schizophrenia | .69 | .59 |
| Antisocial Features | .44 | .35 |
| Borderline Features | .68 | .55 |
| Aggression | .53 | .43 |
| Suicide | .44 | .38 |
| Stress | .51 | .43 |
| Nonsupport | .66 | .55 |
| Treatment Rejection | −.32 | −.26 |
Note. N = 1,246. All correlations significant at p < .001.
Footnotes
L-Mode, a third nonredundant taxometric procedure, was not used in the present studies because L-Mode appears to be most accurate when there are a large number of indicators (Waller & Meehl, 1998) and the current studies each only used three indicators.
Overlapping windows are more typically used with MAXEIG, the multivariate extension of MAXCOV. However, Ruscio et al. (2006) have argued that because overlapping windows yield more data points than do nonoverlapping intervals, they produce more stable and interpretable graphs with either MAXCOV or MAXEIG.
Because the DIPD scores only varied from 0 to 4 and they were positively skewed (average skew across the 3 indicators = .57), we summed the remaining indicators to form the input to increase the range of scores along the x-axis. This procedure reduced the number of ties at each cut point and yielded more stable curves.
Consistent with this interpretation, we provided 3 advanced (post-M.A.) graduate students who were blind to the study aims (and CCFI results) with training on the interpretation of taxometric graphs and asked them to rate independently each of the 3 curves (Appendix 1) as dimensional, ambiguous, or taxonic. Eight of the 9 ratings were dimensional; 1 student rated 1 graph as ambiguous.
Similar to the MAMBAC results, the 3 raters evaluated the individual curves (Appendix 2) and independently rated whether they appeared dimensional, ambiguous, or taxonic. Six of the 9 ratings were dimensional, 2 were ambiguous, and 1 was taxonic.
Although combining a clinical and community sample runs the risk of creating an institutional “pseudo-taxon” (Cole, 2004), if this combined sample also were to yield a dimensional structure it would provide strong evidence in support of a dimensional model.
The 3 advanced graduate students’ independent ratings of the 6 MAMBAC curves (Appendix 3) resulted in 15 dimensional and 3 taxonic ratings.
When the community and clinical samples were analyzed separately, the MAMBAC CCFIs were .285 and .208, respectively (Appendix 4).
Of the 9 total ratings provided by the 3 advanced graduate students for the 3 MAXCOV curves (Appendix 5), 6 were dimensional, 2 were taxonic, and 1 was ambiguous.
When the community and clinical samples were analyzed separately, the CCFIs were .441 and .340, respectively (Appendix 6).
To further complicate matters, however, schizotypy appears to have clear genetic linkages to schizophrenia, yet the results for PPD in two large-scale studies have been inconsistent (Asarnow et al., 2001; Nicolson et al., 2003).
Publisher's Disclaimer: The following manuscript is the final accepted manuscript. It has not been subjected to the final copyediting, fact-checking, and proofreading required for formal publication. It is not the definitive, publisher-authenticated version. The American Psychological Association and its Council of Editors disclaim any responsibility or liabilities for errors or omissions of this manuscript version, any version derived from this manuscript by NIH, or other third parties. The published version is available at www.apa.org/pubs/journals/abn.
Contributor Information
John F. Edens, Texas A&M University
David K. Marcus, University of Southern Mississippi
Leslie C. Morey, Texas A&M University
References
- Ansell EB, Sanislow CA, McGlashan TH, Grilo C. Psychosocial impairment and treatment utilization by patients with borderline personality disorder, other personality disorders, mood and anxiety disorders, and a healthy comparison group. Comprehensive Psychiatry. 2007;48:329–336. doi: 10.1016/j.comppsych.2007.02.001. [DOI] [PubMed] [Google Scholar]
- Arntz A, Bernstein D, Gielen D, vanNieuwenhuyzen M, Penders K, Haslam N, Ruscio J. Taxometric evidence for the dimensional structure of Cluster-C, Paranoid, and Borderline Personality Disorders. Journal of Personality Disorders. doi: 10.1521/pedi.2009.23.6.606. (in press) [DOI] [PubMed] [Google Scholar]
- Asarnow RF, Nuechterlein KH, Fogelson D, Subotnik KL, Payne DA, Russell AT. Schizophrenia and schizophrenia-spectrum disorders in the first-degree relatives of children with schizophrenia. Archives of General Psychiatry. 2001;58:581–588. doi: 10.1001/archpsyc.58.6.581. [DOI] [PubMed] [Google Scholar]
- Beauchaine TP, Lenzenweger MF, Waller NG. Schizotypy, taxometrics, and disconfirming theories in soft science. Comment on Rawlings, Williams, Haslam, and Claridge. Personality and Individual Differences. 2008;44:1652–1662. [Google Scholar]
- Bernstein DP, Useda J. Paranoid personality disorder. In: O’Donohue W, Fowler K, Lilienfeld S, editors. Personality disorders: Toward the DSM-V. Sage; Thousand Oaks, CA: 2007. pp. 41–62. [Google Scholar]
- Clark L. Resolving taxonomic issues in personality disorders. Journal of Personality Disorders. 1992;6:360–376. [Google Scholar]
- Cole DA. Taxometrics in psychopathology research: An introduction to some of the procedures and related methodological issues. Journal of Abnormal Psychology. 2004;113:3–9. doi: 10.1037/0021-843X.113.1.3. [DOI] [PubMed] [Google Scholar]
- Cramer V, Torgersen S, Kringlen E. Personality disorders and quality of life. A population study. Comprehensive Psychiatry. 2006;47:178–184. doi: 10.1016/j.comppsych.2005.06.002. [DOI] [PubMed] [Google Scholar]
- Grant BF, Hasin DS, Stinson FS, Dawson D, Chou S, Ruan W, et al. Prevalence, correlates, and disability of personality disorders in the United States: Results from the National Epidemiologic Survey on Alcohol and Related Conditions. Journal of Clinical Psychiatry. 2004;65:948–958. doi: 10.4088/jcp.v65n0711. [DOI] [PubMed] [Google Scholar]
- Haslam N. The latent structure of mental disorders: A taxometric update on the categorical vs dimensional debate. Current Psychiatry Reviews. 2007;3:172–177. [Google Scholar]
- Johnson JG, Cohen P, Kasen S, Brook JS. Personality disorder traits associated with risk for unipolar depression during middle adulthood. Psychiatry Research. 2005;136:113–121. doi: 10.1016/j.psychres.2005.02.007. [DOI] [PubMed] [Google Scholar]
- Johnson JG, Cohen P, Smailes EM, Kasen S, Oldham JM, Skodol AE. Adolescent personality disorders associated with violence and criminal behavior during adolescence and early adulthood. American Journal of Psychiatry. 2000;157:1406–1412. doi: 10.1176/appi.ajp.157.9.1406. [DOI] [PubMed] [Google Scholar]
- Kendler KS, Czajkowski N, Tambs K, Torgerson S, Aggen S, Neale M, et al. Dimensional representations of DSM-IV cluster A personality disorders in a population-based sample of Norwegian twins: A multivariate study. Psychological Medicine. 2006;36:1583–1591. doi: 10.1017/S0033291706008609. [DOI] [PubMed] [Google Scholar]
- Kendler KS, Myers J, Torgerson S, Neale M, Reichborn-Kjennerud T. The heritability of cluster A personality disorders assessed by both personal interview and questionnaire. Psychological Medicine. 2007;37:655–665. doi: 10.1017/S0033291706009755. [DOI] [PubMed] [Google Scholar]
- Lenzenweger MF. Schizotypy: An organizing framework for schizophrenia research. Current Directions in Psychological Science. 2006;15:162–166. [Google Scholar]
- Lenzenweger MF, McLachlan G, Rubin DB. Resolving the latent structure of schizophrenia endophenotypes using expectation-maximization-based finite mixture modeling. Journal of Abnormal Psychology. 2007;116:16–29. doi: 10.1037/0021-843X.116.1.16. [DOI] [PubMed] [Google Scholar]
- Lynam D, Widiger T. Using the five factor model to represent the personality disorders: An expert consensus approach. Journal of Abnormal Psychology. 2001;110:401–412. doi: 10.1037//0021-843x.110.3.401. [DOI] [PubMed] [Google Scholar]
- McCallum RC, Zhang S, Preacher KJ, Rucker DD. On the practice of dichotomization of quantitative variables. Psychological Methods. 2002;7:19–40. doi: 10.1037/1082-989x.7.1.19. [DOI] [PubMed] [Google Scholar]
- McGlashan TH, Grilo CM, Skodol AE, Gunderson JG, Shea MT, Morey LC, et al. The Collaborative Longitudinal Personality Disorders Study: Baseline Axis I/II and II/II diagnostic co-occurrence. Acta Psychiatrica Scandinavica. 2000;102:256–264. doi: 10.1034/j.1600-0447.2000.102004256.x. [DOI] [PubMed] [Google Scholar]
- Meehl PE. Bootstraps taxometrics: Solving the classification problem in psychopathology. American Psychologist. 1995;50:266–274. doi: 10.1037//0003-066x.50.4.266. [DOI] [PubMed] [Google Scholar]
- Morey LC. Personality disorders in DSM-III and DSM-III-R: Convergence, coverage, and internal consistency. American Journal of Psychiatry. 1988;145:573–577. doi: 10.1176/ajp.145.5.573. [DOI] [PubMed] [Google Scholar]
- Morey LC. Categories in personality disorder: Would we know them if we saw them? Psychological Inquiry. 1993;4:111–113. [Google Scholar]
- Morey LC. The Personality Assessment Inventory professional manual. 2nd ed Psychological Assessment Resources; Lutz, FL: 2007. [Google Scholar]
- Morey LC, Hopwood C, Gunderson JG, Skodol AE, Shea MT, et al. Comparison of alternative models for personality disorders. Psychological Medicine. 2007;37:983–994. doi: 10.1017/S0033291706009482. [DOI] [PubMed] [Google Scholar]
- Nicolson R, Brookner FB, Lenane M, Gochman P, Ingraham LJ, Egan MF, et al. Parental schizophrenia spectrum disorders in childhood-onset and adult-onset schizophrenia. American Journal of Psychiatry. 2003;160:490–495. doi: 10.1176/appi.ajp.160.3.490. [DOI] [PubMed] [Google Scholar]
- Oldham JM, Skodol AE, Kellman H, Hyler S, Rosnick L, Davies M. Diagnosis of DSM-III-R personality disorders by two structured interviews: Patterns of comorbidity. American Journal of Psychiatry. 1992;149:213–220. doi: 10.1176/ajp.149.2.213. [DOI] [PubMed] [Google Scholar]
- Overholser JC, Stockmeier C, Dilley G. Personality disorders in suicide attempters and completers: Preliminary findings. Archives of Suicide Research. 2002;6:123–133. [Google Scholar]
- Rawlings D, Williams B, Haslam N, Claridge G. Taxometric analysis supports a dimensional latent structure for schizotypy. Personality and Individual Differences. 2008a;44:1640–1651. [Google Scholar]
- Rawlings D, Williams B, Haslam N, Claridge G. Is schizotypy taxonic? Response to Beauchaine, Lenzenweger, and Waller. Personality and Individual Differences. 2008b;44:1663–1672. [Google Scholar]
- Ruscio J. Assigning cases to groups using taxometric results: An empirical comparison of classification techniques. Assessment. 2009;16:55–70. doi: 10.1177/1073191108320193. [DOI] [PubMed] [Google Scholar]
- Ruscio J. Taxometric analysis: An empirically-grounded approach to implementing the method. Criminal Justice and Behavior. 2007;34:1588–1622. [Google Scholar]
- Ruscio J, Haslam N, Ruscio AM. Introduction to the taxometric method: A practical guide. LEA; Mahwah, NJ: 2006. [Google Scholar]
- Ruscio J, Kaczetow W. Simulating multivariate nonnormal data using an iterative algorithm. Multivariate Behavioral Research. 2008;43:355–381. doi: 10.1080/00273170802285693. [DOI] [PubMed] [Google Scholar]
- Ruscio J, Marcus DK. Detecting small taxa using simulated comparison data: A reanalysis of Beach, Amir, and Bau’s (2005) data. Psychological Assessment. 2007;19:241–246. doi: 10.1037/1040-3590.19.2.241. [DOI] [PubMed] [Google Scholar]
- Ruscio J, Ruscio AM, Meron M. Applying the bootstrap to taxometric analysis: Generating empirical sampling distributions to help interpret results. Multivariate Behavioral Research. 2007;42:349–386. doi: 10.1080/00273170701360795. [DOI] [PubMed] [Google Scholar]
- Torgersen S, Kringlen E, Cramer V. The prevalence of personality disorders in a community sample. Archives of General Psychiatry. 2001;58:590–596. doi: 10.1001/archpsyc.58.6.590. [DOI] [PubMed] [Google Scholar]
- Ullrich S, Marneros A. Dimensions of personality disorders in offenders. Criminal Behaviour and Mental Health. 2004;14:202–213. doi: 10.1002/cbm.587. [DOI] [PubMed] [Google Scholar]
- Waller NG, Meehl PE. Multivariate taxometric procedures: Distinguishing types from continua. Sage; Newbury Park, CA: 1998. [Google Scholar]
- Zanarini MC, Frankenburg FR, Sickel AE, Yong L. The Diagnostic Interview for DSM-IV Personality Disorders (DIPD-IV) McLean Hospital and Harvard Medical School; Belmont, MA: 1996. [Google Scholar]
- Zanarini MC, Skodol AE, Bender D, Dolan R, Sanislow C, Schaefer E, et al. The Collaborative Longitudinal Personality Disorders Study: Reliability of Axis I and II diagnoses. Journal of Personality Disorders. 2000;14:291–299. doi: 10.1521/pedi.2000.14.4.291. [DOI] [PubMed] [Google Scholar]


